
Key Insights
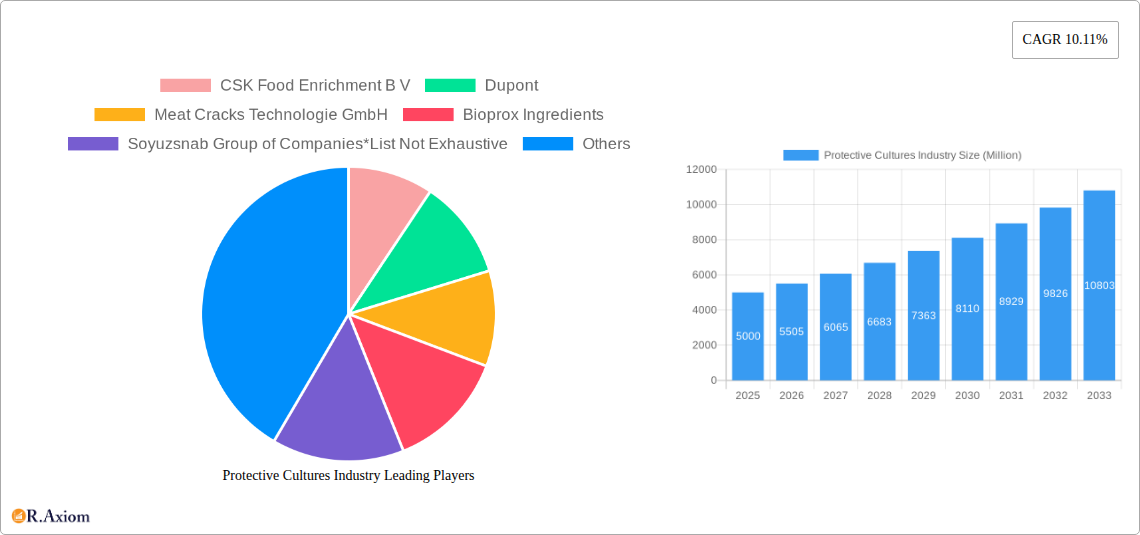
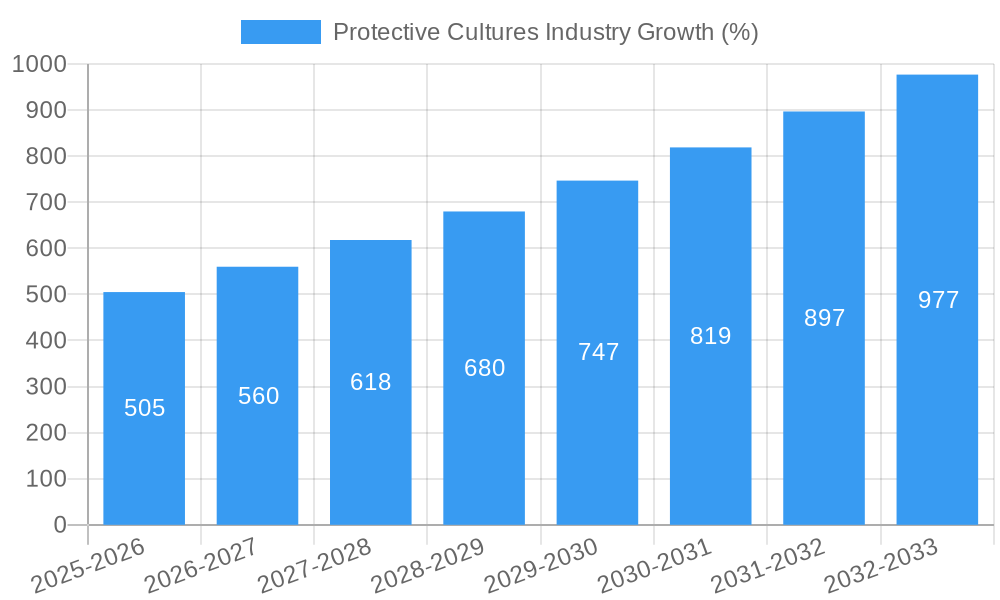
The global protective cultures market is experiencing robust growth, projected to reach a substantial size by 2033. A CAGR of 10.11% from 2019 to 2025 indicates a significant upward trajectory, driven primarily by increasing consumer demand for safe and high-quality food products. The rising prevalence of foodborne illnesses and stringent government regulations regarding food safety are key factors fueling market expansion. The freeze-dried form of protective cultures holds a dominant market share due to its extended shelf life and ease of handling, while yeasts are the most widely used microorganisms due to their effectiveness in inhibiting spoilage and pathogenic bacteria. Dairy products represent the largest application segment, followed by meat, poultry, and seafood products. Key players in this market are actively engaged in research and development, focusing on innovative culture strains with enhanced functionalities and improved efficacy. This ongoing innovation, coupled with the growing awareness of probiotics and their health benefits, further contributes to market growth.
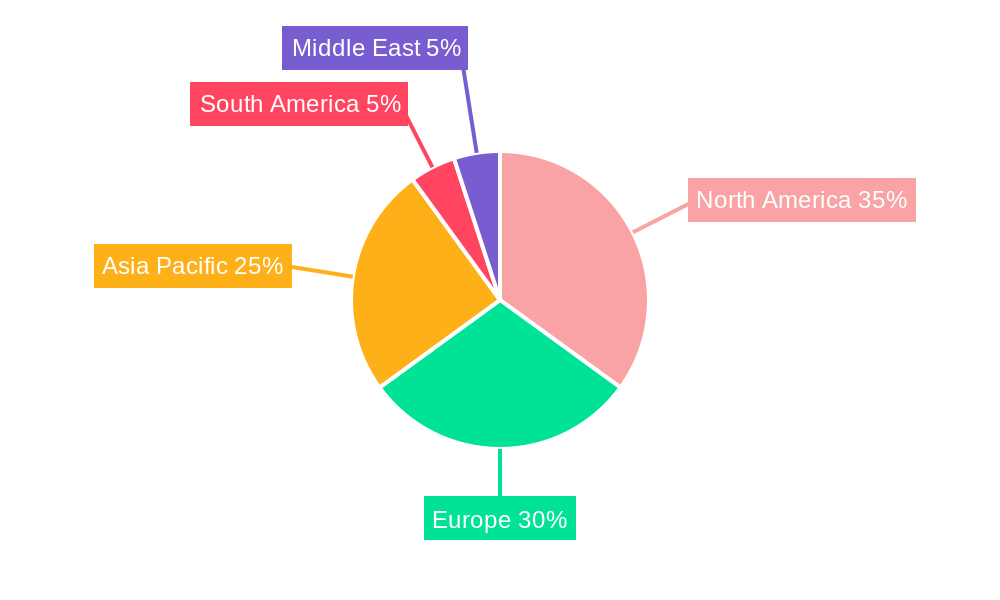
The market's geographical distribution shows strong presence across North America and Europe, reflecting established food processing industries and high consumer awareness. However, the Asia-Pacific region is anticipated to witness significant growth in the coming years, driven by rapid economic development, rising disposable incomes, and increasing urbanization. While the market faces restraints like high initial investment costs for adopting protective cultures and potential challenges in maintaining consistent quality during production, the overall market outlook remains positive. Further segmentation by factors like specific probiotic strains, packaging types, and distribution channels could provide more granular insights into market dynamics and growth potential. Future market growth will likely be influenced by technological advancements in culture development, stricter regulatory frameworks, and evolving consumer preferences regarding natural and organic food products.
Protective Cultures Industry: A Comprehensive Market Report (2019-2033)
This detailed report provides a comprehensive analysis of the Protective Cultures industry, covering market size, segmentation, key players, growth drivers, challenges, and future opportunities. The report utilizes data from the historical period (2019-2024), base year (2025), and estimated year (2025), projecting market trends until 2033. The total market size is expected to reach xx Million by 2033, exhibiting a CAGR of xx% during the forecast period (2025-2033).
Protective Cultures Industry Market Concentration & Innovation
The Protective Cultures market exhibits a moderately concentrated landscape, with several major players holding significant market share. Key players such as DSM Nutritional Products, DuPont, Chr. Hansen, and CSK Food Enrichment B.V. are driving innovation through substantial R&D investments and strategic partnerships. The market share of the top 5 players is estimated at xx% in 2025, while the remaining xx% is shared amongst numerous smaller players.
Innovation is driven by the increasing demand for clean-label products, extended shelf life, and enhanced food safety. Stringent regulatory frameworks, particularly concerning food safety and labeling, significantly influence industry practices. The emergence of novel bioprotective cultures and advanced technologies is a primary innovation driver. Product substitutes, such as chemical preservatives, continue to compete, but the rising consumer preference for natural and clean-label options favors the growth of protective cultures.
Mergers and acquisitions (M&A) are a common strategy among players seeking to expand their product portfolio and market reach. While precise M&A deal values are not publicly available for all transactions, the industry has witnessed a significant number of acquisitions in recent years, primarily focused on smaller, specialized companies with unique product lines or technologies. For example, the acquisition of xx company by xx company in xx resulted in a xx Million increase in market share.
Protective Cultures Industry Industry Trends & Insights
The global protective cultures market is experiencing robust growth, driven by several key factors. The rising consumer demand for extended shelf-life products, coupled with increasing awareness of food safety and hygiene, fuels market expansion. Technological advancements in culture development, such as the use of advanced genetic engineering techniques and high-throughput screening methods, are contributing to the development of more effective and efficient cultures. Furthermore, the growing adoption of clean-label technologies is boosting the demand for natural preservatives, like protective cultures, significantly impacting the market's trajectory.
The market exhibits regional variations in growth rates, with xx region demonstrating the highest growth due to factors such as increasing disposable income, changing dietary habits, and strong government support for the food industry. Consumer preferences are shifting towards healthier and more natural food options, creating significant opportunities for protective cultures in diverse applications. Competitive dynamics are shaped by innovation, pricing strategies, and brand recognition. The market penetration of freeze-dried cultures is relatively higher compared to frozen cultures, driven by their longer shelf life and ease of use. The overall market is expected to reach xx Million by 2033, with a CAGR of xx%.
Dominant Markets & Segments in Protective Cultures Industry
- Leading Region: The xx region currently dominates the global market, driven by factors such as a well-established food processing industry, favorable government regulations, and high consumer demand for processed food products.
- Leading Country: Within the xx region, xx is the leading country, owing to its large and well-developed food industry, with high investment in food processing and safety technologies.
- Dominant Segments:
- By Form: Freeze-dried cultures dominate the market due to their superior stability, ease of handling, and extended shelf life.
- By Microorganism Type: Bacteria-based protective cultures hold the largest market share, followed by yeasts and molds, owing to their diverse applications in various food products.
- By Application: Dairy products constitute the largest application segment, followed by meat, poultry, and seafood, owing to their susceptibility to microbial spoilage. Ready-to-eat food products are a growing segment.
Key drivers for market dominance include well-established infrastructure, favorable economic policies, and supportive government initiatives promoting food safety and processing technologies. The dominance of specific regions and segments is further reinforced by higher consumer demand, technological advancements, and the presence of major industry players within these specific markets.
Protective Cultures Industry Product Developments
Recent years have witnessed significant product innovations in protective cultures, emphasizing improved efficacy, broader applications, and enhanced convenience. The launch of new cultures tailored to specific applications, such as cheese, meat, and dairy products, has strengthened their market appeal. Technological advancements have resulted in cultures with greater resistance to harsh processing conditions, better stability, and enhanced preservation capabilities. These developments improve product safety and extend shelf-life, aligning with evolving consumer preferences and industry trends towards clean-label products.
Report Scope & Segmentation Analysis
This report segments the Protective Cultures market based on form (freeze-dried and frozen), microorganism type (yeasts, molds, and bacteria), and application (dairy products, meat, poultry and seafood products, ready-to-eat food products, and other applications). Each segment is analyzed in detail, providing growth projections, market size estimations, and competitive dynamics. The freeze-dried segment is projected to register a CAGR of xx% during the forecast period, while the bacteria-based cultures segment is expected to witness significant growth due to its efficacy in inhibiting spoilage microorganisms. The dairy products application segment dominates the market and is expected to continue its growth trajectory due to the increasing demand for dairy-based products worldwide.
Key Drivers of Protective Cultures Industry Growth
The growth of the Protective Cultures industry is fueled by several key factors. Firstly, the increasing consumer demand for extended shelf-life food products drives the adoption of these cultures. Secondly, stringent food safety regulations and growing awareness of foodborne illnesses necessitate the implementation of effective preservation methods, propelling the demand for protective cultures. Lastly, the rising preference for natural preservatives and clean-label products significantly boosts market growth, as protective cultures provide a natural alternative to chemical preservatives.
Challenges in the Protective Cultures Industry Sector
Despite the promising growth prospects, the Protective Cultures industry faces certain challenges. Regulatory hurdles and stringent approval processes can impede the launch of new products and increase the time to market. Supply chain complexities, particularly in sourcing high-quality raw materials, can affect the cost and availability of cultures. Furthermore, intense competition from established players and the emergence of new entrants can put pressure on profit margins and market share. These factors can collectively impede industry growth. For example, a xx% increase in regulatory compliance costs could reduce overall industry profits by xx Million.
Emerging Opportunities in Protective Cultures Industry
The Protective Cultures market presents various emerging opportunities. The growing demand for ready-to-eat and convenience food products opens new avenues for protective cultures. Furthermore, technological advancements in areas such as genetic engineering and precision fermentation offer scope for developing cultures with enhanced characteristics, like improved efficacy and broader application range. Finally, expanding into emerging economies with growing food processing industries provides significant untapped potential for market expansion.
Leading Players in the Protective Cultures Industry Market
- CSK Food Enrichment B V
- Dupont
- Meat Cracks Technologie GmbH
- Bioprox Ingredients
- Soyuzsnab Group of Companies
- DSM Nutritional Products
- Dalton Biotechnologies S R L
- Biochem S R L
- Aristomenis D Phikas & Co S A
- Sacco S R L
- THT S A
- Chr Hansen
Key Developments in Protective Cultures Industry Industry
- December 2017: CSK Food Enrichment B.V. expands R&D capabilities with a new facility.
- November 2017: Chr. Hansen launches the second generation of its FreshQ bio-protective cultures.
- April 2018: DuPont Nutrition & Health launches a new line of cheese cultures.
- June 2018: Meat Cracks Technologies GmbH launches a new variant of its M-Culture bioprotective cultures.
- October 2018: DuPont launches DuPont Danisco Lactobacillus Plus in South America.
- November 2018: DSM expands its Delvo Guard protective cultures.
These developments have significantly impacted market dynamics, driving innovation and expanding product applications within the Protective Cultures industry.
Strategic Outlook for Protective Cultures Industry Market
The future of the Protective Cultures market appears promising, driven by sustained demand for extended shelf-life and clean-label products. Continued innovation in culture development and advancements in processing technologies will shape market growth. Expanding into new geographical markets, especially developing economies with a high growth potential in the food processing industry, presents significant opportunities. The industry will continue to focus on developing sustainable and cost-effective solutions to meet the increasing demands of the food industry while addressing evolving consumer preferences.
Protective Cultures Industry Segmentation
-
1. Form
- 1.1. Freeze-Dried
- 1.2. Frozen
-
2. Microorganism Type
- 2.1. Yeasts
- 2.2. Molds
- 2.3. Bacteria
-
3. Application
- 3.1. Dairy Products
- 3.2. Meat, Poultry and Seafood Products
- 3.3. Ready to Eat Food Products
- 3.4. Other Applications
Protective Cultures Industry Segmentation By Geography
-
1. North America
- 1.1. United States
- 1.2. Canada
- 1.3. Mexico
- 1.4. Rest of North America
-
2. Europe
- 2.1. United Kingdom
- 2.2. Germany
- 2.3. Spain
- 2.4. France
- 2.5. Italy
- 2.6. Rest of Europe
-
3. Asia Pacific
- 3.1. China
- 3.2. Japan
- 3.3. India
- 3.4. Australia
- 3.5. Rest of Asia Pacific
-
4. South America
- 4.1. Brazil
- 4.2. Argentina
- 4.3. Rest of South America
- 5. Middle East
-
6. United Arab Emirates
- 6.1. South Africa
- 6.2. Rest of Middle East
Protective Cultures Industry REPORT HIGHLIGHTS
| Aspects | Details |
|---|---|
| Study Period | 2019-2033 |
| Base Year | 2024 |
| Estimated Year | 2025 |
| Forecast Period | 2025-2033 |
| Historical Period | 2019-2024 |
| Growth Rate | CAGR of 10.11% from 2019-2033 |
| Segmentation |
|
Table of Contents
- 1. Introduction
- 1.1. Research Scope
- 1.2. Market Segmentation
- 1.3. Research Methodology
- 1.4. Definitions and Assumptions
- 2. Executive Summary
- 2.1. Introduction
- 3. Market Dynamics
- 3.1. Introduction
- 3.2. Market Drivers
- 3.2.1. Rising Health Consciousness among consumer
- 3.3. Market Restrains
- 3.3.1. High Cost of natural Ingredients
- 3.4. Market Trends
- 3.4.1. Increasing Consumption of Dairy Products
- 4. Market Factor Analysis
- 4.1. Porters Five Forces
- 4.2. Supply/Value Chain
- 4.3. PESTEL analysis
- 4.4. Market Entropy
- 4.5. Patent/Trademark Analysis
- 5. Global Protective Cultures Industry Analysis, Insights and Forecast, 2019-2031
- 5.1. Market Analysis, Insights and Forecast - by Form
- 5.1.1. Freeze-Dried
- 5.1.2. Frozen
- 5.2. Market Analysis, Insights and Forecast - by Microorganism Type
- 5.2.1. Yeasts
- 5.2.2. Molds
- 5.2.3. Bacteria
- 5.3. Market Analysis, Insights and Forecast - by Application
- 5.3.1. Dairy Products
- 5.3.2. Meat, Poultry and Seafood Products
- 5.3.3. Ready to Eat Food Products
- 5.3.4. Other Applications
- 5.4. Market Analysis, Insights and Forecast - by Region
- 5.4.1. North America
- 5.4.2. Europe
- 5.4.3. Asia Pacific
- 5.4.4. South America
- 5.4.5. Middle East
- 5.4.6. United Arab Emirates
- 5.1. Market Analysis, Insights and Forecast - by Form
- 6. North America Protective Cultures Industry Analysis, Insights and Forecast, 2019-2031
- 6.1. Market Analysis, Insights and Forecast - by Form
- 6.1.1. Freeze-Dried
- 6.1.2. Frozen
- 6.2. Market Analysis, Insights and Forecast - by Microorganism Type
- 6.2.1. Yeasts
- 6.2.2. Molds
- 6.2.3. Bacteria
- 6.3. Market Analysis, Insights and Forecast - by Application
- 6.3.1. Dairy Products
- 6.3.2. Meat, Poultry and Seafood Products
- 6.3.3. Ready to Eat Food Products
- 6.3.4. Other Applications
- 6.1. Market Analysis, Insights and Forecast - by Form
- 7. Europe Protective Cultures Industry Analysis, Insights and Forecast, 2019-2031
- 7.1. Market Analysis, Insights and Forecast - by Form
- 7.1.1. Freeze-Dried
- 7.1.2. Frozen
- 7.2. Market Analysis, Insights and Forecast - by Microorganism Type
- 7.2.1. Yeasts
- 7.2.2. Molds
- 7.2.3. Bacteria
- 7.3. Market Analysis, Insights and Forecast - by Application
- 7.3.1. Dairy Products
- 7.3.2. Meat, Poultry and Seafood Products
- 7.3.3. Ready to Eat Food Products
- 7.3.4. Other Applications
- 7.1. Market Analysis, Insights and Forecast - by Form
- 8. Asia Pacific Protective Cultures Industry Analysis, Insights and Forecast, 2019-2031
- 8.1. Market Analysis, Insights and Forecast - by Form
- 8.1.1. Freeze-Dried
- 8.1.2. Frozen
- 8.2. Market Analysis, Insights and Forecast - by Microorganism Type
- 8.2.1. Yeasts
- 8.2.2. Molds
- 8.2.3. Bacteria
- 8.3. Market Analysis, Insights and Forecast - by Application
- 8.3.1. Dairy Products
- 8.3.2. Meat, Poultry and Seafood Products
- 8.3.3. Ready to Eat Food Products
- 8.3.4. Other Applications
- 8.1. Market Analysis, Insights and Forecast - by Form
- 9. South America Protective Cultures Industry Analysis, Insights and Forecast, 2019-2031
- 9.1. Market Analysis, Insights and Forecast - by Form
- 9.1.1. Freeze-Dried
- 9.1.2. Frozen
- 9.2. Market Analysis, Insights and Forecast - by Microorganism Type
- 9.2.1. Yeasts
- 9.2.2. Molds
- 9.2.3. Bacteria
- 9.3. Market Analysis, Insights and Forecast - by Application
- 9.3.1. Dairy Products
- 9.3.2. Meat, Poultry and Seafood Products
- 9.3.3. Ready to Eat Food Products
- 9.3.4. Other Applications
- 9.1. Market Analysis, Insights and Forecast - by Form
- 10. Middle East Protective Cultures Industry Analysis, Insights and Forecast, 2019-2031
- 10.1. Market Analysis, Insights and Forecast - by Form
- 10.1.1. Freeze-Dried
- 10.1.2. Frozen
- 10.2. Market Analysis, Insights and Forecast - by Microorganism Type
- 10.2.1. Yeasts
- 10.2.2. Molds
- 10.2.3. Bacteria
- 10.3. Market Analysis, Insights and Forecast - by Application
- 10.3.1. Dairy Products
- 10.3.2. Meat, Poultry and Seafood Products
- 10.3.3. Ready to Eat Food Products
- 10.3.4. Other Applications
- 10.1. Market Analysis, Insights and Forecast - by Form
- 11. United Arab Emirates Protective Cultures Industry Analysis, Insights and Forecast, 2019-2031
- 11.1. Market Analysis, Insights and Forecast - by Form
- 11.1.1. Freeze-Dried
- 11.1.2. Frozen
- 11.2. Market Analysis, Insights and Forecast - by Microorganism Type
- 11.2.1. Yeasts
- 11.2.2. Molds
- 11.2.3. Bacteria
- 11.3. Market Analysis, Insights and Forecast - by Application
- 11.3.1. Dairy Products
- 11.3.2. Meat, Poultry and Seafood Products
- 11.3.3. Ready to Eat Food Products
- 11.3.4. Other Applications
- 11.1. Market Analysis, Insights and Forecast - by Form
- 12. North America Protective Cultures Industry Analysis, Insights and Forecast, 2019-2031
- 12.1. Market Analysis, Insights and Forecast - By Country/Sub-region
- 12.1.1 United States
- 12.1.2 Canada
- 12.1.3 Mexico
- 12.1.4 Rest of North America
- 13. Europe Protective Cultures Industry Analysis, Insights and Forecast, 2019-2031
- 13.1. Market Analysis, Insights and Forecast - By Country/Sub-region
- 13.1.1 United Kingdom
- 13.1.2 Germany
- 13.1.3 Spain
- 13.1.4 France
- 13.1.5 Italy
- 13.1.6 Rest of Europe
- 14. Asia Pacific Protective Cultures Industry Analysis, Insights and Forecast, 2019-2031
- 14.1. Market Analysis, Insights and Forecast - By Country/Sub-region
- 14.1.1 China
- 14.1.2 Japan
- 14.1.3 India
- 14.1.4 Australia
- 14.1.5 Rest of Asia Pacific
- 15. South America Protective Cultures Industry Analysis, Insights and Forecast, 2019-2031
- 15.1. Market Analysis, Insights and Forecast - By Country/Sub-region
- 15.1.1 Brazil
- 15.1.2 Argentina
- 15.1.3 Rest of South America
- 16. Middle East Protective Cultures Industry Analysis, Insights and Forecast, 2019-2031
- 16.1. Market Analysis, Insights and Forecast - By Country/Sub-region
- 16.1.1.
- 17. United Arab Emirates Protective Cultures Industry Analysis, Insights and Forecast, 2019-2031
- 17.1. Market Analysis, Insights and Forecast - By Country/Sub-region
- 17.1.1 South Africa
- 17.1.2 Rest of Middle East
- 18. Competitive Analysis
- 18.1. Global Market Share Analysis 2024
- 18.2. Company Profiles
- 18.2.1 CSK Food Enrichment B V
- 18.2.1.1. Overview
- 18.2.1.2. Products
- 18.2.1.3. SWOT Analysis
- 18.2.1.4. Recent Developments
- 18.2.1.5. Financials (Based on Availability)
- 18.2.2 Dupont
- 18.2.2.1. Overview
- 18.2.2.2. Products
- 18.2.2.3. SWOT Analysis
- 18.2.2.4. Recent Developments
- 18.2.2.5. Financials (Based on Availability)
- 18.2.3 Meat Cracks Technologie GmbH
- 18.2.3.1. Overview
- 18.2.3.2. Products
- 18.2.3.3. SWOT Analysis
- 18.2.3.4. Recent Developments
- 18.2.3.5. Financials (Based on Availability)
- 18.2.4 Bioprox Ingredients
- 18.2.4.1. Overview
- 18.2.4.2. Products
- 18.2.4.3. SWOT Analysis
- 18.2.4.4. Recent Developments
- 18.2.4.5. Financials (Based on Availability)
- 18.2.5 Soyuzsnab Group of Companies*List Not Exhaustive
- 18.2.5.1. Overview
- 18.2.5.2. Products
- 18.2.5.3. SWOT Analysis
- 18.2.5.4. Recent Developments
- 18.2.5.5. Financials (Based on Availability)
- 18.2.6 DSM Nutritional Products
- 18.2.6.1. Overview
- 18.2.6.2. Products
- 18.2.6.3. SWOT Analysis
- 18.2.6.4. Recent Developments
- 18.2.6.5. Financials (Based on Availability)
- 18.2.7 Dalton Biotechnologies S R L
- 18.2.7.1. Overview
- 18.2.7.2. Products
- 18.2.7.3. SWOT Analysis
- 18.2.7.4. Recent Developments
- 18.2.7.5. Financials (Based on Availability)
- 18.2.8 Biochem S R L
- 18.2.8.1. Overview
- 18.2.8.2. Products
- 18.2.8.3. SWOT Analysis
- 18.2.8.4. Recent Developments
- 18.2.8.5. Financials (Based on Availability)
- 18.2.9 Aristomenis D Phikas & Co S A
- 18.2.9.1. Overview
- 18.2.9.2. Products
- 18.2.9.3. SWOT Analysis
- 18.2.9.4. Recent Developments
- 18.2.9.5. Financials (Based on Availability)
- 18.2.10 Sacco S R L
- 18.2.10.1. Overview
- 18.2.10.2. Products
- 18.2.10.3. SWOT Analysis
- 18.2.10.4. Recent Developments
- 18.2.10.5. Financials (Based on Availability)
- 18.2.11 THT S A
- 18.2.11.1. Overview
- 18.2.11.2. Products
- 18.2.11.3. SWOT Analysis
- 18.2.11.4. Recent Developments
- 18.2.11.5. Financials (Based on Availability)
- 18.2.12 Chr Hansen
- 18.2.12.1. Overview
- 18.2.12.2. Products
- 18.2.12.3. SWOT Analysis
- 18.2.12.4. Recent Developments
- 18.2.12.5. Financials (Based on Availability)
- 18.2.1 CSK Food Enrichment B V
List of Figures
- Figure 1: Global Protective Cultures Industry Revenue Breakdown (Million, %) by Region 2024 & 2032
- Figure 2: North America Protective Cultures Industry Revenue (Million), by Country 2024 & 2032
- Figure 3: North America Protective Cultures Industry Revenue Share (%), by Country 2024 & 2032
- Figure 4: Europe Protective Cultures Industry Revenue (Million), by Country 2024 & 2032
- Figure 5: Europe Protective Cultures Industry Revenue Share (%), by Country 2024 & 2032
- Figure 6: Asia Pacific Protective Cultures Industry Revenue (Million), by Country 2024 & 2032
- Figure 7: Asia Pacific Protective Cultures Industry Revenue Share (%), by Country 2024 & 2032
- Figure 8: South America Protective Cultures Industry Revenue (Million), by Country 2024 & 2032
- Figure 9: South America Protective Cultures Industry Revenue Share (%), by Country 2024 & 2032
- Figure 10: Middle East Protective Cultures Industry Revenue (Million), by Country 2024 & 2032
- Figure 11: Middle East Protective Cultures Industry Revenue Share (%), by Country 2024 & 2032
- Figure 12: United Arab Emirates Protective Cultures Industry Revenue (Million), by Country 2024 & 2032
- Figure 13: United Arab Emirates Protective Cultures Industry Revenue Share (%), by Country 2024 & 2032
- Figure 14: North America Protective Cultures Industry Revenue (Million), by Form 2024 & 2032
- Figure 15: North America Protective Cultures Industry Revenue Share (%), by Form 2024 & 2032
- Figure 16: North America Protective Cultures Industry Revenue (Million), by Microorganism Type 2024 & 2032
- Figure 17: North America Protective Cultures Industry Revenue Share (%), by Microorganism Type 2024 & 2032
- Figure 18: North America Protective Cultures Industry Revenue (Million), by Application 2024 & 2032
- Figure 19: North America Protective Cultures Industry Revenue Share (%), by Application 2024 & 2032
- Figure 20: North America Protective Cultures Industry Revenue (Million), by Country 2024 & 2032
- Figure 21: North America Protective Cultures Industry Revenue Share (%), by Country 2024 & 2032
- Figure 22: Europe Protective Cultures Industry Revenue (Million), by Form 2024 & 2032
- Figure 23: Europe Protective Cultures Industry Revenue Share (%), by Form 2024 & 2032
- Figure 24: Europe Protective Cultures Industry Revenue (Million), by Microorganism Type 2024 & 2032
- Figure 25: Europe Protective Cultures Industry Revenue Share (%), by Microorganism Type 2024 & 2032
- Figure 26: Europe Protective Cultures Industry Revenue (Million), by Application 2024 & 2032
- Figure 27: Europe Protective Cultures Industry Revenue Share (%), by Application 2024 & 2032
- Figure 28: Europe Protective Cultures Industry Revenue (Million), by Country 2024 & 2032
- Figure 29: Europe Protective Cultures Industry Revenue Share (%), by Country 2024 & 2032
- Figure 30: Asia Pacific Protective Cultures Industry Revenue (Million), by Form 2024 & 2032
- Figure 31: Asia Pacific Protective Cultures Industry Revenue Share (%), by Form 2024 & 2032
- Figure 32: Asia Pacific Protective Cultures Industry Revenue (Million), by Microorganism Type 2024 & 2032
- Figure 33: Asia Pacific Protective Cultures Industry Revenue Share (%), by Microorganism Type 2024 & 2032
- Figure 34: Asia Pacific Protective Cultures Industry Revenue (Million), by Application 2024 & 2032
- Figure 35: Asia Pacific Protective Cultures Industry Revenue Share (%), by Application 2024 & 2032
- Figure 36: Asia Pacific Protective Cultures Industry Revenue (Million), by Country 2024 & 2032
- Figure 37: Asia Pacific Protective Cultures Industry Revenue Share (%), by Country 2024 & 2032
- Figure 38: South America Protective Cultures Industry Revenue (Million), by Form 2024 & 2032
- Figure 39: South America Protective Cultures Industry Revenue Share (%), by Form 2024 & 2032
- Figure 40: South America Protective Cultures Industry Revenue (Million), by Microorganism Type 2024 & 2032
- Figure 41: South America Protective Cultures Industry Revenue Share (%), by Microorganism Type 2024 & 2032
- Figure 42: South America Protective Cultures Industry Revenue (Million), by Application 2024 & 2032
- Figure 43: South America Protective Cultures Industry Revenue Share (%), by Application 2024 & 2032
- Figure 44: South America Protective Cultures Industry Revenue (Million), by Country 2024 & 2032
- Figure 45: South America Protective Cultures Industry Revenue Share (%), by Country 2024 & 2032
- Figure 46: Middle East Protective Cultures Industry Revenue (Million), by Form 2024 & 2032
- Figure 47: Middle East Protective Cultures Industry Revenue Share (%), by Form 2024 & 2032
- Figure 48: Middle East Protective Cultures Industry Revenue (Million), by Microorganism Type 2024 & 2032
- Figure 49: Middle East Protective Cultures Industry Revenue Share (%), by Microorganism Type 2024 & 2032
- Figure 50: Middle East Protective Cultures Industry Revenue (Million), by Application 2024 & 2032
- Figure 51: Middle East Protective Cultures Industry Revenue Share (%), by Application 2024 & 2032
- Figure 52: Middle East Protective Cultures Industry Revenue (Million), by Country 2024 & 2032
- Figure 53: Middle East Protective Cultures Industry Revenue Share (%), by Country 2024 & 2032
- Figure 54: United Arab Emirates Protective Cultures Industry Revenue (Million), by Form 2024 & 2032
- Figure 55: United Arab Emirates Protective Cultures Industry Revenue Share (%), by Form 2024 & 2032
- Figure 56: United Arab Emirates Protective Cultures Industry Revenue (Million), by Microorganism Type 2024 & 2032
- Figure 57: United Arab Emirates Protective Cultures Industry Revenue Share (%), by Microorganism Type 2024 & 2032
- Figure 58: United Arab Emirates Protective Cultures Industry Revenue (Million), by Application 2024 & 2032
- Figure 59: United Arab Emirates Protective Cultures Industry Revenue Share (%), by Application 2024 & 2032
- Figure 60: United Arab Emirates Protective Cultures Industry Revenue (Million), by Country 2024 & 2032
- Figure 61: United Arab Emirates Protective Cultures Industry Revenue Share (%), by Country 2024 & 2032
List of Tables
- Table 1: Global Protective Cultures Industry Revenue Million Forecast, by Region 2019 & 2032
- Table 2: Global Protective Cultures Industry Revenue Million Forecast, by Form 2019 & 2032
- Table 3: Global Protective Cultures Industry Revenue Million Forecast, by Microorganism Type 2019 & 2032
- Table 4: Global Protective Cultures Industry Revenue Million Forecast, by Application 2019 & 2032
- Table 5: Global Protective Cultures Industry Revenue Million Forecast, by Region 2019 & 2032
- Table 6: Global Protective Cultures Industry Revenue Million Forecast, by Country 2019 & 2032
- Table 7: United States Protective Cultures Industry Revenue (Million) Forecast, by Application 2019 & 2032
- Table 8: Canada Protective Cultures Industry Revenue (Million) Forecast, by Application 2019 & 2032
- Table 9: Mexico Protective Cultures Industry Revenue (Million) Forecast, by Application 2019 & 2032
- Table 10: Rest of North America Protective Cultures Industry Revenue (Million) Forecast, by Application 2019 & 2032
- Table 11: Global Protective Cultures Industry Revenue Million Forecast, by Country 2019 & 2032
- Table 12: United Kingdom Protective Cultures Industry Revenue (Million) Forecast, by Application 2019 & 2032
- Table 13: Germany Protective Cultures Industry Revenue (Million) Forecast, by Application 2019 & 2032
- Table 14: Spain Protective Cultures Industry Revenue (Million) Forecast, by Application 2019 & 2032
- Table 15: France Protective Cultures Industry Revenue (Million) Forecast, by Application 2019 & 2032
- Table 16: Italy Protective Cultures Industry Revenue (Million) Forecast, by Application 2019 & 2032
- Table 17: Rest of Europe Protective Cultures Industry Revenue (Million) Forecast, by Application 2019 & 2032
- Table 18: Global Protective Cultures Industry Revenue Million Forecast, by Country 2019 & 2032
- Table 19: China Protective Cultures Industry Revenue (Million) Forecast, by Application 2019 & 2032
- Table 20: Japan Protective Cultures Industry Revenue (Million) Forecast, by Application 2019 & 2032
- Table 21: India Protective Cultures Industry Revenue (Million) Forecast, by Application 2019 & 2032
- Table 22: Australia Protective Cultures Industry Revenue (Million) Forecast, by Application 2019 & 2032
- Table 23: Rest of Asia Pacific Protective Cultures Industry Revenue (Million) Forecast, by Application 2019 & 2032
- Table 24: Global Protective Cultures Industry Revenue Million Forecast, by Country 2019 & 2032
- Table 25: Brazil Protective Cultures Industry Revenue (Million) Forecast, by Application 2019 & 2032
- Table 26: Argentina Protective Cultures Industry Revenue (Million) Forecast, by Application 2019 & 2032
- Table 27: Rest of South America Protective Cultures Industry Revenue (Million) Forecast, by Application 2019 & 2032
- Table 28: Global Protective Cultures Industry Revenue Million Forecast, by Country 2019 & 2032
- Table 29: Protective Cultures Industry Revenue (Million) Forecast, by Application 2019 & 2032
- Table 30: Global Protective Cultures Industry Revenue Million Forecast, by Country 2019 & 2032
- Table 31: South Africa Protective Cultures Industry Revenue (Million) Forecast, by Application 2019 & 2032
- Table 32: Rest of Middle East Protective Cultures Industry Revenue (Million) Forecast, by Application 2019 & 2032
- Table 33: Global Protective Cultures Industry Revenue Million Forecast, by Form 2019 & 2032
- Table 34: Global Protective Cultures Industry Revenue Million Forecast, by Microorganism Type 2019 & 2032
- Table 35: Global Protective Cultures Industry Revenue Million Forecast, by Application 2019 & 2032
- Table 36: Global Protective Cultures Industry Revenue Million Forecast, by Country 2019 & 2032
- Table 37: United States Protective Cultures Industry Revenue (Million) Forecast, by Application 2019 & 2032
- Table 38: Canada Protective Cultures Industry Revenue (Million) Forecast, by Application 2019 & 2032
- Table 39: Mexico Protective Cultures Industry Revenue (Million) Forecast, by Application 2019 & 2032
- Table 40: Rest of North America Protective Cultures Industry Revenue (Million) Forecast, by Application 2019 & 2032
- Table 41: Global Protective Cultures Industry Revenue Million Forecast, by Form 2019 & 2032
- Table 42: Global Protective Cultures Industry Revenue Million Forecast, by Microorganism Type 2019 & 2032
- Table 43: Global Protective Cultures Industry Revenue Million Forecast, by Application 2019 & 2032
- Table 44: Global Protective Cultures Industry Revenue Million Forecast, by Country 2019 & 2032
- Table 45: United Kingdom Protective Cultures Industry Revenue (Million) Forecast, by Application 2019 & 2032
- Table 46: Germany Protective Cultures Industry Revenue (Million) Forecast, by Application 2019 & 2032
- Table 47: Spain Protective Cultures Industry Revenue (Million) Forecast, by Application 2019 & 2032
- Table 48: France Protective Cultures Industry Revenue (Million) Forecast, by Application 2019 & 2032
- Table 49: Italy Protective Cultures Industry Revenue (Million) Forecast, by Application 2019 & 2032
- Table 50: Rest of Europe Protective Cultures Industry Revenue (Million) Forecast, by Application 2019 & 2032
- Table 51: Global Protective Cultures Industry Revenue Million Forecast, by Form 2019 & 2032
- Table 52: Global Protective Cultures Industry Revenue Million Forecast, by Microorganism Type 2019 & 2032
- Table 53: Global Protective Cultures Industry Revenue Million Forecast, by Application 2019 & 2032
- Table 54: Global Protective Cultures Industry Revenue Million Forecast, by Country 2019 & 2032
- Table 55: China Protective Cultures Industry Revenue (Million) Forecast, by Application 2019 & 2032
- Table 56: Japan Protective Cultures Industry Revenue (Million) Forecast, by Application 2019 & 2032
- Table 57: India Protective Cultures Industry Revenue (Million) Forecast, by Application 2019 & 2032
- Table 58: Australia Protective Cultures Industry Revenue (Million) Forecast, by Application 2019 & 2032
- Table 59: Rest of Asia Pacific Protective Cultures Industry Revenue (Million) Forecast, by Application 2019 & 2032
- Table 60: Global Protective Cultures Industry Revenue Million Forecast, by Form 2019 & 2032
- Table 61: Global Protective Cultures Industry Revenue Million Forecast, by Microorganism Type 2019 & 2032
- Table 62: Global Protective Cultures Industry Revenue Million Forecast, by Application 2019 & 2032
- Table 63: Global Protective Cultures Industry Revenue Million Forecast, by Country 2019 & 2032
- Table 64: Brazil Protective Cultures Industry Revenue (Million) Forecast, by Application 2019 & 2032
- Table 65: Argentina Protective Cultures Industry Revenue (Million) Forecast, by Application 2019 & 2032
- Table 66: Rest of South America Protective Cultures Industry Revenue (Million) Forecast, by Application 2019 & 2032
- Table 67: Global Protective Cultures Industry Revenue Million Forecast, by Form 2019 & 2032
- Table 68: Global Protective Cultures Industry Revenue Million Forecast, by Microorganism Type 2019 & 2032
- Table 69: Global Protective Cultures Industry Revenue Million Forecast, by Application 2019 & 2032
- Table 70: Global Protective Cultures Industry Revenue Million Forecast, by Country 2019 & 2032
- Table 71: Global Protective Cultures Industry Revenue Million Forecast, by Form 2019 & 2032
- Table 72: Global Protective Cultures Industry Revenue Million Forecast, by Microorganism Type 2019 & 2032
- Table 73: Global Protective Cultures Industry Revenue Million Forecast, by Application 2019 & 2032
- Table 74: Global Protective Cultures Industry Revenue Million Forecast, by Country 2019 & 2032
- Table 75: South Africa Protective Cultures Industry Revenue (Million) Forecast, by Application 2019 & 2032
- Table 76: Rest of Middle East Protective Cultures Industry Revenue (Million) Forecast, by Application 2019 & 2032
Frequently Asked Questions
1. What is the projected Compound Annual Growth Rate (CAGR) of the Protective Cultures Industry?
The projected CAGR is approximately 10.11%.
2. Which companies are prominent players in the Protective Cultures Industry?
Key companies in the market include CSK Food Enrichment B V, Dupont, Meat Cracks Technologie GmbH, Bioprox Ingredients, Soyuzsnab Group of Companies*List Not Exhaustive, DSM Nutritional Products, Dalton Biotechnologies S R L, Biochem S R L, Aristomenis D Phikas & Co S A, Sacco S R L, THT S A, Chr Hansen.
3. What are the main segments of the Protective Cultures Industry?
The market segments include Form, Microorganism Type, Application.
4. Can you provide details about the market size?
The market size is estimated to be USD XX Million as of 2022.
5. What are some drivers contributing to market growth?
Rising Health Consciousness among consumer.
6. What are the notable trends driving market growth?
Increasing Consumption of Dairy Products.
7. Are there any restraints impacting market growth?
High Cost of natural Ingredients.
8. Can you provide examples of recent developments in the market?
In November 2018, DSM expanded its Delvo Guard protective cultures to reinforce safety standards for clean label products. The culture is designed to prevent the formation of yeasts & molds in dairy products to extend the shelf life of products without any effect on the taste and texture
9. What pricing options are available for accessing the report?
Pricing options include single-user, multi-user, and enterprise licenses priced at USD 4750, USD 5250, and USD 8750 respectively.
10. Is the market size provided in terms of value or volume?
The market size is provided in terms of value, measured in Million.
11. Are there any specific market keywords associated with the report?
Yes, the market keyword associated with the report is "Protective Cultures Industry," which aids in identifying and referencing the specific market segment covered.
12. How do I determine which pricing option suits my needs best?
The pricing options vary based on user requirements and access needs. Individual users may opt for single-user licenses, while businesses requiring broader access may choose multi-user or enterprise licenses for cost-effective access to the report.
13. Are there any additional resources or data provided in the Protective Cultures Industry report?
While the report offers comprehensive insights, it's advisable to review the specific contents or supplementary materials provided to ascertain if additional resources or data are available.
14. How can I stay updated on further developments or reports in the Protective Cultures Industry?
To stay informed about further developments, trends, and reports in the Protective Cultures Industry, consider subscribing to industry newsletters, following relevant companies and organizations, or regularly checking reputable industry news sources and publications.
Methodology
Step 1 - Identification of Relevant Samples Size from Population Database


Step 2 - Approaches for Defining Global Market Size (Value, Volume* & Price*)

Note*: In applicable scenarios
Step 3 - Data Sources
Primary Research
- Web Analytics
- Survey Reports
- Research Institute
- Latest Research Reports
- Opinion Leaders
Secondary Research
- Annual Reports
- White Paper
- Latest Press Release
- Industry Association
- Paid Database
- Investor Presentations

Step 4 - Data Triangulation
Involves using different sources of information in order to increase the validity of a study
These sources are likely to be stakeholders in a program - participants, other researchers, program staff, other community members, and so on.
Then we put all data in single framework & apply various statistical tools to find out the dynamic on the market.
During the analysis stage, feedback from the stakeholder groups would be compared to determine areas of agreement as well as areas of divergence


