

Key Insights
The global protective eyewear market, encompassing spectacles, welding protection glasses, overspecs, and goggles, is projected to reach 4.38 billion by 2025, with a Compound Annual Growth Rate (CAGR) of 4.54%. Despite a historically modest CAGR, current market trends indicate steady expansion driven by key factors. Increasing industrialization and construction activities globally, especially in developing Asia-Pacific economies, are significant demand drivers. Stringent safety regulations across industries such as automotive, construction, pharmaceuticals, and oil & gas mandate the use of protective eyewear, further propelling market growth. Technological innovations contributing to lighter, more comfortable, and functionally advanced eyewear also play a crucial role. The market features a diverse product landscape, with spectacles and goggles expected to lead in market share due to their broad applicability. While North America and Europe are anticipated to retain substantial market share owing to established safety standards and robust industrial sectors, the Asia-Pacific region is set for considerable growth fueled by rapid industrialization and a burgeoning construction sector.
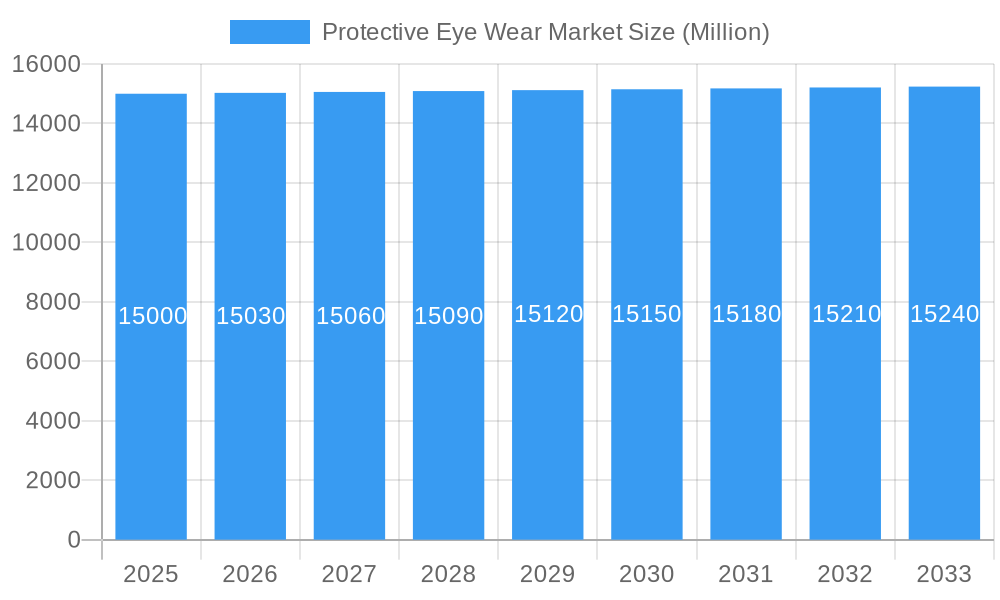
Protective Eye Wear Market Market Size (In Billion)
While positive growth drivers are present, the market encounters challenges including price sensitivity in developing regions and intense competition among established players, necessitating continuous innovation. Economic downturns can impact demand, particularly in capital-intensive sectors. The long-term rise of virtual and augmented reality technologies may present new safety considerations and require specialized protective eyewear, offering both challenges and opportunities. The protective eyewear market offers significant opportunities for targeted penetration and strategic expansion across its diverse segments and geographic regions.
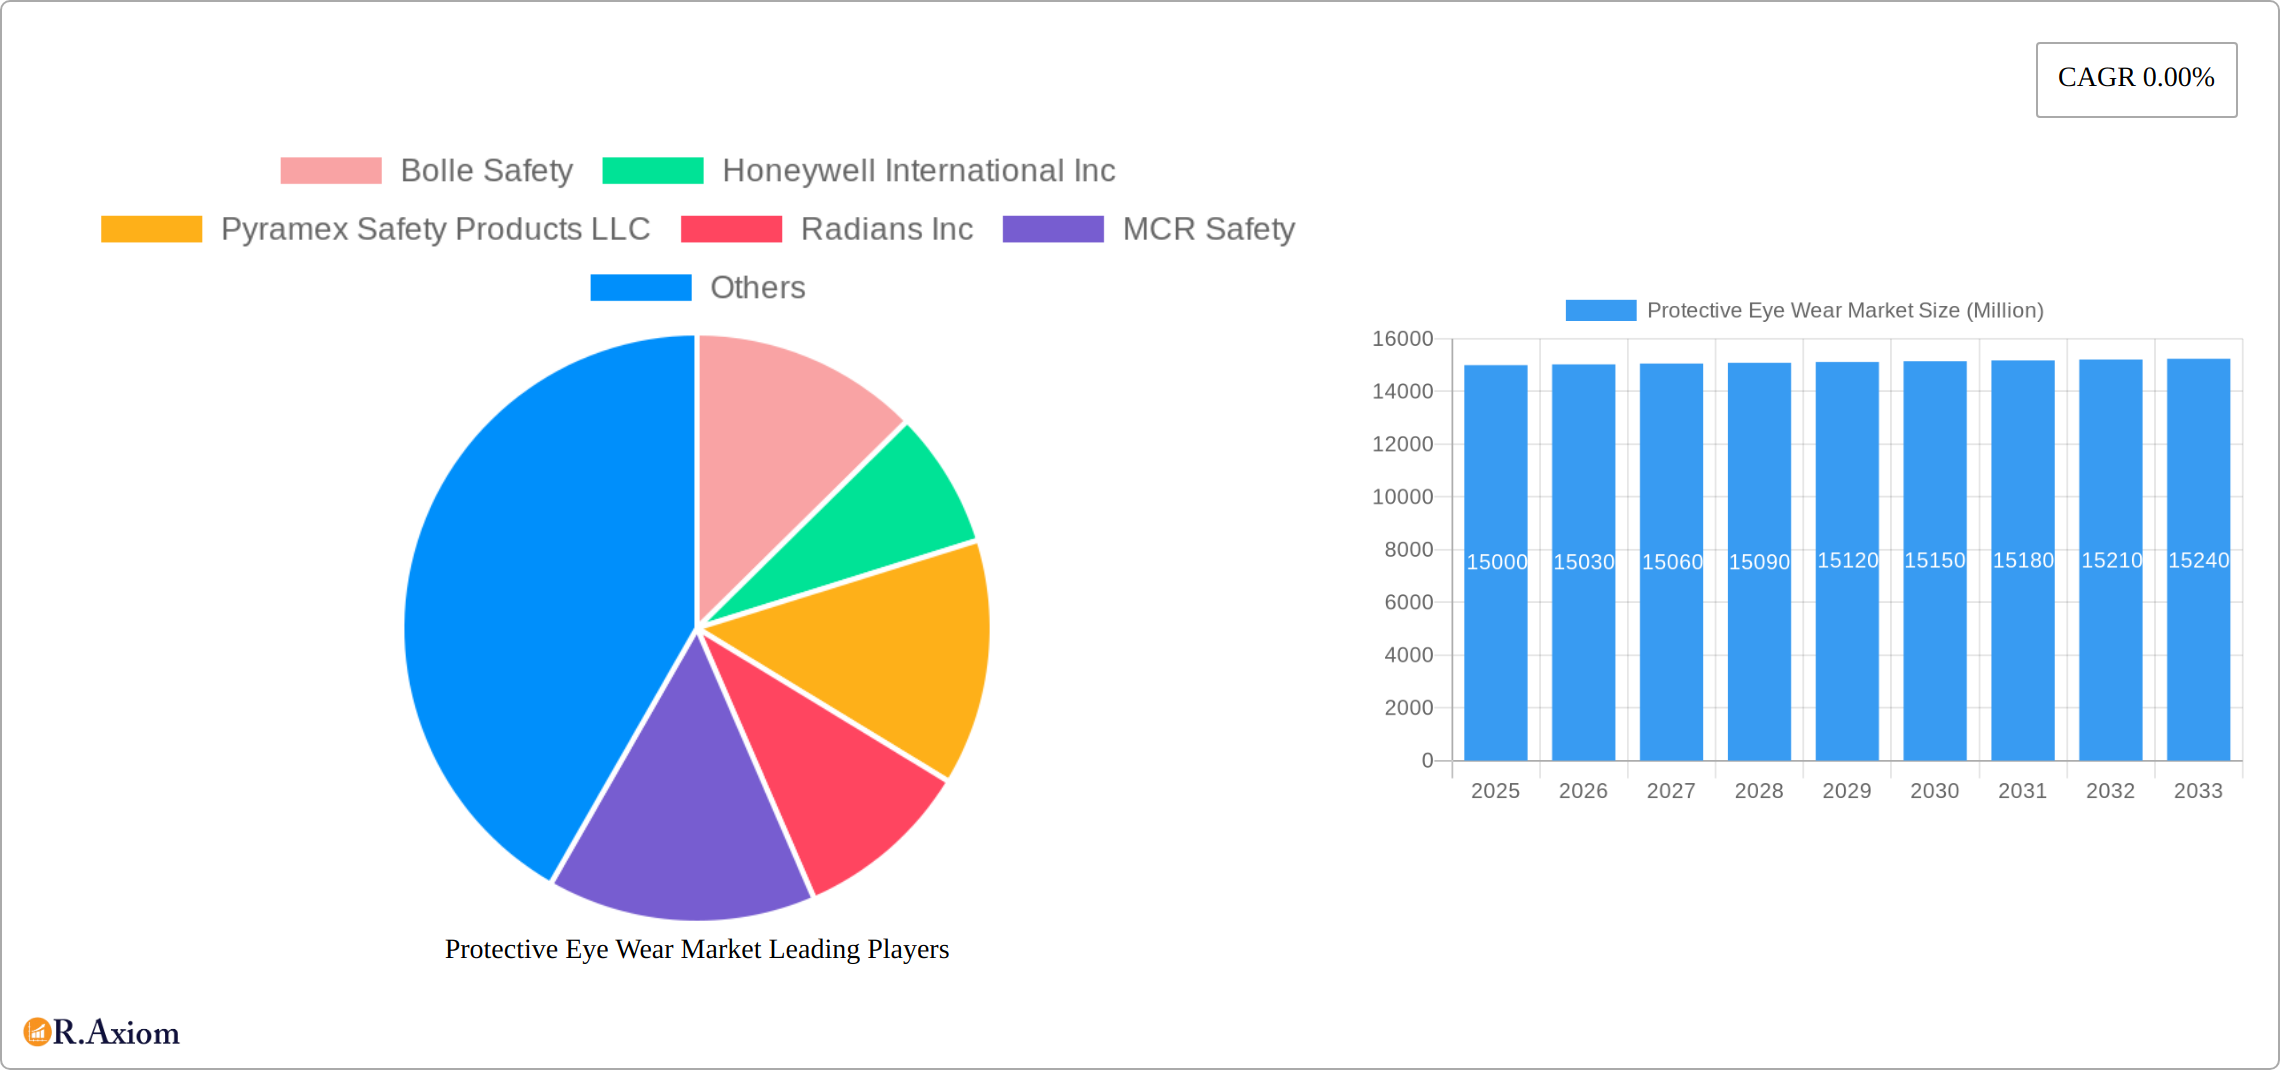
Protective Eye Wear Market Company Market Share
Protective Eye Wear Market: A Comprehensive Report (2019-2033)
This detailed report provides a comprehensive analysis of the global Protective Eye Wear Market, offering valuable insights for industry stakeholders, investors, and businesses seeking to understand this dynamic sector. The study period covers 2019-2033, with 2025 serving as the base and estimated year. The report meticulously examines market size, growth drivers, challenges, opportunities, and competitive dynamics, providing a robust forecast from 2025-2033.
Protective Eye Wear Market Concentration & Innovation
The Protective Eye Wear Market exhibits a moderately concentrated landscape, with several key players holding significant market share. While precise market share figures for individual companies are proprietary data within the full report, preliminary analysis suggests that 3M Company, Honeywell International Inc, and uvex group are among the leading players, commanding a combined xx% of the market in 2024. This concentration is driven by substantial investments in R&D, established distribution networks, and strong brand recognition. However, the market also witnesses significant innovation from smaller players, introducing specialized products catering to niche applications.
- Innovation Drivers: Technological advancements in lens materials (e.g., polycarbonate, anti-fog coatings), frame designs (ergonomic and lightweight options), and integrated technologies (e.g., Bluetooth connectivity for industrial monitoring) are key innovation drivers.
- Regulatory Frameworks: Stringent safety regulations across various industries (e.g., OSHA, ANSI) play a crucial role in driving adoption of protective eyewear, impacting market growth significantly. Compliance requirements fuel demand for certified and high-quality products.
- Product Substitutes: While limited, alternatives such as basic eye shields or welding helmets exist but lack the versatility, comfort, and advanced features offered by modern protective eyewear.
- End-User Trends: Growing awareness of eye safety and the increasing prevalence of workplace accidents drive demand for protective eyewear across diverse sectors. Further, trends like personalized eyewear and customized protection solutions are gaining traction.
- M&A Activities: The Protective Eye Wear Market has witnessed moderate M&A activity in recent years, with deal values ranging from xx Million to xx Million. These acquisitions primarily focus on expanding product portfolios, enhancing distribution channels, and gaining access to specialized technologies.
Protective Eye Wear Market Industry Trends & Insights
The global Protective Eye Wear Market is experiencing robust growth, with a projected CAGR of xx% during the forecast period (2025-2033). This growth is primarily driven by several factors: increasing industrialization in developing economies, rising awareness of workplace eye safety, stringent government regulations promoting safety equipment adoption, and technological advancements leading to more comfortable and efficient eyewear. Market penetration remains relatively high in developed nations, but significant growth opportunities exist in emerging markets where safety standards are improving. Technological disruptions are shaping the landscape, with the integration of smart features and advanced materials increasing the market value proposition for end-users. Consumer preferences are shifting towards lighter, more comfortable, and stylish designs that do not compromise on safety. The competitive landscape is characterized by both established players and emerging startups vying for market share. This fosters innovation and enhances the overall value proposition for consumers.
Dominant Markets & Segments in Protective Eye Wear Market
The Construction industry remains a cornerstone of the protective eyewear market, driven by the inherent and significant risks associated with construction activities. The North American region continues to command a substantial market share, propelled by stringent safety regulations, a robust construction sector, and a strong emphasis on worker welfare. Within product categories, Goggles and Spectacles collectively represent the largest market segments due to their extensive applicability across a wide spectrum of industrial and commercial environments.
-
Key Drivers for Construction Sector Dominance:
- The unwavering enforcement of comprehensive safety regulations and standards.
- A persistently high incidence of eye-related injuries in construction settings, underscoring the need for effective protection.
- Continuous and substantial investment in infrastructure development projects globally.
- Increasing adoption of advanced safety protocols and personal protective equipment (PPE) mandates.
-
Dominance Analysis: North America's leadership is firmly established due to its mature construction industry, rigorous safety standards, and high disposable incomes enabling premium product adoption. However, the Asia Pacific region is projected to experience explosive growth, fueled by rapid industrialization, significant urbanization, and a burgeoning manufacturing base, positioning it as a critical hub for future market expansion and opportunity.
-
Product Type Segmentation:
- Spectacles: This segment is characterized by an expansive array of designs, catering to diverse needs, including prescription-ready options for those requiring vision correction and non-prescription variants for general safety.
- Welding Protection Glasses: A specialized segment crucial for industrial applications, featuring advanced, tinted, and UV-filtering lenses designed to shield against intense light, sparks, and heat generated during welding operations.
- Overspecs (OTG - Over The Glasses): This is a rapidly growing segment, specifically designed to be worn over existing prescription eyewear, providing an accessible and effective layer of protection without compromising the wearer's vision correction.
- Goggles: Remaining a dominant segment due to their superior sealing capabilities, offering comprehensive protection against a wide range of hazards including dust, chemical splashes, impacts, and airborne particles, making them indispensable in many environments.
- Face Shields: While not explicitly mentioned in the old content, face shields are increasingly being adopted alongside eye protection for comprehensive facial coverage, especially in industries with a high risk of splashes or flying debris.
-
End-User Industry Segmentation:
- Automotive: Driven by rigorous manufacturing processes, assembly lines, and maintenance activities requiring reliable eye protection.
- Construction: The largest and most vital segment due to the inherent risks of falling objects, debris, chemical exposure, and impact hazards, coupled with strong regulatory oversight.
- Food Industry: Focuses on protecting workers from chemical splashes, airborne particles, and maintaining hygiene standards to prevent contamination.
- Pharmaceutical: Adheres to extremely stringent standards for sterile environments, requiring protection against airborne particulates, chemical splashes, and biohazards.
- Mining: Demands robust and durable eyewear to guard against heavy dust, rock fragments, impact, and abrasion in harsh operational conditions.
- Oil and Gas: Essential for protecting workers from hazardous chemicals, high-impact debris, extreme temperatures, and potential explosions in volatile environments.
- Healthcare: Growing demand for protection against biological fluids, splashes, and airborne pathogens, particularly in medical procedures and laboratory settings.
- Manufacturing and Logistics: Covers a broad range of applications including machine operation, material handling, and warehousing, where impact and debris protection are paramount.
- Other End-User Industries: Encompasses diverse sectors such as chemical processing, electrical work, laboratories, sports, and general industrial maintenance.
Protective Eye Wear Market Product Developments
Recent innovations in the protective eyewear market are heavily focused on elevating user experience through enhanced comfort, superior protection, and the seamless integration of advanced technologies. Key trends include the widespread adoption of ultra-lightweight materials for reduced fatigue, the development of sophisticated lens coatings that offer superior anti-fog and anti-scratch resistance, and the introduction of specialized lens filters optimized for specific hazardous environments (e.g., enhanced UV protection, glare reduction, specific color filtering for improved visibility). Manufacturers are also prioritizing ergonomic designs and customizable features, such as adjustable nose pads and temple arms, to improve fit, comfort, and ultimately, user compliance. A significant emerging trend is the integration of 'smart' functionalities, with the development of eyewear incorporating sensors for real-time monitoring of worker safety parameters, environmental conditions, and even biometric data, paving the way for predictive safety measures and enhanced operational efficiency.
Report Scope & Segmentation Analysis
This report segments the Protective Eye Wear Market based on Product Type (Spectacles, Welding Protection Glasses, Overspecs, Goggles) and End-User Industry (Automotive, Construction, Food Industry, Pharmaceutical, Mining, Oil and Gas, Other End-User Industries). Each segment is analyzed in detail, providing market size estimates, growth projections, and competitive dynamics. Growth projections vary across segments, with the Construction and Automotive industries exhibiting strong growth, followed by the Pharmaceutical and Food industries. Competitive intensity varies by segment, with established players in certain niches and emerging new entrants in others.
Key Drivers of Protective Eye Wear Market Growth
Key growth drivers include stringent safety regulations, rising awareness of eye safety, technological advancements in lens materials and design, and increased industrialization globally. Economic growth, particularly in developing countries, further fuels demand. Government initiatives promoting workplace safety also contribute significantly to market expansion.
Challenges in the Protective Eye Wear Market Sector
Key challenges include price fluctuations in raw materials, intense competition from both established players and new entrants, and the potential for counterfeit products. Supply chain disruptions and fluctuations in global demand also pose significant challenges. Additionally, achieving consistent adoption of protective eyewear in certain regions due to cost or awareness limitations, presents a persistent obstacle.
Emerging Opportunities in Protective Eye Wear Market
The protective eyewear market is ripe with emerging opportunities driven by technological advancements and evolving industry needs. The burgeoning field of smart protective eyewear, equipped with integrated sensors, communication capabilities, and augmented reality overlays, presents a significant avenue for innovation and market penetration. Furthermore, the demand for personalized eyewear solutions, tailored to individual facial structures and specific job requirements, is on the rise. The rapid industrialization and economic growth in developing economies, particularly in Asia Pacific and Latin America, represent substantial untapped markets with increasing safety awareness and regulatory adoption. Additionally, specialized eyewear designed for niche applications, such as protection within virtual reality (VR) and augmented reality (AR) environments, is opening up entirely new market segments and driving the need for advanced optical and protective technologies.
Leading Players in the Protective Eye Wear Market Market
- Bolle Safety
- Honeywell International Inc
- Pyramex Safety Products LLC
- Radians Inc
- MCR Safety
- uvex group
- 3M Company
- Phillips Safety Products In
- Gateway Safety Inc
- SSP Eyewear
Key Developments in Protective Eye Wear Market Industry
- October 2021: Uvex Group significantly bolstered its market presence and product portfolio with the launch of the Uvex i-range, a line of safety spectacles designed for superior comfort and protection, featuring advanced UV 400 protection against harmful ultraviolet radiation.
- October 2021: Demonstrating a strong commitment to environmental responsibility, Uvex Group introduced Uvex-Purefit, a line of 100% recyclable safety spectacles, aligning with the growing global demand for sustainable and eco-conscious products in the industrial safety sector.
- June 2021: MCR Safety launched the Memphis safety glass series, a product line engineered for exceptional performance, emphasizing superior anti-fog capabilities and robust UV protection, catering to users who prioritize advanced features for enhanced comfort, clarity, and safety in demanding conditions.
- Ongoing: A consistent trend across the industry is the development of lighter, more durable materials, enhanced lens coatings (e.g., anti-mist, scratch-resistant, impact-resistant), and the incorporation of advanced optical technologies for improved visibility and reduced eye strain in prolonged use scenarios.
Strategic Outlook for Protective Eye Wear Market Market
The Protective Eye Wear Market is on a trajectory of sustained and robust growth, propelled by a confluence of factors including relentless technological innovation, escalating global safety awareness, and the continuous expansion of applications across an ever-widening array of industries. Emerging markets, particularly in developing regions, coupled with the proactive development of cutting-edge product features, are poised to significantly influence market dynamics and unlock new growth avenues. Companies that strategically prioritize and integrate sustainability initiatives, alongside the incorporation of smart technological features into their product offerings, are expected to achieve a distinct competitive advantage and capture a larger market share. The overall outlook for the protective eyewear market remains decidedly positive, with substantial potential for both market expansion and groundbreaking innovation in the foreseeable future.
Protective Eye Wear Market Segmentation
-
1. Product Type
- 1.1. Spectacles
- 1.2. Welding Protection Glasses
- 1.3. Overspecs
- 1.4. Goggles
-
2. End-User Industry
- 2.1. Automotive
- 2.2. Construction
- 2.3. Food Industry
- 2.4. Pharmaceutical
- 2.5. Mining
- 2.6. Oil and Gas
- 2.7. Other End-User Industries
Protective Eye Wear Market Segmentation By Geography
-
1. North America
- 1.1. United States
- 1.2. Canada
- 1.3. Mexico
- 1.4. Rest of North America
-
2. Europe
- 2.1. Spain
- 2.2. United Kingdom
- 2.3. Germany
- 2.4. France
- 2.5. Italy
- 2.6. Russia
- 2.7. Rest of Europe
-
3. Asia Pacific
- 3.1. China
- 3.2. Japan
- 3.3. India
- 3.4. Australia
- 3.5. Rest of Asia Pacific
-
4. South America
- 4.1. Brazil
- 4.2. Argentina
- 4.3. Rest of South America
-
5. Middle East and Africa
- 5.1. South Africa
- 5.2. United Arab Emirates
- 5.3. Rest of Middle East and Africa
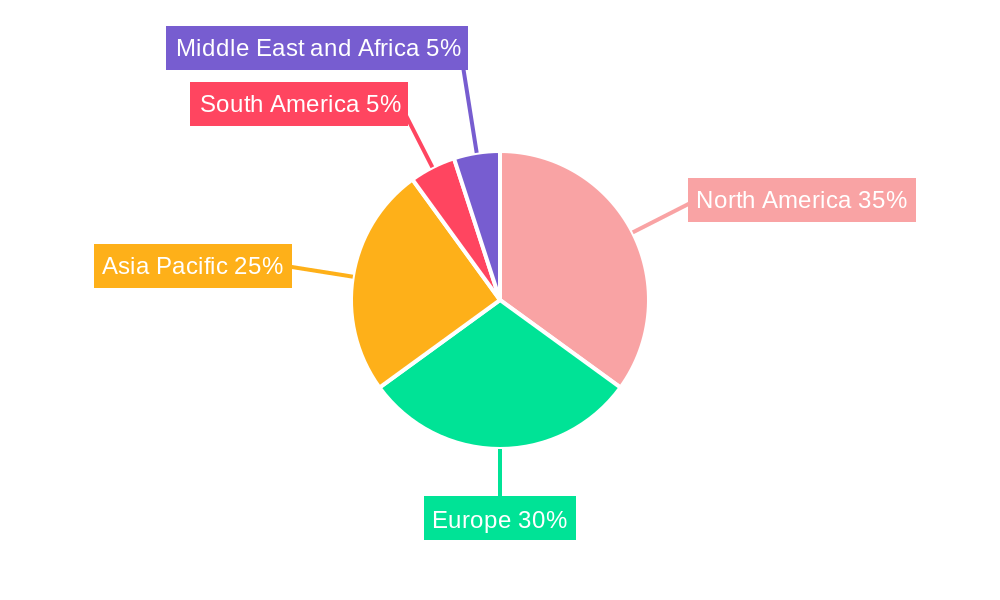
Protective Eye Wear Market Regional Market Share
Geographic Coverage of Protective Eye Wear Market
Protective Eye Wear Market REPORT HIGHLIGHTS
| Aspects | Details |
|---|---|
| Study Period | 2020-2034 |
| Base Year | 2025 |
| Estimated Year | 2026 |
| Forecast Period | 2026-2034 |
| Historical Period | 2020-2025 |
| Growth Rate | CAGR of 4.54% from 2020-2034 |
| Segmentation |
|
Table of Contents
- 1. Introduction
- 1.1. Research Scope
- 1.2. Market Segmentation
- 1.3. Research Objective
- 1.4. Definitions and Assumptions
- 2. Executive Summary
- 2.1. Market Snapshot
- 3. Market Dynamics
- 3.1. Market Drivers
- 3.2. Market Restrains
- 3.3. Market Trends
- 3.4. Market Opportunities
- 4. Market Factor Analysis
- 4.1. Porters Five Forces
- 4.1.1. Bargaining Power of Suppliers
- 4.1.2. Bargaining Power of Buyers
- 4.1.3. Threat of New Entrants
- 4.1.4. Threat of Substitutes
- 4.1.5. Competitive Rivalry
- 4.2. PESTEL analysis
- 4.3. BCG Analysis
- 4.3.1. Stars (High Growth, High Market Share)
- 4.3.2. Cash Cows (Low Growth, High Market Share)
- 4.3.3. Question Mark (High Growth, Low Market Share)
- 4.3.4. Dogs (Low Growth, Low Market Share)
- 4.4. Ansoff Matrix Analysis
- 4.5. Supply Chain Analysis
- 4.6. Regulatory Landscape
- 4.7. Current Market Potential and Opportunity Assessment (TAM–SAM–SOM Framework)
- 4.8. RAX Analyst Note
- 4.1. Porters Five Forces
- 5. Market Analysis, Insights and Forecast 2021-2033
- 5.1. Market Analysis, Insights and Forecast - by Product Type
- 5.1.1. Spectacles
- 5.1.2. Welding Protection Glasses
- 5.1.3. Overspecs
- 5.1.4. Goggles
- 5.2. Market Analysis, Insights and Forecast - by End-User Industry
- 5.2.1. Automotive
- 5.2.2. Construction
- 5.2.3. Food Industry
- 5.2.4. Pharmaceutical
- 5.2.5. Mining
- 5.2.6. Oil and Gas
- 5.2.7. Other End-User Industries
- 5.3. Market Analysis, Insights and Forecast - by Region
- 5.3.1. North America
- 5.3.2. Europe
- 5.3.3. Asia Pacific
- 5.3.4. South America
- 5.3.5. Middle East and Africa
- 5.1. Market Analysis, Insights and Forecast - by Product Type
- 6. Global Protective Eye Wear Market Analysis, Insights and Forecast, 2021-2033
- 6.1. Market Analysis, Insights and Forecast - by Product Type
- 6.1.1. Spectacles
- 6.1.2. Welding Protection Glasses
- 6.1.3. Overspecs
- 6.1.4. Goggles
- 6.2. Market Analysis, Insights and Forecast - by End-User Industry
- 6.2.1. Automotive
- 6.2.2. Construction
- 6.2.3. Food Industry
- 6.2.4. Pharmaceutical
- 6.2.5. Mining
- 6.2.6. Oil and Gas
- 6.2.7. Other End-User Industries
- 6.1. Market Analysis, Insights and Forecast - by Product Type
- 7. North America Protective Eye Wear Market Analysis, Insights and Forecast, 2020-2032
- 7.1. Market Analysis, Insights and Forecast - by Product Type
- 7.1.1. Spectacles
- 7.1.2. Welding Protection Glasses
- 7.1.3. Overspecs
- 7.1.4. Goggles
- 7.2. Market Analysis, Insights and Forecast - by End-User Industry
- 7.2.1. Automotive
- 7.2.2. Construction
- 7.2.3. Food Industry
- 7.2.4. Pharmaceutical
- 7.2.5. Mining
- 7.2.6. Oil and Gas
- 7.2.7. Other End-User Industries
- 7.1. Market Analysis, Insights and Forecast - by Product Type
- 8. Europe Protective Eye Wear Market Analysis, Insights and Forecast, 2020-2032
- 8.1. Market Analysis, Insights and Forecast - by Product Type
- 8.1.1. Spectacles
- 8.1.2. Welding Protection Glasses
- 8.1.3. Overspecs
- 8.1.4. Goggles
- 8.2. Market Analysis, Insights and Forecast - by End-User Industry
- 8.2.1. Automotive
- 8.2.2. Construction
- 8.2.3. Food Industry
- 8.2.4. Pharmaceutical
- 8.2.5. Mining
- 8.2.6. Oil and Gas
- 8.2.7. Other End-User Industries
- 8.1. Market Analysis, Insights and Forecast - by Product Type
- 9. Asia Pacific Protective Eye Wear Market Analysis, Insights and Forecast, 2020-2032
- 9.1. Market Analysis, Insights and Forecast - by Product Type
- 9.1.1. Spectacles
- 9.1.2. Welding Protection Glasses
- 9.1.3. Overspecs
- 9.1.4. Goggles
- 9.2. Market Analysis, Insights and Forecast - by End-User Industry
- 9.2.1. Automotive
- 9.2.2. Construction
- 9.2.3. Food Industry
- 9.2.4. Pharmaceutical
- 9.2.5. Mining
- 9.2.6. Oil and Gas
- 9.2.7. Other End-User Industries
- 9.1. Market Analysis, Insights and Forecast - by Product Type
- 10. South America Protective Eye Wear Market Analysis, Insights and Forecast, 2020-2032
- 10.1. Market Analysis, Insights and Forecast - by Product Type
- 10.1.1. Spectacles
- 10.1.2. Welding Protection Glasses
- 10.1.3. Overspecs
- 10.1.4. Goggles
- 10.2. Market Analysis, Insights and Forecast - by End-User Industry
- 10.2.1. Automotive
- 10.2.2. Construction
- 10.2.3. Food Industry
- 10.2.4. Pharmaceutical
- 10.2.5. Mining
- 10.2.6. Oil and Gas
- 10.2.7. Other End-User Industries
- 10.1. Market Analysis, Insights and Forecast - by Product Type
- 11. Middle East and Africa Protective Eye Wear Market Analysis, Insights and Forecast, 2020-2032
- 11.1. Market Analysis, Insights and Forecast - by Product Type
- 11.1.1. Spectacles
- 11.1.2. Welding Protection Glasses
- 11.1.3. Overspecs
- 11.1.4. Goggles
- 11.2. Market Analysis, Insights and Forecast - by End-User Industry
- 11.2.1. Automotive
- 11.2.2. Construction
- 11.2.3. Food Industry
- 11.2.4. Pharmaceutical
- 11.2.5. Mining
- 11.2.6. Oil and Gas
- 11.2.7. Other End-User Industries
- 11.1. Market Analysis, Insights and Forecast - by Product Type
- 12. Competitive Analysis
- 12.1. Company Profiles
- 12.1.1 Bolle Safety
- 12.1.1.1. Company Overview
- 12.1.1.2. Products
- 12.1.1.3. Company Financials
- 12.1.1.4. SWOT Analysis
- 12.1.2 Honeywell International Inc
- 12.1.2.1. Company Overview
- 12.1.2.2. Products
- 12.1.2.3. Company Financials
- 12.1.2.4. SWOT Analysis
- 12.1.3 Pyramex Safety Products LLC
- 12.1.3.1. Company Overview
- 12.1.3.2. Products
- 12.1.3.3. Company Financials
- 12.1.3.4. SWOT Analysis
- 12.1.4 Radians Inc
- 12.1.4.1. Company Overview
- 12.1.4.2. Products
- 12.1.4.3. Company Financials
- 12.1.4.4. SWOT Analysis
- 12.1.5 MCR Safety
- 12.1.5.1. Company Overview
- 12.1.5.2. Products
- 12.1.5.3. Company Financials
- 12.1.5.4. SWOT Analysis
- 12.1.6 uvex group
- 12.1.6.1. Company Overview
- 12.1.6.2. Products
- 12.1.6.3. Company Financials
- 12.1.6.4. SWOT Analysis
- 12.1.7 3M Company
- 12.1.7.1. Company Overview
- 12.1.7.2. Products
- 12.1.7.3. Company Financials
- 12.1.7.4. SWOT Analysis
- 12.1.8 Phillips Safety Products In
- 12.1.8.1. Company Overview
- 12.1.8.2. Products
- 12.1.8.3. Company Financials
- 12.1.8.4. SWOT Analysis
- 12.1.9 Gateway Safety Inc
- 12.1.9.1. Company Overview
- 12.1.9.2. Products
- 12.1.9.3. Company Financials
- 12.1.9.4. SWOT Analysis
- 12.1.10 SSP Eyewear
- 12.1.10.1. Company Overview
- 12.1.10.2. Products
- 12.1.10.3. Company Financials
- 12.1.10.4. SWOT Analysis
- 12.1.1 Bolle Safety
- 12.2. Market Entropy
- 12.2.1 Company's Key Areas Served
- 12.2.2 Recent Developments
- 12.3. Company Market Share Analysis 2025
- 12.3.1 Top 5 Companies Market Share Analysis
- 12.3.2 Top 3 Companies Market Share Analysis
- 12.4. List of Potential Customers
- 13. Research Methodology
List of Figures
- Figure 1: Global Protective Eye Wear Market Revenue Breakdown (billion, %) by Region 2025 & 2033
- Figure 2: Global Protective Eye Wear Market Volume Breakdown (K Units, %) by Region 2025 & 2033
- Figure 3: North America Protective Eye Wear Market Revenue (billion), by Product Type 2025 & 2033
- Figure 4: North America Protective Eye Wear Market Volume (K Units), by Product Type 2025 & 2033
- Figure 5: North America Protective Eye Wear Market Revenue Share (%), by Product Type 2025 & 2033
- Figure 6: North America Protective Eye Wear Market Volume Share (%), by Product Type 2025 & 2033
- Figure 7: North America Protective Eye Wear Market Revenue (billion), by End-User Industry 2025 & 2033
- Figure 8: North America Protective Eye Wear Market Volume (K Units), by End-User Industry 2025 & 2033
- Figure 9: North America Protective Eye Wear Market Revenue Share (%), by End-User Industry 2025 & 2033
- Figure 10: North America Protective Eye Wear Market Volume Share (%), by End-User Industry 2025 & 2033
- Figure 11: North America Protective Eye Wear Market Revenue (billion), by Country 2025 & 2033
- Figure 12: North America Protective Eye Wear Market Volume (K Units), by Country 2025 & 2033
- Figure 13: North America Protective Eye Wear Market Revenue Share (%), by Country 2025 & 2033
- Figure 14: North America Protective Eye Wear Market Volume Share (%), by Country 2025 & 2033
- Figure 15: Europe Protective Eye Wear Market Revenue (billion), by Product Type 2025 & 2033
- Figure 16: Europe Protective Eye Wear Market Volume (K Units), by Product Type 2025 & 2033
- Figure 17: Europe Protective Eye Wear Market Revenue Share (%), by Product Type 2025 & 2033
- Figure 18: Europe Protective Eye Wear Market Volume Share (%), by Product Type 2025 & 2033
- Figure 19: Europe Protective Eye Wear Market Revenue (billion), by End-User Industry 2025 & 2033
- Figure 20: Europe Protective Eye Wear Market Volume (K Units), by End-User Industry 2025 & 2033
- Figure 21: Europe Protective Eye Wear Market Revenue Share (%), by End-User Industry 2025 & 2033
- Figure 22: Europe Protective Eye Wear Market Volume Share (%), by End-User Industry 2025 & 2033
- Figure 23: Europe Protective Eye Wear Market Revenue (billion), by Country 2025 & 2033
- Figure 24: Europe Protective Eye Wear Market Volume (K Units), by Country 2025 & 2033
- Figure 25: Europe Protective Eye Wear Market Revenue Share (%), by Country 2025 & 2033
- Figure 26: Europe Protective Eye Wear Market Volume Share (%), by Country 2025 & 2033
- Figure 27: Asia Pacific Protective Eye Wear Market Revenue (billion), by Product Type 2025 & 2033
- Figure 28: Asia Pacific Protective Eye Wear Market Volume (K Units), by Product Type 2025 & 2033
- Figure 29: Asia Pacific Protective Eye Wear Market Revenue Share (%), by Product Type 2025 & 2033
- Figure 30: Asia Pacific Protective Eye Wear Market Volume Share (%), by Product Type 2025 & 2033
- Figure 31: Asia Pacific Protective Eye Wear Market Revenue (billion), by End-User Industry 2025 & 2033
- Figure 32: Asia Pacific Protective Eye Wear Market Volume (K Units), by End-User Industry 2025 & 2033
- Figure 33: Asia Pacific Protective Eye Wear Market Revenue Share (%), by End-User Industry 2025 & 2033
- Figure 34: Asia Pacific Protective Eye Wear Market Volume Share (%), by End-User Industry 2025 & 2033
- Figure 35: Asia Pacific Protective Eye Wear Market Revenue (billion), by Country 2025 & 2033
- Figure 36: Asia Pacific Protective Eye Wear Market Volume (K Units), by Country 2025 & 2033
- Figure 37: Asia Pacific Protective Eye Wear Market Revenue Share (%), by Country 2025 & 2033
- Figure 38: Asia Pacific Protective Eye Wear Market Volume Share (%), by Country 2025 & 2033
- Figure 39: South America Protective Eye Wear Market Revenue (billion), by Product Type 2025 & 2033
- Figure 40: South America Protective Eye Wear Market Volume (K Units), by Product Type 2025 & 2033
- Figure 41: South America Protective Eye Wear Market Revenue Share (%), by Product Type 2025 & 2033
- Figure 42: South America Protective Eye Wear Market Volume Share (%), by Product Type 2025 & 2033
- Figure 43: South America Protective Eye Wear Market Revenue (billion), by End-User Industry 2025 & 2033
- Figure 44: South America Protective Eye Wear Market Volume (K Units), by End-User Industry 2025 & 2033
- Figure 45: South America Protective Eye Wear Market Revenue Share (%), by End-User Industry 2025 & 2033
- Figure 46: South America Protective Eye Wear Market Volume Share (%), by End-User Industry 2025 & 2033
- Figure 47: South America Protective Eye Wear Market Revenue (billion), by Country 2025 & 2033
- Figure 48: South America Protective Eye Wear Market Volume (K Units), by Country 2025 & 2033
- Figure 49: South America Protective Eye Wear Market Revenue Share (%), by Country 2025 & 2033
- Figure 50: South America Protective Eye Wear Market Volume Share (%), by Country 2025 & 2033
- Figure 51: Middle East and Africa Protective Eye Wear Market Revenue (billion), by Product Type 2025 & 2033
- Figure 52: Middle East and Africa Protective Eye Wear Market Volume (K Units), by Product Type 2025 & 2033
- Figure 53: Middle East and Africa Protective Eye Wear Market Revenue Share (%), by Product Type 2025 & 2033
- Figure 54: Middle East and Africa Protective Eye Wear Market Volume Share (%), by Product Type 2025 & 2033
- Figure 55: Middle East and Africa Protective Eye Wear Market Revenue (billion), by End-User Industry 2025 & 2033
- Figure 56: Middle East and Africa Protective Eye Wear Market Volume (K Units), by End-User Industry 2025 & 2033
- Figure 57: Middle East and Africa Protective Eye Wear Market Revenue Share (%), by End-User Industry 2025 & 2033
- Figure 58: Middle East and Africa Protective Eye Wear Market Volume Share (%), by End-User Industry 2025 & 2033
- Figure 59: Middle East and Africa Protective Eye Wear Market Revenue (billion), by Country 2025 & 2033
- Figure 60: Middle East and Africa Protective Eye Wear Market Volume (K Units), by Country 2025 & 2033
- Figure 61: Middle East and Africa Protective Eye Wear Market Revenue Share (%), by Country 2025 & 2033
- Figure 62: Middle East and Africa Protective Eye Wear Market Volume Share (%), by Country 2025 & 2033
List of Tables
- Table 1: Global Protective Eye Wear Market Revenue billion Forecast, by Product Type 2020 & 2033
- Table 2: Global Protective Eye Wear Market Volume K Units Forecast, by Product Type 2020 & 2033
- Table 3: Global Protective Eye Wear Market Revenue billion Forecast, by End-User Industry 2020 & 2033
- Table 4: Global Protective Eye Wear Market Volume K Units Forecast, by End-User Industry 2020 & 2033
- Table 5: Global Protective Eye Wear Market Revenue billion Forecast, by Region 2020 & 2033
- Table 6: Global Protective Eye Wear Market Volume K Units Forecast, by Region 2020 & 2033
- Table 7: Global Protective Eye Wear Market Revenue billion Forecast, by Product Type 2020 & 2033
- Table 8: Global Protective Eye Wear Market Volume K Units Forecast, by Product Type 2020 & 2033
- Table 9: Global Protective Eye Wear Market Revenue billion Forecast, by End-User Industry 2020 & 2033
- Table 10: Global Protective Eye Wear Market Volume K Units Forecast, by End-User Industry 2020 & 2033
- Table 11: Global Protective Eye Wear Market Revenue billion Forecast, by Country 2020 & 2033
- Table 12: Global Protective Eye Wear Market Volume K Units Forecast, by Country 2020 & 2033
- Table 13: United States Protective Eye Wear Market Revenue (billion) Forecast, by Application 2020 & 2033
- Table 14: United States Protective Eye Wear Market Volume (K Units) Forecast, by Application 2020 & 2033
- Table 15: Canada Protective Eye Wear Market Revenue (billion) Forecast, by Application 2020 & 2033
- Table 16: Canada Protective Eye Wear Market Volume (K Units) Forecast, by Application 2020 & 2033
- Table 17: Mexico Protective Eye Wear Market Revenue (billion) Forecast, by Application 2020 & 2033
- Table 18: Mexico Protective Eye Wear Market Volume (K Units) Forecast, by Application 2020 & 2033
- Table 19: Rest of North America Protective Eye Wear Market Revenue (billion) Forecast, by Application 2020 & 2033
- Table 20: Rest of North America Protective Eye Wear Market Volume (K Units) Forecast, by Application 2020 & 2033
- Table 21: Global Protective Eye Wear Market Revenue billion Forecast, by Product Type 2020 & 2033
- Table 22: Global Protective Eye Wear Market Volume K Units Forecast, by Product Type 2020 & 2033
- Table 23: Global Protective Eye Wear Market Revenue billion Forecast, by End-User Industry 2020 & 2033
- Table 24: Global Protective Eye Wear Market Volume K Units Forecast, by End-User Industry 2020 & 2033
- Table 25: Global Protective Eye Wear Market Revenue billion Forecast, by Country 2020 & 2033
- Table 26: Global Protective Eye Wear Market Volume K Units Forecast, by Country 2020 & 2033
- Table 27: Spain Protective Eye Wear Market Revenue (billion) Forecast, by Application 2020 & 2033
- Table 28: Spain Protective Eye Wear Market Volume (K Units) Forecast, by Application 2020 & 2033
- Table 29: United Kingdom Protective Eye Wear Market Revenue (billion) Forecast, by Application 2020 & 2033
- Table 30: United Kingdom Protective Eye Wear Market Volume (K Units) Forecast, by Application 2020 & 2033
- Table 31: Germany Protective Eye Wear Market Revenue (billion) Forecast, by Application 2020 & 2033
- Table 32: Germany Protective Eye Wear Market Volume (K Units) Forecast, by Application 2020 & 2033
- Table 33: France Protective Eye Wear Market Revenue (billion) Forecast, by Application 2020 & 2033
- Table 34: France Protective Eye Wear Market Volume (K Units) Forecast, by Application 2020 & 2033
- Table 35: Italy Protective Eye Wear Market Revenue (billion) Forecast, by Application 2020 & 2033
- Table 36: Italy Protective Eye Wear Market Volume (K Units) Forecast, by Application 2020 & 2033
- Table 37: Russia Protective Eye Wear Market Revenue (billion) Forecast, by Application 2020 & 2033
- Table 38: Russia Protective Eye Wear Market Volume (K Units) Forecast, by Application 2020 & 2033
- Table 39: Rest of Europe Protective Eye Wear Market Revenue (billion) Forecast, by Application 2020 & 2033
- Table 40: Rest of Europe Protective Eye Wear Market Volume (K Units) Forecast, by Application 2020 & 2033
- Table 41: Global Protective Eye Wear Market Revenue billion Forecast, by Product Type 2020 & 2033
- Table 42: Global Protective Eye Wear Market Volume K Units Forecast, by Product Type 2020 & 2033
- Table 43: Global Protective Eye Wear Market Revenue billion Forecast, by End-User Industry 2020 & 2033
- Table 44: Global Protective Eye Wear Market Volume K Units Forecast, by End-User Industry 2020 & 2033
- Table 45: Global Protective Eye Wear Market Revenue billion Forecast, by Country 2020 & 2033
- Table 46: Global Protective Eye Wear Market Volume K Units Forecast, by Country 2020 & 2033
- Table 47: China Protective Eye Wear Market Revenue (billion) Forecast, by Application 2020 & 2033
- Table 48: China Protective Eye Wear Market Volume (K Units) Forecast, by Application 2020 & 2033
- Table 49: Japan Protective Eye Wear Market Revenue (billion) Forecast, by Application 2020 & 2033
- Table 50: Japan Protective Eye Wear Market Volume (K Units) Forecast, by Application 2020 & 2033
- Table 51: India Protective Eye Wear Market Revenue (billion) Forecast, by Application 2020 & 2033
- Table 52: India Protective Eye Wear Market Volume (K Units) Forecast, by Application 2020 & 2033
- Table 53: Australia Protective Eye Wear Market Revenue (billion) Forecast, by Application 2020 & 2033
- Table 54: Australia Protective Eye Wear Market Volume (K Units) Forecast, by Application 2020 & 2033
- Table 55: Rest of Asia Pacific Protective Eye Wear Market Revenue (billion) Forecast, by Application 2020 & 2033
- Table 56: Rest of Asia Pacific Protective Eye Wear Market Volume (K Units) Forecast, by Application 2020 & 2033
- Table 57: Global Protective Eye Wear Market Revenue billion Forecast, by Product Type 2020 & 2033
- Table 58: Global Protective Eye Wear Market Volume K Units Forecast, by Product Type 2020 & 2033
- Table 59: Global Protective Eye Wear Market Revenue billion Forecast, by End-User Industry 2020 & 2033
- Table 60: Global Protective Eye Wear Market Volume K Units Forecast, by End-User Industry 2020 & 2033
- Table 61: Global Protective Eye Wear Market Revenue billion Forecast, by Country 2020 & 2033
- Table 62: Global Protective Eye Wear Market Volume K Units Forecast, by Country 2020 & 2033
- Table 63: Brazil Protective Eye Wear Market Revenue (billion) Forecast, by Application 2020 & 2033
- Table 64: Brazil Protective Eye Wear Market Volume (K Units) Forecast, by Application 2020 & 2033
- Table 65: Argentina Protective Eye Wear Market Revenue (billion) Forecast, by Application 2020 & 2033
- Table 66: Argentina Protective Eye Wear Market Volume (K Units) Forecast, by Application 2020 & 2033
- Table 67: Rest of South America Protective Eye Wear Market Revenue (billion) Forecast, by Application 2020 & 2033
- Table 68: Rest of South America Protective Eye Wear Market Volume (K Units) Forecast, by Application 2020 & 2033
- Table 69: Global Protective Eye Wear Market Revenue billion Forecast, by Product Type 2020 & 2033
- Table 70: Global Protective Eye Wear Market Volume K Units Forecast, by Product Type 2020 & 2033
- Table 71: Global Protective Eye Wear Market Revenue billion Forecast, by End-User Industry 2020 & 2033
- Table 72: Global Protective Eye Wear Market Volume K Units Forecast, by End-User Industry 2020 & 2033
- Table 73: Global Protective Eye Wear Market Revenue billion Forecast, by Country 2020 & 2033
- Table 74: Global Protective Eye Wear Market Volume K Units Forecast, by Country 2020 & 2033
- Table 75: South Africa Protective Eye Wear Market Revenue (billion) Forecast, by Application 2020 & 2033
- Table 76: South Africa Protective Eye Wear Market Volume (K Units) Forecast, by Application 2020 & 2033
- Table 77: United Arab Emirates Protective Eye Wear Market Revenue (billion) Forecast, by Application 2020 & 2033
- Table 78: United Arab Emirates Protective Eye Wear Market Volume (K Units) Forecast, by Application 2020 & 2033
- Table 79: Rest of Middle East and Africa Protective Eye Wear Market Revenue (billion) Forecast, by Application 2020 & 2033
- Table 80: Rest of Middle East and Africa Protective Eye Wear Market Volume (K Units) Forecast, by Application 2020 & 2033
Frequently Asked Questions
1. What is the projected Compound Annual Growth Rate (CAGR) of the Protective Eye Wear Market?
The projected CAGR is approximately 4.54%.
2. Which companies are prominent players in the Protective Eye Wear Market?
Key companies in the market include Bolle Safety, Honeywell International Inc, Pyramex Safety Products LLC, Radians Inc, MCR Safety, uvex group, 3M Company, Phillips Safety Products In, Gateway Safety Inc, SSP Eyewear.
3. What are the main segments of the Protective Eye Wear Market?
The market segments include Product Type, End-User Industry.
4. Can you provide details about the market size?
The market size is estimated to be USD 4.38 billion as of 2022.
5. What are some drivers contributing to market growth?
Shift in Shopping Mode Preferences of the people; Increasing Urbanization; Growing Disposable Income.
6. What are the notable trends driving market growth?
Increasing Prevalence of Eye Injuries at Workplace.
7. Are there any restraints impacting market growth?
High-priced products and additional delivery charges; Inconsistency in product quality.
8. Can you provide examples of recent developments in the market?
October 2021: Uvex Group launched the Uvex i-range, an innovative safety eyewear for multiple applications. The products comprise 3 different varieties uvex i-lite, uvex i-guard, and uvex i-guard plus. The products are coated with UV 400 protection.
9. What pricing options are available for accessing the report?
Pricing options include single-user, multi-user, and enterprise licenses priced at USD 4750, USD 5250, and USD 8750 respectively.
10. Is the market size provided in terms of value or volume?
The market size is provided in terms of value, measured in billion and volume, measured in K Units.
11. Are there any specific market keywords associated with the report?
Yes, the market keyword associated with the report is "Protective Eye Wear Market," which aids in identifying and referencing the specific market segment covered.
12. How do I determine which pricing option suits my needs best?
The pricing options vary based on user requirements and access needs. Individual users may opt for single-user licenses, while businesses requiring broader access may choose multi-user or enterprise licenses for cost-effective access to the report.
13. Are there any additional resources or data provided in the Protective Eye Wear Market report?
While the report offers comprehensive insights, it's advisable to review the specific contents or supplementary materials provided to ascertain if additional resources or data are available.
14. How can I stay updated on further developments or reports in the Protective Eye Wear Market?
To stay informed about further developments, trends, and reports in the Protective Eye Wear Market, consider subscribing to industry newsletters, following relevant companies and organizations, or regularly checking reputable industry news sources and publications.
Methodology
Step 1 - Identification of Relevant Samples Size from Population Database


Step 2 - Approaches for Defining Global Market Size (Value, Volume* & Price*)

Note*: In applicable scenarios
Step 3 - Data Sources
Primary Research
- Web Analytics
- Survey Reports
- Research Institute
- Latest Research Reports
- Opinion Leaders
Secondary Research
- Annual Reports
- White Paper
- Latest Press Release
- Industry Association
- Paid Database
- Investor Presentations

Step 4 - Data Triangulation
Involves using different sources of information in order to increase the validity of a study
These sources are likely to be stakeholders in a program - participants, other researchers, program staff, other community members, and so on.
Then we put all data in single framework & apply various statistical tools to find out the dynamic on the market.
During the analysis stage, feedback from the stakeholder groups would be compared to determine areas of agreement as well as areas of divergence