
Key Insights
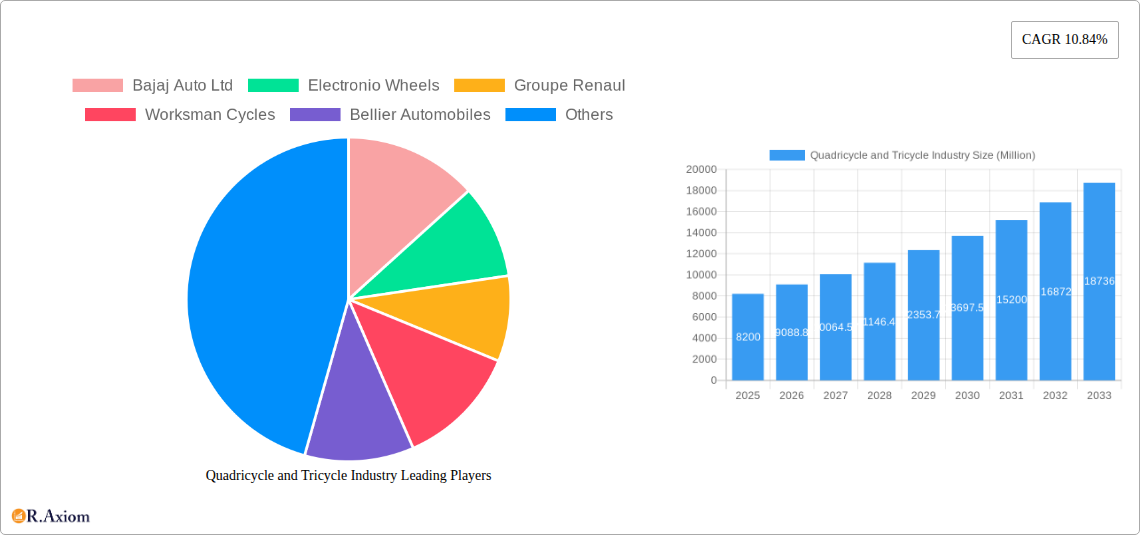
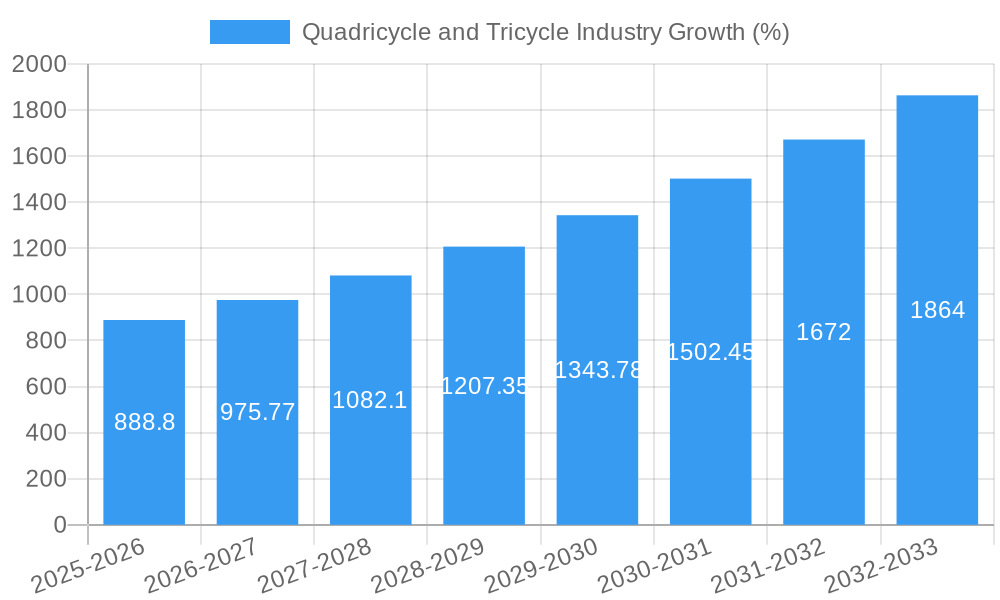
The global quadricycle and tricycle market, valued at $8.20 billion in 2025, is projected to experience robust growth, driven by increasing urbanization, rising fuel prices, and the growing preference for affordable and fuel-efficient personal transportation. The market's Compound Annual Growth Rate (CAGR) of 10.84% from 2025 to 2033 signifies significant expansion opportunities. Several factors contribute to this growth. The escalating demand for last-mile delivery solutions fuels the commercial segment's expansion, particularly within urban areas where maneuverability and affordability are crucial. Electric quadricycles and tricycles are gaining traction due to environmental concerns and government incentives promoting sustainable transportation. Technological advancements, such as improved battery technology and enhanced safety features, are also driving market growth. However, challenges remain, including stringent emission norms and regulations in certain regions, which could potentially restrain market expansion in the short-term. Furthermore, the development of robust charging infrastructure for electric models is critical to sustain long-term growth, particularly in developing countries. The market segmentation reveals significant opportunities within the personal segment, particularly in emerging markets, where quadricycles and tricycles serve as primary modes of transportation. The electric power source segment is projected to capture a significant market share due to environmental consciousness and cost benefits associated with lower operating expenses.
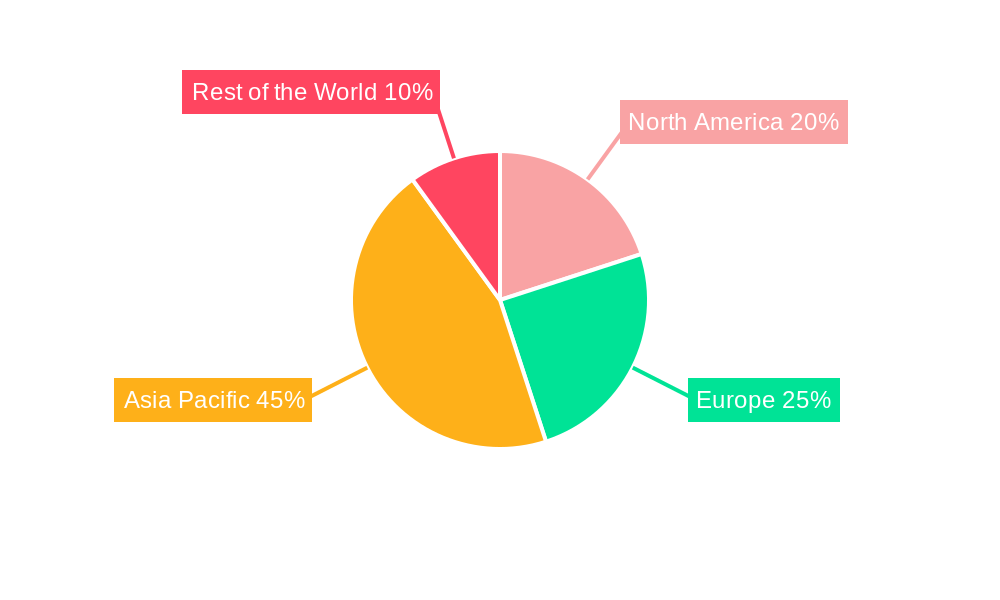
The geographical distribution of the market demonstrates strong growth across Asia Pacific, driven by high population density and increasing disposable incomes. North America and Europe are also expected to witness significant growth, albeit at a slower pace compared to Asia Pacific. Key players in the market, including Bajaj Auto Ltd, Mahindra and Mahindra, and Groupe Renault, are investing heavily in research and development to enhance product offerings and expand their market presence. Strategic partnerships and collaborations are also prevalent, focusing on technology integration and market penetration. Despite the challenges, the long-term prospects for the quadricycle and tricycle market remain exceptionally positive, with ongoing innovations and evolving consumer preferences pushing market boundaries. The continued focus on affordability, sustainability, and improved safety features will shape the industry's trajectory in the coming years.
Quadricycle and Tricycle Industry Market Report: 2019-2033
This comprehensive report provides an in-depth analysis of the global Quadricycle and Tricycle industry, offering valuable insights for stakeholders, investors, and industry professionals. Covering the period from 2019 to 2033, with a focus on 2025 as the base and estimated year, this report meticulously examines market trends, competitive dynamics, and future growth prospects. The study segments the market by application type (personal and commercial), vehicle type (quadricycle and tricycle), and power source (electric, gasoline, and solar). The report projects a xx Million market value by 2033, with a CAGR of xx% during the forecast period (2025-2033).
Quadricycle and Tricycle Industry Market Concentration & Innovation
The global quadricycle and tricycle market exhibits a moderately concentrated landscape, with a few major players holding significant market share. Bajaj Auto Ltd. and Mahindra and Mahindra are prominent examples, commanding a combined xx% market share in 2025, estimated based on revenue. However, the market is also witnessing increased participation from smaller, specialized manufacturers such as Electronio Wheels and Estrima SRL, focusing on niche segments like electric quadricycles.
Innovation in this sector is driven by the increasing demand for affordable and fuel-efficient personal and commercial transportation. Key innovations include advancements in electric motor technology, improved battery life and charging infrastructure, lightweight materials, and enhanced safety features. Regulatory frameworks, particularly concerning emission standards and safety regulations, significantly influence innovation and product development. Substitute products, such as motorcycles and small cars, pose competitive pressure, forcing manufacturers to differentiate through cost-effectiveness, ease of use, and specialized functionalities. The rising preference for eco-friendly transportation fuels the adoption of electric models, pushing innovation in battery technology and charging solutions. M&A activity in the last five years has been relatively moderate, with a total estimated deal value of xx Million. Notable acquisitions included (example: acquisition of X company by Y company for xx Million in 2022).
Quadricycle and Tricycle Industry Industry Trends & Insights
The global quadricycle and tricycle market is experiencing robust growth, propelled by several key factors. Rising urbanization in developing economies significantly increases the demand for affordable and efficient last-mile connectivity solutions. Government initiatives promoting sustainable transportation further boost the adoption of electric models, reducing carbon emissions and improving air quality. Consumer preferences are shifting towards smaller, more maneuverable vehicles, particularly in congested urban areas. The increasing affordability of electric quadricycles and tricycles, coupled with declining battery costs, is also driving market expansion. Competitive dynamics are characterized by price competition, technological differentiation, and brand building. The market is witnessing the entry of new players, particularly in the electric vehicle segment, intensifying competition. The overall market growth is projected at a CAGR of xx% during the forecast period (2025-2033), with market penetration steadily increasing in emerging markets. Technological disruptions, particularly in battery technology and charging infrastructure, will significantly shape future market dynamics.
Dominant Markets & Segments in Quadricycle and Tricycle Industry
- Leading Region: Asia-Pacific dominates the quadricycle and tricycle market, driven by high population density, rapid urbanization, and rising disposable incomes in countries like India and Indonesia.
- Leading Country: India emerges as the leading national market due to its vast population, significant demand for affordable transportation, and supportive government policies.
- Leading Segment (Application Type): The commercial segment holds a larger market share compared to the personal segment, driven by the extensive use of tricycles and quadricycles in logistics, delivery services, and other commercial applications.
- Leading Segment (Vehicle Type): Tricycles dominate the market due to their lower cost and better maneuverability in congested urban areas, especially in developing countries.
- Leading Segment (Power Source Type): While gasoline-powered vehicles currently hold a larger market share, the electric segment is experiencing rapid growth, fueled by government incentives, declining battery prices, and increasing environmental awareness. Key drivers in these dominant markets include favorable economic policies, developing infrastructure for electric vehicle charging, and robust government support for last-mile connectivity solutions. The dominance of the Asia-Pacific region is firmly entrenched due to large-scale manufacturing capabilities and a huge consumer base. The Indian market's dominance is reinforced by the government's focus on affordable transportation solutions.
Quadricycle and Tricycle Industry Product Developments
Recent years have witnessed significant product innovations, particularly in the electric segment. Manufacturers are focusing on improved battery technology, extended range, enhanced safety features, and more stylish designs. Key applications are expanding beyond personal transportation to encompass logistics, delivery services, and tourism. The competitive advantage lies in providing cost-effective, reliable, and environmentally friendly vehicles tailored to specific market needs. Technological advancements in battery technology, motor efficiency, and lightweight materials are driving product improvements, enhancing overall performance and appeal.
Report Scope & Segmentation Analysis
By Application Type: The report analyzes the personal and commercial segments, projecting significant growth in both, with the commercial segment exhibiting a slightly higher CAGR due to increased demand in logistics and delivery services. Competitive intensity is high in both segments.
By Vehicle Type: The report covers quadricycles and tricycles separately, with detailed analysis of market size, growth projections, and competitive dynamics for each type. Tricycles are projected to maintain a larger market share due to cost-effectiveness.
By Power Source Type: The report provides a comprehensive analysis of electric, gasoline, and solar-powered vehicles, highlighting the rapid growth of the electric segment driven by environmental concerns and government incentives. Gasoline-powered vehicles are expected to maintain a significant share, particularly in regions with limited electric charging infrastructure.
Key Drivers of Quadricycle and Tricycle Industry Growth
The quadricycle and tricycle industry is fueled by several key drivers:
- Rising urbanization: Increased population density in urban areas creates a high demand for affordable, efficient transportation.
- Government initiatives: Policies promoting sustainable transportation and last-mile connectivity significantly boost market growth.
- Technological advancements: Innovations in electric motor technology, battery life, and charging infrastructure improve vehicle performance and reduce costs.
- Cost-effectiveness: Quadricycles and tricycles offer a significantly cheaper alternative to cars and motorcycles.
Challenges in the Quadricycle and Tricycle Industry Sector
Several challenges hinder industry growth:
- Stringent safety regulations: Meeting stringent safety standards can increase production costs and limit market penetration.
- Supply chain disruptions: Global supply chain issues can impact the availability of components and increase production costs.
- Intense competition: The market faces increasing competition from established and new entrants, leading to price wars and reduced profit margins. This competition is estimated to negatively impact profit margins by an average of xx% in the next 5 years.
Emerging Opportunities in Quadricycle and Tricycle Industry
Emerging opportunities include:
- Expansion into new markets: Untapped markets in Africa and South America present significant growth potential.
- Technological advancements: Innovations in battery technology, autonomous driving features, and connectivity offer new opportunities for differentiation and market expansion.
- Specialized applications: The development of customized quadricycles and tricycles for specific tasks, such as cargo delivery and tourism, presents significant growth prospects.
Leading Players in the Quadricycle and Tricycle Industry Market
- Bajaj Auto Ltd
- Electronio Wheels
- Groupe Renault
- Worksman Cycles
- Bellier Automobiles
- Mahindra and Mahindra
- Light Foot Cycle
- Automobiles CHATENET
- Estrima SRL
- Daimus
- Ligier Group
- Aixam-Mega
Key Developments in Quadricycle and Tricycle Industry Industry
- January 2023: Bajaj Auto Ltd. launched a new electric quadricycle model with enhanced battery technology.
- June 2022: Mahindra and Mahindra announced a strategic partnership to expand its electric quadricycle production capacity.
- October 2021: Groupe Renault invested in a startup developing innovative battery technology for quadricycles. (Further specific developments with dates and impact require access to industry-specific news sources and databases, which are not available to me.)
Strategic Outlook for Quadricycle and Tricycle Industry Market
The future of the quadricycle and tricycle market looks promising. Continued technological advancements, supportive government policies, and rising demand in developing economies will drive significant growth. The focus on electric vehicles will continue to intensify, leading to innovation in battery technology and charging infrastructure. New market entries and strategic partnerships will reshape the competitive landscape. The market is poised for sustained expansion, particularly in emerging markets and niche applications, creating valuable opportunities for industry players.
Quadricycle and Tricycle Industry Segmentation
-
1. Power Source Type
- 1.1. Electric
- 1.2. Gasoline
- 1.3. Solar
-
2. Application Type
- 2.1. Personal
- 2.2. Commercial
-
3. Vehicle Type
- 3.1. Quadricycle
- 3.2. Tricycle
Quadricycle and Tricycle Industry Segmentation By Geography
-
1. North America
- 1.1. United States
- 1.2. Canada
- 1.3. Rest of North America
-
2. Europe
- 2.1. Germany
- 2.2. United Kingdom
- 2.3. France
- 2.4. Italy
- 2.5. Rest of Europe
-
3. Asia Pacific
- 3.1. China
- 3.2. Japan
- 3.3. India
- 3.4. South Korea
- 3.5. Rest of Asia Pacific
-
4. Rest of the World
- 4.1. Brazil
- 4.2. South Africa
- 4.3. United Arab Emirates
- 4.4. Other Countries
Quadricycle and Tricycle Industry REPORT HIGHLIGHTS
| Aspects | Details |
|---|---|
| Study Period | 2019-2033 |
| Base Year | 2024 |
| Estimated Year | 2025 |
| Forecast Period | 2025-2033 |
| Historical Period | 2019-2024 |
| Growth Rate | CAGR of 10.84% from 2019-2033 |
| Segmentation |
|
Table of Contents
- 1. Introduction
- 1.1. Research Scope
- 1.2. Market Segmentation
- 1.3. Research Methodology
- 1.4. Definitions and Assumptions
- 2. Executive Summary
- 2.1. Introduction
- 3. Market Dynamics
- 3.1. Introduction
- 3.2. Market Drivers
- 3.2.1. Integration With Telematics And Fleet Management Systems; Others
- 3.3. Market Restrains
- 3.3.1. The Initial Costs Associated With Purchasing And Installing ELD Systems is High; Others
- 3.4. Market Trends
- 3.4.1. Growing Adoption of Quadricycles Expected to Enhance Demand in the Market
- 4. Market Factor Analysis
- 4.1. Porters Five Forces
- 4.2. Supply/Value Chain
- 4.3. PESTEL analysis
- 4.4. Market Entropy
- 4.5. Patent/Trademark Analysis
- 5. Global Quadricycle and Tricycle Industry Analysis, Insights and Forecast, 2019-2031
- 5.1. Market Analysis, Insights and Forecast - by Power Source Type
- 5.1.1. Electric
- 5.1.2. Gasoline
- 5.1.3. Solar
- 5.2. Market Analysis, Insights and Forecast - by Application Type
- 5.2.1. Personal
- 5.2.2. Commercial
- 5.3. Market Analysis, Insights and Forecast - by Vehicle Type
- 5.3.1. Quadricycle
- 5.3.2. Tricycle
- 5.4. Market Analysis, Insights and Forecast - by Region
- 5.4.1. North America
- 5.4.2. Europe
- 5.4.3. Asia Pacific
- 5.4.4. Rest of the World
- 5.1. Market Analysis, Insights and Forecast - by Power Source Type
- 6. North America Quadricycle and Tricycle Industry Analysis, Insights and Forecast, 2019-2031
- 6.1. Market Analysis, Insights and Forecast - by Power Source Type
- 6.1.1. Electric
- 6.1.2. Gasoline
- 6.1.3. Solar
- 6.2. Market Analysis, Insights and Forecast - by Application Type
- 6.2.1. Personal
- 6.2.2. Commercial
- 6.3. Market Analysis, Insights and Forecast - by Vehicle Type
- 6.3.1. Quadricycle
- 6.3.2. Tricycle
- 6.1. Market Analysis, Insights and Forecast - by Power Source Type
- 7. Europe Quadricycle and Tricycle Industry Analysis, Insights and Forecast, 2019-2031
- 7.1. Market Analysis, Insights and Forecast - by Power Source Type
- 7.1.1. Electric
- 7.1.2. Gasoline
- 7.1.3. Solar
- 7.2. Market Analysis, Insights and Forecast - by Application Type
- 7.2.1. Personal
- 7.2.2. Commercial
- 7.3. Market Analysis, Insights and Forecast - by Vehicle Type
- 7.3.1. Quadricycle
- 7.3.2. Tricycle
- 7.1. Market Analysis, Insights and Forecast - by Power Source Type
- 8. Asia Pacific Quadricycle and Tricycle Industry Analysis, Insights and Forecast, 2019-2031
- 8.1. Market Analysis, Insights and Forecast - by Power Source Type
- 8.1.1. Electric
- 8.1.2. Gasoline
- 8.1.3. Solar
- 8.2. Market Analysis, Insights and Forecast - by Application Type
- 8.2.1. Personal
- 8.2.2. Commercial
- 8.3. Market Analysis, Insights and Forecast - by Vehicle Type
- 8.3.1. Quadricycle
- 8.3.2. Tricycle
- 8.1. Market Analysis, Insights and Forecast - by Power Source Type
- 9. Rest of the World Quadricycle and Tricycle Industry Analysis, Insights and Forecast, 2019-2031
- 9.1. Market Analysis, Insights and Forecast - by Power Source Type
- 9.1.1. Electric
- 9.1.2. Gasoline
- 9.1.3. Solar
- 9.2. Market Analysis, Insights and Forecast - by Application Type
- 9.2.1. Personal
- 9.2.2. Commercial
- 9.3. Market Analysis, Insights and Forecast - by Vehicle Type
- 9.3.1. Quadricycle
- 9.3.2. Tricycle
- 9.1. Market Analysis, Insights and Forecast - by Power Source Type
- 10. North America Quadricycle and Tricycle Industry Analysis, Insights and Forecast, 2019-2031
- 10.1. Market Analysis, Insights and Forecast - By Country/Sub-region
- 10.1.1 United States
- 10.1.2 Canada
- 10.1.3 Rest of North America
- 11. Europe Quadricycle and Tricycle Industry Analysis, Insights and Forecast, 2019-2031
- 11.1. Market Analysis, Insights and Forecast - By Country/Sub-region
- 11.1.1 Germany
- 11.1.2 United Kingdom
- 11.1.3 France
- 11.1.4 Italy
- 11.1.5 Rest of Europe
- 12. Asia Pacific Quadricycle and Tricycle Industry Analysis, Insights and Forecast, 2019-2031
- 12.1. Market Analysis, Insights and Forecast - By Country/Sub-region
- 12.1.1 China
- 12.1.2 Japan
- 12.1.3 India
- 12.1.4 South Korea
- 12.1.5 Rest of Asia Pacific
- 13. Rest of the World Quadricycle and Tricycle Industry Analysis, Insights and Forecast, 2019-2031
- 13.1. Market Analysis, Insights and Forecast - By Country/Sub-region
- 13.1.1 Brazil
- 13.1.2 South Africa
- 13.1.3 United Arab Emirates
- 13.1.4 Other Countries
- 14. Competitive Analysis
- 14.1. Global Market Share Analysis 2024
- 14.2. Company Profiles
- 14.2.1 Bajaj Auto Ltd
- 14.2.1.1. Overview
- 14.2.1.2. Products
- 14.2.1.3. SWOT Analysis
- 14.2.1.4. Recent Developments
- 14.2.1.5. Financials (Based on Availability)
- 14.2.2 Electronio Wheels
- 14.2.2.1. Overview
- 14.2.2.2. Products
- 14.2.2.3. SWOT Analysis
- 14.2.2.4. Recent Developments
- 14.2.2.5. Financials (Based on Availability)
- 14.2.3 Groupe Renaul
- 14.2.3.1. Overview
- 14.2.3.2. Products
- 14.2.3.3. SWOT Analysis
- 14.2.3.4. Recent Developments
- 14.2.3.5. Financials (Based on Availability)
- 14.2.4 Worksman Cycles
- 14.2.4.1. Overview
- 14.2.4.2. Products
- 14.2.4.3. SWOT Analysis
- 14.2.4.4. Recent Developments
- 14.2.4.5. Financials (Based on Availability)
- 14.2.5 Bellier Automobiles
- 14.2.5.1. Overview
- 14.2.5.2. Products
- 14.2.5.3. SWOT Analysis
- 14.2.5.4. Recent Developments
- 14.2.5.5. Financials (Based on Availability)
- 14.2.6 Mahindra and Mahindra
- 14.2.6.1. Overview
- 14.2.6.2. Products
- 14.2.6.3. SWOT Analysis
- 14.2.6.4. Recent Developments
- 14.2.6.5. Financials (Based on Availability)
- 14.2.7 Light Foot Cycle
- 14.2.7.1. Overview
- 14.2.7.2. Products
- 14.2.7.3. SWOT Analysis
- 14.2.7.4. Recent Developments
- 14.2.7.5. Financials (Based on Availability)
- 14.2.8 Automobiles CHATENET
- 14.2.8.1. Overview
- 14.2.8.2. Products
- 14.2.8.3. SWOT Analysis
- 14.2.8.4. Recent Developments
- 14.2.8.5. Financials (Based on Availability)
- 14.2.9 Estrima SRL
- 14.2.9.1. Overview
- 14.2.9.2. Products
- 14.2.9.3. SWOT Analysis
- 14.2.9.4. Recent Developments
- 14.2.9.5. Financials (Based on Availability)
- 14.2.10 Daimus
- 14.2.10.1. Overview
- 14.2.10.2. Products
- 14.2.10.3. SWOT Analysis
- 14.2.10.4. Recent Developments
- 14.2.10.5. Financials (Based on Availability)
- 14.2.11 Ligier Group
- 14.2.11.1. Overview
- 14.2.11.2. Products
- 14.2.11.3. SWOT Analysis
- 14.2.11.4. Recent Developments
- 14.2.11.5. Financials (Based on Availability)
- 14.2.12 Aixam-Mega
- 14.2.12.1. Overview
- 14.2.12.2. Products
- 14.2.12.3. SWOT Analysis
- 14.2.12.4. Recent Developments
- 14.2.12.5. Financials (Based on Availability)
- 14.2.1 Bajaj Auto Ltd
List of Figures
- Figure 1: Global Quadricycle and Tricycle Industry Revenue Breakdown (Million, %) by Region 2024 & 2032
- Figure 2: North America Quadricycle and Tricycle Industry Revenue (Million), by Country 2024 & 2032
- Figure 3: North America Quadricycle and Tricycle Industry Revenue Share (%), by Country 2024 & 2032
- Figure 4: Europe Quadricycle and Tricycle Industry Revenue (Million), by Country 2024 & 2032
- Figure 5: Europe Quadricycle and Tricycle Industry Revenue Share (%), by Country 2024 & 2032
- Figure 6: Asia Pacific Quadricycle and Tricycle Industry Revenue (Million), by Country 2024 & 2032
- Figure 7: Asia Pacific Quadricycle and Tricycle Industry Revenue Share (%), by Country 2024 & 2032
- Figure 8: Rest of the World Quadricycle and Tricycle Industry Revenue (Million), by Country 2024 & 2032
- Figure 9: Rest of the World Quadricycle and Tricycle Industry Revenue Share (%), by Country 2024 & 2032
- Figure 10: North America Quadricycle and Tricycle Industry Revenue (Million), by Power Source Type 2024 & 2032
- Figure 11: North America Quadricycle and Tricycle Industry Revenue Share (%), by Power Source Type 2024 & 2032
- Figure 12: North America Quadricycle and Tricycle Industry Revenue (Million), by Application Type 2024 & 2032
- Figure 13: North America Quadricycle and Tricycle Industry Revenue Share (%), by Application Type 2024 & 2032
- Figure 14: North America Quadricycle and Tricycle Industry Revenue (Million), by Vehicle Type 2024 & 2032
- Figure 15: North America Quadricycle and Tricycle Industry Revenue Share (%), by Vehicle Type 2024 & 2032
- Figure 16: North America Quadricycle and Tricycle Industry Revenue (Million), by Country 2024 & 2032
- Figure 17: North America Quadricycle and Tricycle Industry Revenue Share (%), by Country 2024 & 2032
- Figure 18: Europe Quadricycle and Tricycle Industry Revenue (Million), by Power Source Type 2024 & 2032
- Figure 19: Europe Quadricycle and Tricycle Industry Revenue Share (%), by Power Source Type 2024 & 2032
- Figure 20: Europe Quadricycle and Tricycle Industry Revenue (Million), by Application Type 2024 & 2032
- Figure 21: Europe Quadricycle and Tricycle Industry Revenue Share (%), by Application Type 2024 & 2032
- Figure 22: Europe Quadricycle and Tricycle Industry Revenue (Million), by Vehicle Type 2024 & 2032
- Figure 23: Europe Quadricycle and Tricycle Industry Revenue Share (%), by Vehicle Type 2024 & 2032
- Figure 24: Europe Quadricycle and Tricycle Industry Revenue (Million), by Country 2024 & 2032
- Figure 25: Europe Quadricycle and Tricycle Industry Revenue Share (%), by Country 2024 & 2032
- Figure 26: Asia Pacific Quadricycle and Tricycle Industry Revenue (Million), by Power Source Type 2024 & 2032
- Figure 27: Asia Pacific Quadricycle and Tricycle Industry Revenue Share (%), by Power Source Type 2024 & 2032
- Figure 28: Asia Pacific Quadricycle and Tricycle Industry Revenue (Million), by Application Type 2024 & 2032
- Figure 29: Asia Pacific Quadricycle and Tricycle Industry Revenue Share (%), by Application Type 2024 & 2032
- Figure 30: Asia Pacific Quadricycle and Tricycle Industry Revenue (Million), by Vehicle Type 2024 & 2032
- Figure 31: Asia Pacific Quadricycle and Tricycle Industry Revenue Share (%), by Vehicle Type 2024 & 2032
- Figure 32: Asia Pacific Quadricycle and Tricycle Industry Revenue (Million), by Country 2024 & 2032
- Figure 33: Asia Pacific Quadricycle and Tricycle Industry Revenue Share (%), by Country 2024 & 2032
- Figure 34: Rest of the World Quadricycle and Tricycle Industry Revenue (Million), by Power Source Type 2024 & 2032
- Figure 35: Rest of the World Quadricycle and Tricycle Industry Revenue Share (%), by Power Source Type 2024 & 2032
- Figure 36: Rest of the World Quadricycle and Tricycle Industry Revenue (Million), by Application Type 2024 & 2032
- Figure 37: Rest of the World Quadricycle and Tricycle Industry Revenue Share (%), by Application Type 2024 & 2032
- Figure 38: Rest of the World Quadricycle and Tricycle Industry Revenue (Million), by Vehicle Type 2024 & 2032
- Figure 39: Rest of the World Quadricycle and Tricycle Industry Revenue Share (%), by Vehicle Type 2024 & 2032
- Figure 40: Rest of the World Quadricycle and Tricycle Industry Revenue (Million), by Country 2024 & 2032
- Figure 41: Rest of the World Quadricycle and Tricycle Industry Revenue Share (%), by Country 2024 & 2032
List of Tables
- Table 1: Global Quadricycle and Tricycle Industry Revenue Million Forecast, by Region 2019 & 2032
- Table 2: Global Quadricycle and Tricycle Industry Revenue Million Forecast, by Power Source Type 2019 & 2032
- Table 3: Global Quadricycle and Tricycle Industry Revenue Million Forecast, by Application Type 2019 & 2032
- Table 4: Global Quadricycle and Tricycle Industry Revenue Million Forecast, by Vehicle Type 2019 & 2032
- Table 5: Global Quadricycle and Tricycle Industry Revenue Million Forecast, by Region 2019 & 2032
- Table 6: Global Quadricycle and Tricycle Industry Revenue Million Forecast, by Country 2019 & 2032
- Table 7: United States Quadricycle and Tricycle Industry Revenue (Million) Forecast, by Application 2019 & 2032
- Table 8: Canada Quadricycle and Tricycle Industry Revenue (Million) Forecast, by Application 2019 & 2032
- Table 9: Rest of North America Quadricycle and Tricycle Industry Revenue (Million) Forecast, by Application 2019 & 2032
- Table 10: Global Quadricycle and Tricycle Industry Revenue Million Forecast, by Country 2019 & 2032
- Table 11: Germany Quadricycle and Tricycle Industry Revenue (Million) Forecast, by Application 2019 & 2032
- Table 12: United Kingdom Quadricycle and Tricycle Industry Revenue (Million) Forecast, by Application 2019 & 2032
- Table 13: France Quadricycle and Tricycle Industry Revenue (Million) Forecast, by Application 2019 & 2032
- Table 14: Italy Quadricycle and Tricycle Industry Revenue (Million) Forecast, by Application 2019 & 2032
- Table 15: Rest of Europe Quadricycle and Tricycle Industry Revenue (Million) Forecast, by Application 2019 & 2032
- Table 16: Global Quadricycle and Tricycle Industry Revenue Million Forecast, by Country 2019 & 2032
- Table 17: China Quadricycle and Tricycle Industry Revenue (Million) Forecast, by Application 2019 & 2032
- Table 18: Japan Quadricycle and Tricycle Industry Revenue (Million) Forecast, by Application 2019 & 2032
- Table 19: India Quadricycle and Tricycle Industry Revenue (Million) Forecast, by Application 2019 & 2032
- Table 20: South Korea Quadricycle and Tricycle Industry Revenue (Million) Forecast, by Application 2019 & 2032
- Table 21: Rest of Asia Pacific Quadricycle and Tricycle Industry Revenue (Million) Forecast, by Application 2019 & 2032
- Table 22: Global Quadricycle and Tricycle Industry Revenue Million Forecast, by Country 2019 & 2032
- Table 23: Brazil Quadricycle and Tricycle Industry Revenue (Million) Forecast, by Application 2019 & 2032
- Table 24: South Africa Quadricycle and Tricycle Industry Revenue (Million) Forecast, by Application 2019 & 2032
- Table 25: United Arab Emirates Quadricycle and Tricycle Industry Revenue (Million) Forecast, by Application 2019 & 2032
- Table 26: Other Countries Quadricycle and Tricycle Industry Revenue (Million) Forecast, by Application 2019 & 2032
- Table 27: Global Quadricycle and Tricycle Industry Revenue Million Forecast, by Power Source Type 2019 & 2032
- Table 28: Global Quadricycle and Tricycle Industry Revenue Million Forecast, by Application Type 2019 & 2032
- Table 29: Global Quadricycle and Tricycle Industry Revenue Million Forecast, by Vehicle Type 2019 & 2032
- Table 30: Global Quadricycle and Tricycle Industry Revenue Million Forecast, by Country 2019 & 2032
- Table 31: United States Quadricycle and Tricycle Industry Revenue (Million) Forecast, by Application 2019 & 2032
- Table 32: Canada Quadricycle and Tricycle Industry Revenue (Million) Forecast, by Application 2019 & 2032
- Table 33: Rest of North America Quadricycle and Tricycle Industry Revenue (Million) Forecast, by Application 2019 & 2032
- Table 34: Global Quadricycle and Tricycle Industry Revenue Million Forecast, by Power Source Type 2019 & 2032
- Table 35: Global Quadricycle and Tricycle Industry Revenue Million Forecast, by Application Type 2019 & 2032
- Table 36: Global Quadricycle and Tricycle Industry Revenue Million Forecast, by Vehicle Type 2019 & 2032
- Table 37: Global Quadricycle and Tricycle Industry Revenue Million Forecast, by Country 2019 & 2032
- Table 38: Germany Quadricycle and Tricycle Industry Revenue (Million) Forecast, by Application 2019 & 2032
- Table 39: United Kingdom Quadricycle and Tricycle Industry Revenue (Million) Forecast, by Application 2019 & 2032
- Table 40: France Quadricycle and Tricycle Industry Revenue (Million) Forecast, by Application 2019 & 2032
- Table 41: Italy Quadricycle and Tricycle Industry Revenue (Million) Forecast, by Application 2019 & 2032
- Table 42: Rest of Europe Quadricycle and Tricycle Industry Revenue (Million) Forecast, by Application 2019 & 2032
- Table 43: Global Quadricycle and Tricycle Industry Revenue Million Forecast, by Power Source Type 2019 & 2032
- Table 44: Global Quadricycle and Tricycle Industry Revenue Million Forecast, by Application Type 2019 & 2032
- Table 45: Global Quadricycle and Tricycle Industry Revenue Million Forecast, by Vehicle Type 2019 & 2032
- Table 46: Global Quadricycle and Tricycle Industry Revenue Million Forecast, by Country 2019 & 2032
- Table 47: China Quadricycle and Tricycle Industry Revenue (Million) Forecast, by Application 2019 & 2032
- Table 48: Japan Quadricycle and Tricycle Industry Revenue (Million) Forecast, by Application 2019 & 2032
- Table 49: India Quadricycle and Tricycle Industry Revenue (Million) Forecast, by Application 2019 & 2032
- Table 50: South Korea Quadricycle and Tricycle Industry Revenue (Million) Forecast, by Application 2019 & 2032
- Table 51: Rest of Asia Pacific Quadricycle and Tricycle Industry Revenue (Million) Forecast, by Application 2019 & 2032
- Table 52: Global Quadricycle and Tricycle Industry Revenue Million Forecast, by Power Source Type 2019 & 2032
- Table 53: Global Quadricycle and Tricycle Industry Revenue Million Forecast, by Application Type 2019 & 2032
- Table 54: Global Quadricycle and Tricycle Industry Revenue Million Forecast, by Vehicle Type 2019 & 2032
- Table 55: Global Quadricycle and Tricycle Industry Revenue Million Forecast, by Country 2019 & 2032
- Table 56: Brazil Quadricycle and Tricycle Industry Revenue (Million) Forecast, by Application 2019 & 2032
- Table 57: South Africa Quadricycle and Tricycle Industry Revenue (Million) Forecast, by Application 2019 & 2032
- Table 58: United Arab Emirates Quadricycle and Tricycle Industry Revenue (Million) Forecast, by Application 2019 & 2032
- Table 59: Other Countries Quadricycle and Tricycle Industry Revenue (Million) Forecast, by Application 2019 & 2032
Frequently Asked Questions
1. What is the projected Compound Annual Growth Rate (CAGR) of the Quadricycle and Tricycle Industry?
The projected CAGR is approximately 10.84%.
2. Which companies are prominent players in the Quadricycle and Tricycle Industry?
Key companies in the market include Bajaj Auto Ltd, Electronio Wheels, Groupe Renaul, Worksman Cycles, Bellier Automobiles, Mahindra and Mahindra, Light Foot Cycle, Automobiles CHATENET, Estrima SRL, Daimus, Ligier Group, Aixam-Mega.
3. What are the main segments of the Quadricycle and Tricycle Industry?
The market segments include Power Source Type, Application Type, Vehicle Type.
4. Can you provide details about the market size?
The market size is estimated to be USD 8.20 Million as of 2022.
5. What are some drivers contributing to market growth?
Integration With Telematics And Fleet Management Systems; Others.
6. What are the notable trends driving market growth?
Growing Adoption of Quadricycles Expected to Enhance Demand in the Market.
7. Are there any restraints impacting market growth?
The Initial Costs Associated With Purchasing And Installing ELD Systems is High; Others.
8. Can you provide examples of recent developments in the market?
N/A
9. What pricing options are available for accessing the report?
Pricing options include single-user, multi-user, and enterprise licenses priced at USD 4750, USD 5250, and USD 8750 respectively.
10. Is the market size provided in terms of value or volume?
The market size is provided in terms of value, measured in Million.
11. Are there any specific market keywords associated with the report?
Yes, the market keyword associated with the report is "Quadricycle and Tricycle Industry," which aids in identifying and referencing the specific market segment covered.
12. How do I determine which pricing option suits my needs best?
The pricing options vary based on user requirements and access needs. Individual users may opt for single-user licenses, while businesses requiring broader access may choose multi-user or enterprise licenses for cost-effective access to the report.
13. Are there any additional resources or data provided in the Quadricycle and Tricycle Industry report?
While the report offers comprehensive insights, it's advisable to review the specific contents or supplementary materials provided to ascertain if additional resources or data are available.
14. How can I stay updated on further developments or reports in the Quadricycle and Tricycle Industry?
To stay informed about further developments, trends, and reports in the Quadricycle and Tricycle Industry, consider subscribing to industry newsletters, following relevant companies and organizations, or regularly checking reputable industry news sources and publications.
Methodology
Step 1 - Identification of Relevant Samples Size from Population Database


Step 2 - Approaches for Defining Global Market Size (Value, Volume* & Price*)

Note*: In applicable scenarios
Step 3 - Data Sources
Primary Research
- Web Analytics
- Survey Reports
- Research Institute
- Latest Research Reports
- Opinion Leaders
Secondary Research
- Annual Reports
- White Paper
- Latest Press Release
- Industry Association
- Paid Database
- Investor Presentations

Step 4 - Data Triangulation
Involves using different sources of information in order to increase the validity of a study
These sources are likely to be stakeholders in a program - participants, other researchers, program staff, other community members, and so on.
Then we put all data in single framework & apply various statistical tools to find out the dynamic on the market.
During the analysis stage, feedback from the stakeholder groups would be compared to determine areas of agreement as well as areas of divergence


