

Key Insights
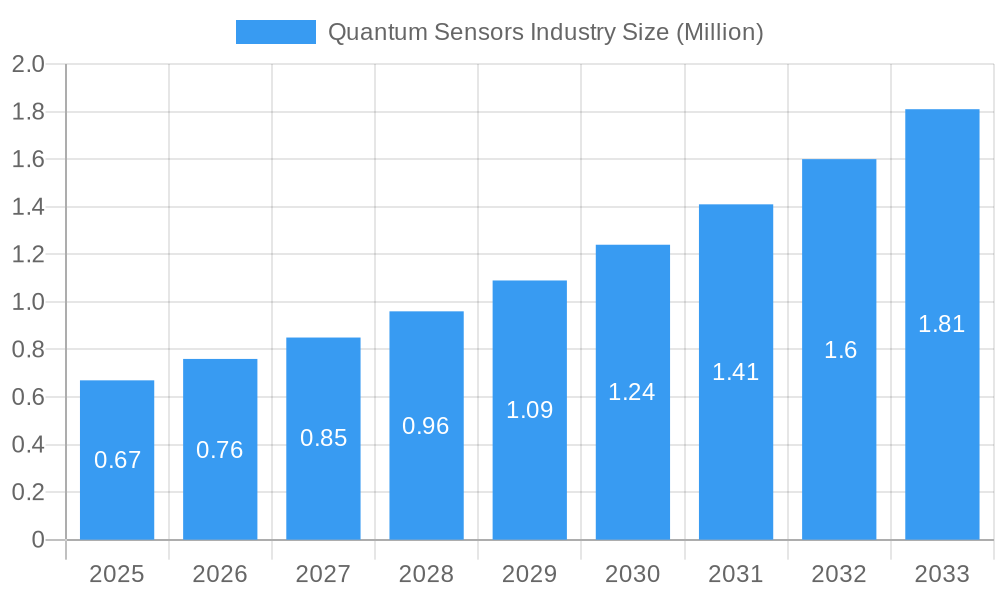
The global Quantum Sensors market is poised for substantial growth, driven by the increasing demand for precise measurement capabilities across diverse industries. The market is projected to reach an estimated $0.67 Billion in 2025, exhibiting a remarkable Compound Annual Growth Rate (CAGR) of 12.95% throughout the forecast period of 2025-2033. This expansion is fueled by critical applications in military and defense for advanced navigation and surveillance, the automotive sector for enhanced autonomous driving systems, and the oil and gas industry for improved subsurface exploration and monitoring. The healthcare domain also presents significant growth opportunities, with quantum sensors enabling more accurate diagnostic tools and personalized medicine.
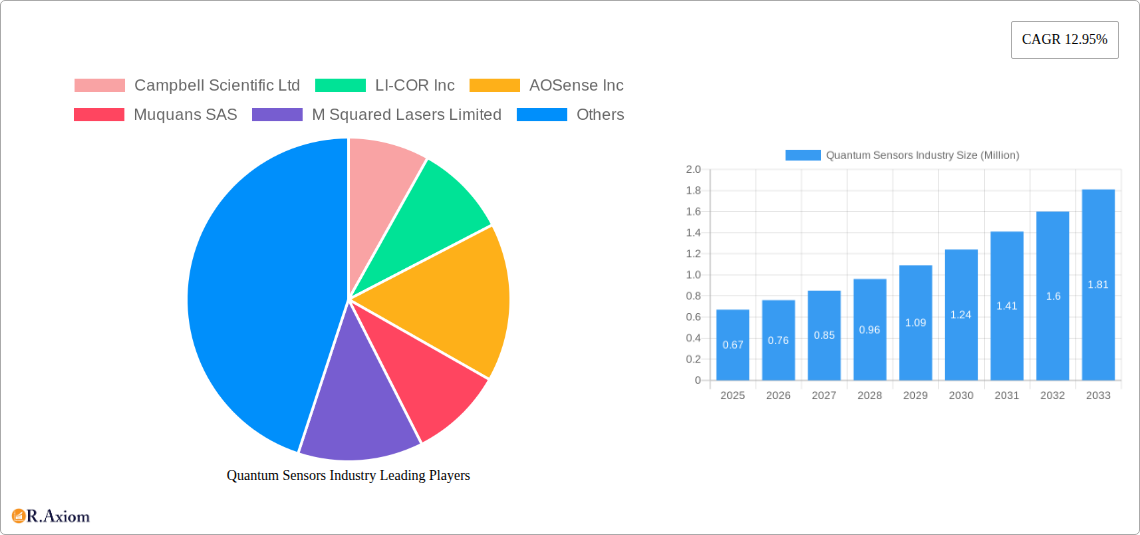
Quantum Sensors Industry Market Size (In Million)
Key market drivers include the continuous innovation in quantum technology, leading to the development of more sensitive and robust quantum sensors such as atomic clocks, magnetic sensors, and PAR quantum sensors. Furthermore, the growing adoption of IoT devices and the increasing need for high-precision data collection in scientific research and industrial automation are significantly contributing to market expansion. Despite the immense potential, the market faces certain restraints, including the high cost of research and development and the complexity of quantum sensor manufacturing. However, ongoing technological advancements and strategic collaborations among leading companies like Campbell Scientific Ltd, LI-COR Inc, and Robert Bosch GmbH are expected to mitigate these challenges and accelerate market penetration across the globe, particularly in technologically advanced regions like North America and Europe.
Quantum Sensors Industry Company Market Share
This in-depth report offers a definitive analysis of the global Quantum Sensors Industry, providing critical insights into market dynamics, technological advancements, and future growth trajectories. Covering the historical period from 2019 to 2024 and projecting forward to 2033, with a base year of 2025, this research is an indispensable resource for stakeholders seeking to understand and capitalize on the burgeoning quantum sensing landscape. The report meticulously examines key segments, dominant players, and emerging trends, offering actionable intelligence for strategic decision-making.
Quantum Sensors Industry Market Concentration & Innovation
The Quantum Sensors Industry exhibits a moderate market concentration, with a growing number of innovative companies driving advancements. Key innovation drivers include the pursuit of enhanced precision, sensitivity, and miniaturization for diverse applications. Regulatory frameworks, while still evolving, are increasingly supportive of quantum technology development, particularly in defense and scientific research. Product substitutes, though currently limited in scope and performance, may emerge as conventional sensing technologies improve. End-user trends are strongly influenced by the demand for superior data acquisition and analysis capabilities across critical sectors. Mergers and acquisitions (M&A) activity is anticipated to increase as larger corporations seek to integrate cutting-edge quantum sensing technologies into their existing portfolios, with projected M&A deal values in the hundreds of millions of dollars. Key players like Robert Bosch GmbH and Apogee Instrument Inc. are actively investing in R&D, signaling a competitive yet collaborative environment.
Quantum Sensors Industry Industry Trends & Insights
The Quantum Sensors Industry is poised for exceptional growth, projected to experience a Compound Annual Growth Rate (CAGR) of over 20% from 2025 to 2033. This rapid expansion is fueled by a confluence of technological breakthroughs, increasing demand for high-precision measurement, and the burgeoning adoption of quantum technologies across various sectors. The market penetration of quantum sensors, while still in its nascent stages, is expected to accelerate significantly as costs decrease and practical applications become more widespread. Technological disruptions, such as advancements in atomic clocks, magnetic sensors, and gravimetric sensors, are continuously redefining the capabilities and potential of quantum sensing. Consumer preferences are shifting towards solutions offering unparalleled accuracy, real-time data, and the ability to detect phenomena previously undetectable. This evolving demand is compelling companies to innovate rapidly and develop next-generation quantum sensing platforms. The competitive landscape is characterized by intense R&D efforts, strategic partnerships, and a growing influx of venture capital, all aimed at securing a leading position in this transformative market. Market size is projected to reach tens of billions of dollars by 2033, driven by applications in areas like navigation, medical diagnostics, and fundamental scientific research.
Dominant Markets & Segments in Quantum Sensors Industry
The Military and Defense sector is currently a dominant market for quantum sensors, driven by the need for advanced navigation, surveillance, and unjammable GPS alternatives. The inherent precision and covert operational capabilities of quantum sensors offer a significant strategic advantage.
- Product Type Dominance:
- Atomic Clocks: These are critical for precise timing in navigation systems (e.g., defense, autonomous vehicles) and telecommunications, ensuring unparalleled accuracy. The market for atomic clocks is expected to grow substantially due to their indispensable role in secure communications and advanced timing applications.
- Magnetic Sensors: Highly sought after for their ability to detect minute magnetic field variations, crucial for subterranean mineral exploration (Oil and Gas), medical imaging (Healthcare), and unexploded ordnance detection (Military and Defense).
- PAR Quantum Sensors: While not as established as atomic clocks or magnetic sensors in terms of broad industrial adoption, these are gaining traction in specialized scientific research and environmental monitoring, with strong potential for growth in agricultural technology and climate science applications.
- Gravity Sensors: Essential for geophysical surveys in the Oil and Gas sector, geological research, and potential applications in autonomous vehicle navigation by detecting gravitational anomalies.
- Application Dominance:
- Military and Defense: This segment leads due to high investment in next-generation sensing capabilities, including quantum magnetometers for stealth detection and atomic clocks for secure navigation.
- Automotive: Emerging as a significant growth area, particularly for advanced driver-assistance systems (ADAS) and autonomous driving, leveraging quantum sensors for enhanced object detection and precise localization.
- Oil and Gas: Quantum gravity sensors are revolutionizing subsurface exploration, enabling more accurate and efficient identification of oil and gas reserves, reducing exploration costs and risks.
- Healthcare: Applications in advanced medical imaging, non-invasive diagnostics, and highly sensitive biomagnetic detection are driving significant interest and investment.
The economic policies supporting high-tech research and development in regions like North America and Europe are significant drivers for segment dominance. Infrastructure development in areas like quantum computing is indirectly fueling the quantum sensors market by creating a need for associated precise instrumentation.
Quantum Sensors Industry Product Developments
Recent product developments in the Quantum Sensors Industry focus on enhancing miniaturization, ruggedization, and power efficiency for wider deployment. Innovations include compact atomic clocks for portable navigation devices, highly sensitive quantum magnetometers for medical diagnostics and geological surveys, and advanced gravimeters for improved precision in environmental monitoring. These advancements aim to bridge the gap between laboratory prototypes and commercially viable, field-deployable sensing solutions. The competitive advantage lies in achieving higher signal-to-noise ratios, greater temporal and spatial resolution, and reduced susceptibility to external interference, making these new products indispensable for applications demanding extreme accuracy.
Quantum Sensors Industry Report Scope & Segmentation Analysis
This report segmentations encompass:
Product Type:
- Atomic Clocks: Projected market growth is robust, driven by telecommunications and defense. Market size is estimated to be in the billions.
- Magnetic Sensors: Significant growth expected, particularly in automotive and oil & gas applications. Market size is projected to be in the billions.
- PAR Quantum Sensors: Nascent but rapidly growing segment with strong potential in scientific research and niche agricultural applications. Growth projections are high but from a smaller base.
- Gravity Sensors: Strong demand from Oil & Gas and scientific exploration sectors, with steady growth anticipated. Market size is in the hundreds of millions.
- Other Product Types: Includes a range of specialized quantum sensors with emerging applications.
Application:
- Military and Defense: Dominant segment with substantial ongoing investment.
- Automotive: High growth potential driven by autonomous driving initiatives.
- Oil and Gas: Steady growth fueled by exploration needs.
- Healthcare: Rapidly expanding segment with transformative diagnostic possibilities.
- Other Applications: Encompasses scientific research, environmental monitoring, and industrial automation.
Key Drivers of Quantum Sensors Industry Growth
The quantum sensors market is propelled by several key drivers:
- Unprecedented Precision and Sensitivity: The inherent quantum mechanical properties enable measurements far beyond the capabilities of classical sensors.
- Technological Advancements: Continuous innovation in quantum computing and related fields is spilling over into sensor development, leading to more sophisticated and accessible devices.
- Increasing Demand for High-Accuracy Data: Industries like automotive, healthcare, and defense require extremely precise data for critical operations.
- Government Funding and Research Initiatives: Significant investments from national science foundations and defense departments are accelerating R&D.
- Development of New Applications: Emerging use cases in areas like navigation, medical diagnostics, and subterranean resource exploration are opening new market avenues.
Challenges in the Quantum Sensors Industry Sector
Despite its promising outlook, the Quantum Sensors Industry faces several challenges:
- High Development and Manufacturing Costs: The complex nature of quantum systems often results in substantial upfront investment and specialized manufacturing processes.
- Scalability and Miniaturization: Translating laboratory-scale quantum sensors into robust, compact, and mass-producible devices remains a significant hurdle.
- Environmental Sensitivity: Many quantum sensors are susceptible to external factors like temperature fluctuations and electromagnetic interference, requiring sophisticated shielding and stabilization.
- Talent Gap: A shortage of highly skilled quantum physicists and engineers specialized in sensor development and application can impede progress.
- Market Education and Adoption: Educating potential end-users about the benefits and practical applications of quantum sensors is crucial for wider market acceptance.
Emerging Opportunities in Quantum Sensors Industry
The Quantum Sensors Industry is ripe with emerging opportunities:
- Quantum Navigation and Timing: Development of GPS-denied navigation systems and ultra-precise timing solutions for secure communications and financial transactions.
- Advanced Medical Diagnostics: Non-invasive disease detection, highly sensitive biomagnetic imaging, and personalized medicine applications.
- Subsurface Exploration: Revolutionizing the discovery of mineral resources, oil, and gas through highly accurate gravimetric and magnetic sensing.
- Environmental Monitoring: Enhanced capabilities for detecting subtle environmental changes, pollution, and atmospheric conditions.
- Industrial Automation and Control: Integration of quantum sensors for unprecedented precision in manufacturing processes and quality control.
Leading Players in the Quantum Sensors Industry Market
- Campbell Scientific Ltd
- LI-COR Inc
- AOSense Inc
- Muquans SAS
- M Squared Lasers Limited
- Skye Instruments Ltd
- Robert Bosch GmbH
- Apogee Instrument Inc
Key Developments in Quantum Sensors Industry Industry
- April 2024: The US National Science Foundation invested USD 29 million to assist 18 teams of researchers at universities across the United States to explore quantum sensing. Each research team will receive around USD 2 million over four years to research quantum phenomena, such as entanglement, to create sensors to assist in things that would otherwise be impossible. Quantum sensors can enable experts to pinpoint infections inside individual cells and find subterranean mineral deposits. This investment significantly boosts fundamental research and accelerates the path to market for new quantum sensing technologies.
- January 2024: The Brazilian government announced a new industrial policy with development goals and measures up to 2033. The new policies are expected to directly improve people's daily lives, stimulate production and technology development, increase the competitiveness of the Brazilian industry, provide investment guidance, promote better jobs, and enhance the country's qualified presence in the international market. This policy provides a framework for fostering quantum technology development within Brazil, potentially creating new market opportunities and driving local innovation.
Strategic Outlook for Quantum Sensors Industry Market
The strategic outlook for the Quantum Sensors Industry is exceptionally positive, driven by a clear demand for enhanced precision and novel sensing capabilities. Key growth catalysts include continued government investment in fundamental research and defense applications, coupled with the increasing realization of quantum sensors' transformative potential in sectors like healthcare and autonomous systems. The industry is expected to witness significant breakthroughs in miniaturization and cost reduction, paving the way for broader commercial adoption. Strategic collaborations between research institutions and private companies will be crucial for translating scientific discoveries into market-ready products. Emerging opportunities in areas like quantum navigation and advanced medical diagnostics present substantial long-term growth prospects, solidifying the quantum sensors market as a vital component of future technological advancement.
Quantum Sensors Industry Segmentation
-
1. Product Type
- 1.1. Atomic Clocks
- 1.2. Magnetic Sensors
- 1.3. PAR Quantum Sensors
- 1.4. Gravity Sensors
- 1.5. Other Product Types
-
2. Application
- 2.1. Military and Defense
- 2.2. Automotive
- 2.3. Oil and Gas
- 2.4. Healthcare
- 2.5. Other Applications
Quantum Sensors Industry Segmentation By Geography
-
1. North America
- 1.1. United States
- 1.2. Canada
- 1.3. Mexico
-
2. Europe
- 2.1. Germany
- 2.2. United Kingdom
- 2.3. France
- 2.4. Italy
- 2.5. Spain
- 2.6. Rest of Europe
-
3. Asia
- 3.1. China
- 3.2. Japan
- 3.3. India
- 3.4. Australia
- 3.5. South Korea
- 3.6. Rest of Asia Pacific
-
4. Middle East and Africa
- 4.1. UAE
- 4.2. South Africa
- 4.3. Saudi Arabia
- 4.4. Rest Of MEA
-
5. Latin America
- 5.1. Brazil
- 5.2. Argentina
- 5.3. Rest of South America
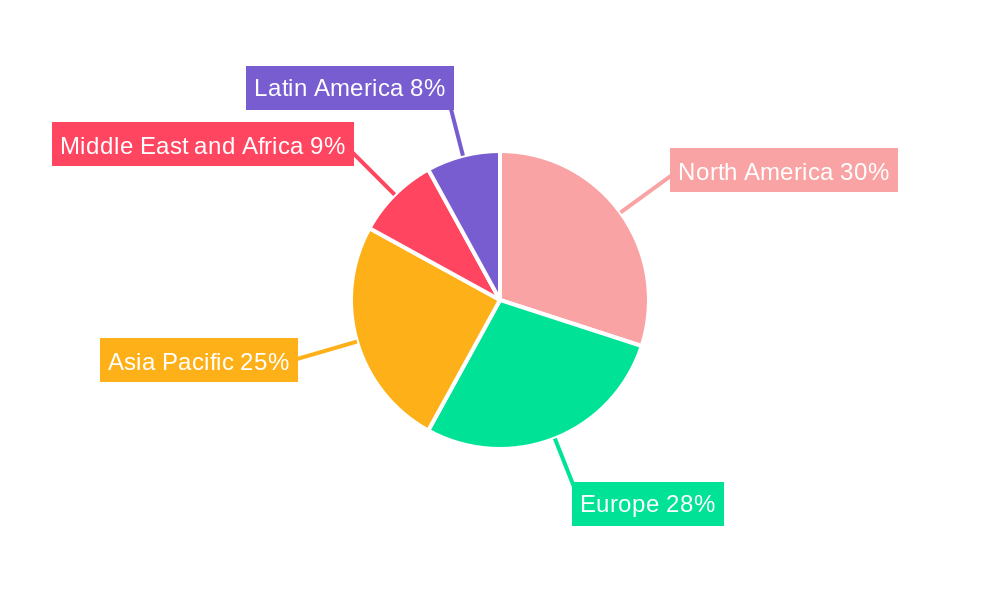
Quantum Sensors Industry Regional Market Share
Geographic Coverage of Quantum Sensors Industry
Quantum Sensors Industry REPORT HIGHLIGHTS
| Aspects | Details |
|---|---|
| Study Period | 2020-2034 |
| Base Year | 2025 |
| Estimated Year | 2026 |
| Forecast Period | 2026-2034 |
| Historical Period | 2020-2025 |
| Growth Rate | CAGR of 12.95% from 2020-2034 |
| Segmentation |
|
Table of Contents
- 1. Introduction
- 1.1. Research Scope
- 1.2. Market Segmentation
- 1.3. Research Objective
- 1.4. Definitions and Assumptions
- 2. Executive Summary
- 2.1. Market Snapshot
- 3. Market Dynamics
- 3.1. Market Drivers
- 3.2. Market Restrains
- 3.3. Market Trends
- 3.4. Market Opportunities
- 4. Market Factor Analysis
- 4.1. Porters Five Forces
- 4.1.1. Bargaining Power of Suppliers
- 4.1.2. Bargaining Power of Buyers
- 4.1.3. Threat of New Entrants
- 4.1.4. Threat of Substitutes
- 4.1.5. Competitive Rivalry
- 4.2. PESTEL analysis
- 4.3. BCG Analysis
- 4.3.1. Stars (High Growth, High Market Share)
- 4.3.2. Cash Cows (Low Growth, High Market Share)
- 4.3.3. Question Mark (High Growth, Low Market Share)
- 4.3.4. Dogs (Low Growth, Low Market Share)
- 4.4. Ansoff Matrix Analysis
- 4.5. Supply Chain Analysis
- 4.6. Regulatory Landscape
- 4.7. Current Market Potential and Opportunity Assessment (TAM–SAM–SOM Framework)
- 4.8. RAX Analyst Note
- 4.1. Porters Five Forces
- 5. Market Analysis, Insights and Forecast 2021-2033
- 5.1. Market Analysis, Insights and Forecast - by Product Type
- 5.1.1. Atomic Clocks
- 5.1.2. Magnetic Sensors
- 5.1.3. PAR Quantum Sensors
- 5.1.4. Gravity Sensors
- 5.1.5. Other Product Types
- 5.2. Market Analysis, Insights and Forecast - by Application
- 5.2.1. Military and Defense
- 5.2.2. Automotive
- 5.2.3. Oil and Gas
- 5.2.4. Healthcare
- 5.2.5. Other Applications
- 5.3. Market Analysis, Insights and Forecast - by Region
- 5.3.1. North America
- 5.3.2. Europe
- 5.3.3. Asia
- 5.3.4. Middle East and Africa
- 5.3.5. Latin America
- 5.1. Market Analysis, Insights and Forecast - by Product Type
- 6. Global Quantum Sensors Industry Analysis, Insights and Forecast, 2021-2033
- 6.1. Market Analysis, Insights and Forecast - by Product Type
- 6.1.1. Atomic Clocks
- 6.1.2. Magnetic Sensors
- 6.1.3. PAR Quantum Sensors
- 6.1.4. Gravity Sensors
- 6.1.5. Other Product Types
- 6.2. Market Analysis, Insights and Forecast - by Application
- 6.2.1. Military and Defense
- 6.2.2. Automotive
- 6.2.3. Oil and Gas
- 6.2.4. Healthcare
- 6.2.5. Other Applications
- 6.1. Market Analysis, Insights and Forecast - by Product Type
- 7. North America Quantum Sensors Industry Analysis, Insights and Forecast, 2020-2032
- 7.1. Market Analysis, Insights and Forecast - by Product Type
- 7.1.1. Atomic Clocks
- 7.1.2. Magnetic Sensors
- 7.1.3. PAR Quantum Sensors
- 7.1.4. Gravity Sensors
- 7.1.5. Other Product Types
- 7.2. Market Analysis, Insights and Forecast - by Application
- 7.2.1. Military and Defense
- 7.2.2. Automotive
- 7.2.3. Oil and Gas
- 7.2.4. Healthcare
- 7.2.5. Other Applications
- 7.1. Market Analysis, Insights and Forecast - by Product Type
- 8. Europe Quantum Sensors Industry Analysis, Insights and Forecast, 2020-2032
- 8.1. Market Analysis, Insights and Forecast - by Product Type
- 8.1.1. Atomic Clocks
- 8.1.2. Magnetic Sensors
- 8.1.3. PAR Quantum Sensors
- 8.1.4. Gravity Sensors
- 8.1.5. Other Product Types
- 8.2. Market Analysis, Insights and Forecast - by Application
- 8.2.1. Military and Defense
- 8.2.2. Automotive
- 8.2.3. Oil and Gas
- 8.2.4. Healthcare
- 8.2.5. Other Applications
- 8.1. Market Analysis, Insights and Forecast - by Product Type
- 9. Asia Quantum Sensors Industry Analysis, Insights and Forecast, 2020-2032
- 9.1. Market Analysis, Insights and Forecast - by Product Type
- 9.1.1. Atomic Clocks
- 9.1.2. Magnetic Sensors
- 9.1.3. PAR Quantum Sensors
- 9.1.4. Gravity Sensors
- 9.1.5. Other Product Types
- 9.2. Market Analysis, Insights and Forecast - by Application
- 9.2.1. Military and Defense
- 9.2.2. Automotive
- 9.2.3. Oil and Gas
- 9.2.4. Healthcare
- 9.2.5. Other Applications
- 9.1. Market Analysis, Insights and Forecast - by Product Type
- 10. Middle East and Africa Quantum Sensors Industry Analysis, Insights and Forecast, 2020-2032
- 10.1. Market Analysis, Insights and Forecast - by Product Type
- 10.1.1. Atomic Clocks
- 10.1.2. Magnetic Sensors
- 10.1.3. PAR Quantum Sensors
- 10.1.4. Gravity Sensors
- 10.1.5. Other Product Types
- 10.2. Market Analysis, Insights and Forecast - by Application
- 10.2.1. Military and Defense
- 10.2.2. Automotive
- 10.2.3. Oil and Gas
- 10.2.4. Healthcare
- 10.2.5. Other Applications
- 10.1. Market Analysis, Insights and Forecast - by Product Type
- 11. Latin America Quantum Sensors Industry Analysis, Insights and Forecast, 2020-2032
- 11.1. Market Analysis, Insights and Forecast - by Product Type
- 11.1.1. Atomic Clocks
- 11.1.2. Magnetic Sensors
- 11.1.3. PAR Quantum Sensors
- 11.1.4. Gravity Sensors
- 11.1.5. Other Product Types
- 11.2. Market Analysis, Insights and Forecast - by Application
- 11.2.1. Military and Defense
- 11.2.2. Automotive
- 11.2.3. Oil and Gas
- 11.2.4. Healthcare
- 11.2.5. Other Applications
- 11.1. Market Analysis, Insights and Forecast - by Product Type
- 12. Competitive Analysis
- 12.1. Company Profiles
- 12.1.1 Campbell Scientific Ltd
- 12.1.1.1. Company Overview
- 12.1.1.2. Products
- 12.1.1.3. Company Financials
- 12.1.1.4. SWOT Analysis
- 12.1.2 LI-COR Inc
- 12.1.2.1. Company Overview
- 12.1.2.2. Products
- 12.1.2.3. Company Financials
- 12.1.2.4. SWOT Analysis
- 12.1.3 AOSense Inc
- 12.1.3.1. Company Overview
- 12.1.3.2. Products
- 12.1.3.3. Company Financials
- 12.1.3.4. SWOT Analysis
- 12.1.4 Muquans SAS
- 12.1.4.1. Company Overview
- 12.1.4.2. Products
- 12.1.4.3. Company Financials
- 12.1.4.4. SWOT Analysis
- 12.1.5 M Squared Lasers Limited
- 12.1.5.1. Company Overview
- 12.1.5.2. Products
- 12.1.5.3. Company Financials
- 12.1.5.4. SWOT Analysis
- 12.1.6 Skye Instruments Ltd
- 12.1.6.1. Company Overview
- 12.1.6.2. Products
- 12.1.6.3. Company Financials
- 12.1.6.4. SWOT Analysis
- 12.1.7 Robert Bosch GmbH
- 12.1.7.1. Company Overview
- 12.1.7.2. Products
- 12.1.7.3. Company Financials
- 12.1.7.4. SWOT Analysis
- 12.1.8 Apogee Instrument Inc
- 12.1.8.1. Company Overview
- 12.1.8.2. Products
- 12.1.8.3. Company Financials
- 12.1.8.4. SWOT Analysis
- 12.1.1 Campbell Scientific Ltd
- 12.2. Market Entropy
- 12.2.1 Company's Key Areas Served
- 12.2.2 Recent Developments
- 12.3. Company Market Share Analysis 2025
- 12.3.1 Top 5 Companies Market Share Analysis
- 12.3.2 Top 3 Companies Market Share Analysis
- 12.4. List of Potential Customers
- 13. Research Methodology
List of Figures
- Figure 1: Global Quantum Sensors Industry Revenue Breakdown (Million, %) by Region 2025 & 2033
- Figure 2: Global Quantum Sensors Industry Volume Breakdown (K Unit, %) by Region 2025 & 2033
- Figure 3: North America Quantum Sensors Industry Revenue (Million), by Product Type 2025 & 2033
- Figure 4: North America Quantum Sensors Industry Volume (K Unit), by Product Type 2025 & 2033
- Figure 5: North America Quantum Sensors Industry Revenue Share (%), by Product Type 2025 & 2033
- Figure 6: North America Quantum Sensors Industry Volume Share (%), by Product Type 2025 & 2033
- Figure 7: North America Quantum Sensors Industry Revenue (Million), by Application 2025 & 2033
- Figure 8: North America Quantum Sensors Industry Volume (K Unit), by Application 2025 & 2033
- Figure 9: North America Quantum Sensors Industry Revenue Share (%), by Application 2025 & 2033
- Figure 10: North America Quantum Sensors Industry Volume Share (%), by Application 2025 & 2033
- Figure 11: North America Quantum Sensors Industry Revenue (Million), by Country 2025 & 2033
- Figure 12: North America Quantum Sensors Industry Volume (K Unit), by Country 2025 & 2033
- Figure 13: North America Quantum Sensors Industry Revenue Share (%), by Country 2025 & 2033
- Figure 14: North America Quantum Sensors Industry Volume Share (%), by Country 2025 & 2033
- Figure 15: Europe Quantum Sensors Industry Revenue (Million), by Product Type 2025 & 2033
- Figure 16: Europe Quantum Sensors Industry Volume (K Unit), by Product Type 2025 & 2033
- Figure 17: Europe Quantum Sensors Industry Revenue Share (%), by Product Type 2025 & 2033
- Figure 18: Europe Quantum Sensors Industry Volume Share (%), by Product Type 2025 & 2033
- Figure 19: Europe Quantum Sensors Industry Revenue (Million), by Application 2025 & 2033
- Figure 20: Europe Quantum Sensors Industry Volume (K Unit), by Application 2025 & 2033
- Figure 21: Europe Quantum Sensors Industry Revenue Share (%), by Application 2025 & 2033
- Figure 22: Europe Quantum Sensors Industry Volume Share (%), by Application 2025 & 2033
- Figure 23: Europe Quantum Sensors Industry Revenue (Million), by Country 2025 & 2033
- Figure 24: Europe Quantum Sensors Industry Volume (K Unit), by Country 2025 & 2033
- Figure 25: Europe Quantum Sensors Industry Revenue Share (%), by Country 2025 & 2033
- Figure 26: Europe Quantum Sensors Industry Volume Share (%), by Country 2025 & 2033
- Figure 27: Asia Quantum Sensors Industry Revenue (Million), by Product Type 2025 & 2033
- Figure 28: Asia Quantum Sensors Industry Volume (K Unit), by Product Type 2025 & 2033
- Figure 29: Asia Quantum Sensors Industry Revenue Share (%), by Product Type 2025 & 2033
- Figure 30: Asia Quantum Sensors Industry Volume Share (%), by Product Type 2025 & 2033
- Figure 31: Asia Quantum Sensors Industry Revenue (Million), by Application 2025 & 2033
- Figure 32: Asia Quantum Sensors Industry Volume (K Unit), by Application 2025 & 2033
- Figure 33: Asia Quantum Sensors Industry Revenue Share (%), by Application 2025 & 2033
- Figure 34: Asia Quantum Sensors Industry Volume Share (%), by Application 2025 & 2033
- Figure 35: Asia Quantum Sensors Industry Revenue (Million), by Country 2025 & 2033
- Figure 36: Asia Quantum Sensors Industry Volume (K Unit), by Country 2025 & 2033
- Figure 37: Asia Quantum Sensors Industry Revenue Share (%), by Country 2025 & 2033
- Figure 38: Asia Quantum Sensors Industry Volume Share (%), by Country 2025 & 2033
- Figure 39: Middle East and Africa Quantum Sensors Industry Revenue (Million), by Product Type 2025 & 2033
- Figure 40: Middle East and Africa Quantum Sensors Industry Volume (K Unit), by Product Type 2025 & 2033
- Figure 41: Middle East and Africa Quantum Sensors Industry Revenue Share (%), by Product Type 2025 & 2033
- Figure 42: Middle East and Africa Quantum Sensors Industry Volume Share (%), by Product Type 2025 & 2033
- Figure 43: Middle East and Africa Quantum Sensors Industry Revenue (Million), by Application 2025 & 2033
- Figure 44: Middle East and Africa Quantum Sensors Industry Volume (K Unit), by Application 2025 & 2033
- Figure 45: Middle East and Africa Quantum Sensors Industry Revenue Share (%), by Application 2025 & 2033
- Figure 46: Middle East and Africa Quantum Sensors Industry Volume Share (%), by Application 2025 & 2033
- Figure 47: Middle East and Africa Quantum Sensors Industry Revenue (Million), by Country 2025 & 2033
- Figure 48: Middle East and Africa Quantum Sensors Industry Volume (K Unit), by Country 2025 & 2033
- Figure 49: Middle East and Africa Quantum Sensors Industry Revenue Share (%), by Country 2025 & 2033
- Figure 50: Middle East and Africa Quantum Sensors Industry Volume Share (%), by Country 2025 & 2033
- Figure 51: Latin America Quantum Sensors Industry Revenue (Million), by Product Type 2025 & 2033
- Figure 52: Latin America Quantum Sensors Industry Volume (K Unit), by Product Type 2025 & 2033
- Figure 53: Latin America Quantum Sensors Industry Revenue Share (%), by Product Type 2025 & 2033
- Figure 54: Latin America Quantum Sensors Industry Volume Share (%), by Product Type 2025 & 2033
- Figure 55: Latin America Quantum Sensors Industry Revenue (Million), by Application 2025 & 2033
- Figure 56: Latin America Quantum Sensors Industry Volume (K Unit), by Application 2025 & 2033
- Figure 57: Latin America Quantum Sensors Industry Revenue Share (%), by Application 2025 & 2033
- Figure 58: Latin America Quantum Sensors Industry Volume Share (%), by Application 2025 & 2033
- Figure 59: Latin America Quantum Sensors Industry Revenue (Million), by Country 2025 & 2033
- Figure 60: Latin America Quantum Sensors Industry Volume (K Unit), by Country 2025 & 2033
- Figure 61: Latin America Quantum Sensors Industry Revenue Share (%), by Country 2025 & 2033
- Figure 62: Latin America Quantum Sensors Industry Volume Share (%), by Country 2025 & 2033
List of Tables
- Table 1: Global Quantum Sensors Industry Revenue Million Forecast, by Product Type 2020 & 2033
- Table 2: Global Quantum Sensors Industry Volume K Unit Forecast, by Product Type 2020 & 2033
- Table 3: Global Quantum Sensors Industry Revenue Million Forecast, by Application 2020 & 2033
- Table 4: Global Quantum Sensors Industry Volume K Unit Forecast, by Application 2020 & 2033
- Table 5: Global Quantum Sensors Industry Revenue Million Forecast, by Region 2020 & 2033
- Table 6: Global Quantum Sensors Industry Volume K Unit Forecast, by Region 2020 & 2033
- Table 7: Global Quantum Sensors Industry Revenue Million Forecast, by Product Type 2020 & 2033
- Table 8: Global Quantum Sensors Industry Volume K Unit Forecast, by Product Type 2020 & 2033
- Table 9: Global Quantum Sensors Industry Revenue Million Forecast, by Application 2020 & 2033
- Table 10: Global Quantum Sensors Industry Volume K Unit Forecast, by Application 2020 & 2033
- Table 11: Global Quantum Sensors Industry Revenue Million Forecast, by Country 2020 & 2033
- Table 12: Global Quantum Sensors Industry Volume K Unit Forecast, by Country 2020 & 2033
- Table 13: United States Quantum Sensors Industry Revenue (Million) Forecast, by Application 2020 & 2033
- Table 14: United States Quantum Sensors Industry Volume (K Unit) Forecast, by Application 2020 & 2033
- Table 15: Canada Quantum Sensors Industry Revenue (Million) Forecast, by Application 2020 & 2033
- Table 16: Canada Quantum Sensors Industry Volume (K Unit) Forecast, by Application 2020 & 2033
- Table 17: Mexico Quantum Sensors Industry Revenue (Million) Forecast, by Application 2020 & 2033
- Table 18: Mexico Quantum Sensors Industry Volume (K Unit) Forecast, by Application 2020 & 2033
- Table 19: Global Quantum Sensors Industry Revenue Million Forecast, by Product Type 2020 & 2033
- Table 20: Global Quantum Sensors Industry Volume K Unit Forecast, by Product Type 2020 & 2033
- Table 21: Global Quantum Sensors Industry Revenue Million Forecast, by Application 2020 & 2033
- Table 22: Global Quantum Sensors Industry Volume K Unit Forecast, by Application 2020 & 2033
- Table 23: Global Quantum Sensors Industry Revenue Million Forecast, by Country 2020 & 2033
- Table 24: Global Quantum Sensors Industry Volume K Unit Forecast, by Country 2020 & 2033
- Table 25: Germany Quantum Sensors Industry Revenue (Million) Forecast, by Application 2020 & 2033
- Table 26: Germany Quantum Sensors Industry Volume (K Unit) Forecast, by Application 2020 & 2033
- Table 27: United Kingdom Quantum Sensors Industry Revenue (Million) Forecast, by Application 2020 & 2033
- Table 28: United Kingdom Quantum Sensors Industry Volume (K Unit) Forecast, by Application 2020 & 2033
- Table 29: France Quantum Sensors Industry Revenue (Million) Forecast, by Application 2020 & 2033
- Table 30: France Quantum Sensors Industry Volume (K Unit) Forecast, by Application 2020 & 2033
- Table 31: Italy Quantum Sensors Industry Revenue (Million) Forecast, by Application 2020 & 2033
- Table 32: Italy Quantum Sensors Industry Volume (K Unit) Forecast, by Application 2020 & 2033
- Table 33: Spain Quantum Sensors Industry Revenue (Million) Forecast, by Application 2020 & 2033
- Table 34: Spain Quantum Sensors Industry Volume (K Unit) Forecast, by Application 2020 & 2033
- Table 35: Rest of Europe Quantum Sensors Industry Revenue (Million) Forecast, by Application 2020 & 2033
- Table 36: Rest of Europe Quantum Sensors Industry Volume (K Unit) Forecast, by Application 2020 & 2033
- Table 37: Global Quantum Sensors Industry Revenue Million Forecast, by Product Type 2020 & 2033
- Table 38: Global Quantum Sensors Industry Volume K Unit Forecast, by Product Type 2020 & 2033
- Table 39: Global Quantum Sensors Industry Revenue Million Forecast, by Application 2020 & 2033
- Table 40: Global Quantum Sensors Industry Volume K Unit Forecast, by Application 2020 & 2033
- Table 41: Global Quantum Sensors Industry Revenue Million Forecast, by Country 2020 & 2033
- Table 42: Global Quantum Sensors Industry Volume K Unit Forecast, by Country 2020 & 2033
- Table 43: China Quantum Sensors Industry Revenue (Million) Forecast, by Application 2020 & 2033
- Table 44: China Quantum Sensors Industry Volume (K Unit) Forecast, by Application 2020 & 2033
- Table 45: Japan Quantum Sensors Industry Revenue (Million) Forecast, by Application 2020 & 2033
- Table 46: Japan Quantum Sensors Industry Volume (K Unit) Forecast, by Application 2020 & 2033
- Table 47: India Quantum Sensors Industry Revenue (Million) Forecast, by Application 2020 & 2033
- Table 48: India Quantum Sensors Industry Volume (K Unit) Forecast, by Application 2020 & 2033
- Table 49: Australia Quantum Sensors Industry Revenue (Million) Forecast, by Application 2020 & 2033
- Table 50: Australia Quantum Sensors Industry Volume (K Unit) Forecast, by Application 2020 & 2033
- Table 51: South Korea Quantum Sensors Industry Revenue (Million) Forecast, by Application 2020 & 2033
- Table 52: South Korea Quantum Sensors Industry Volume (K Unit) Forecast, by Application 2020 & 2033
- Table 53: Rest of Asia Pacific Quantum Sensors Industry Revenue (Million) Forecast, by Application 2020 & 2033
- Table 54: Rest of Asia Pacific Quantum Sensors Industry Volume (K Unit) Forecast, by Application 2020 & 2033
- Table 55: Global Quantum Sensors Industry Revenue Million Forecast, by Product Type 2020 & 2033
- Table 56: Global Quantum Sensors Industry Volume K Unit Forecast, by Product Type 2020 & 2033
- Table 57: Global Quantum Sensors Industry Revenue Million Forecast, by Application 2020 & 2033
- Table 58: Global Quantum Sensors Industry Volume K Unit Forecast, by Application 2020 & 2033
- Table 59: Global Quantum Sensors Industry Revenue Million Forecast, by Country 2020 & 2033
- Table 60: Global Quantum Sensors Industry Volume K Unit Forecast, by Country 2020 & 2033
- Table 61: UAE Quantum Sensors Industry Revenue (Million) Forecast, by Application 2020 & 2033
- Table 62: UAE Quantum Sensors Industry Volume (K Unit) Forecast, by Application 2020 & 2033
- Table 63: South Africa Quantum Sensors Industry Revenue (Million) Forecast, by Application 2020 & 2033
- Table 64: South Africa Quantum Sensors Industry Volume (K Unit) Forecast, by Application 2020 & 2033
- Table 65: Saudi Arabia Quantum Sensors Industry Revenue (Million) Forecast, by Application 2020 & 2033
- Table 66: Saudi Arabia Quantum Sensors Industry Volume (K Unit) Forecast, by Application 2020 & 2033
- Table 67: Rest Of MEA Quantum Sensors Industry Revenue (Million) Forecast, by Application 2020 & 2033
- Table 68: Rest Of MEA Quantum Sensors Industry Volume (K Unit) Forecast, by Application 2020 & 2033
- Table 69: Global Quantum Sensors Industry Revenue Million Forecast, by Product Type 2020 & 2033
- Table 70: Global Quantum Sensors Industry Volume K Unit Forecast, by Product Type 2020 & 2033
- Table 71: Global Quantum Sensors Industry Revenue Million Forecast, by Application 2020 & 2033
- Table 72: Global Quantum Sensors Industry Volume K Unit Forecast, by Application 2020 & 2033
- Table 73: Global Quantum Sensors Industry Revenue Million Forecast, by Country 2020 & 2033
- Table 74: Global Quantum Sensors Industry Volume K Unit Forecast, by Country 2020 & 2033
- Table 75: Brazil Quantum Sensors Industry Revenue (Million) Forecast, by Application 2020 & 2033
- Table 76: Brazil Quantum Sensors Industry Volume (K Unit) Forecast, by Application 2020 & 2033
- Table 77: Argentina Quantum Sensors Industry Revenue (Million) Forecast, by Application 2020 & 2033
- Table 78: Argentina Quantum Sensors Industry Volume (K Unit) Forecast, by Application 2020 & 2033
- Table 79: Rest of South America Quantum Sensors Industry Revenue (Million) Forecast, by Application 2020 & 2033
- Table 80: Rest of South America Quantum Sensors Industry Volume (K Unit) Forecast, by Application 2020 & 2033
Frequently Asked Questions
1. What is the projected Compound Annual Growth Rate (CAGR) of the Quantum Sensors Industry?
The projected CAGR is approximately 12.95%.
2. Which companies are prominent players in the Quantum Sensors Industry?
Key companies in the market include Campbell Scientific Ltd, LI-COR Inc, AOSense Inc, Muquans SAS, M Squared Lasers Limited, Skye Instruments Ltd, Robert Bosch GmbH, Apogee Instrument Inc.
3. What are the main segments of the Quantum Sensors Industry?
The market segments include Product Type, Application.
4. Can you provide details about the market size?
The market size is estimated to be USD 0.67 Million as of 2022.
5. What are some drivers contributing to market growth?
Increasing Research Activities in the Quantum Field; Increasing Investment in Space Communication.
6. What are the notable trends driving market growth?
Oil and Gas Industry to Grow Significantly.
7. Are there any restraints impacting market growth?
High Deployment and Maintenance Costs.
8. Can you provide examples of recent developments in the market?
April 2024: The US National Science Foundation invested USD 29 million to assist 18 teams of researchers at universities across the United States to explore quantum sensing. Each research team will receive around USD 2 million over four years to research quantum phenomena, such as entanglement, to create sensors to assist in things that would otherwise be impossible. Quantum sensors can enable experts to pinpoint infections inside individual cells and find subterranean mineral deposits.
9. What pricing options are available for accessing the report?
Pricing options include single-user, multi-user, and enterprise licenses priced at USD 4750, USD 5250, and USD 8750 respectively.
10. Is the market size provided in terms of value or volume?
The market size is provided in terms of value, measured in Million and volume, measured in K Unit.
11. Are there any specific market keywords associated with the report?
Yes, the market keyword associated with the report is "Quantum Sensors Industry," which aids in identifying and referencing the specific market segment covered.
12. How do I determine which pricing option suits my needs best?
The pricing options vary based on user requirements and access needs. Individual users may opt for single-user licenses, while businesses requiring broader access may choose multi-user or enterprise licenses for cost-effective access to the report.
13. Are there any additional resources or data provided in the Quantum Sensors Industry report?
While the report offers comprehensive insights, it's advisable to review the specific contents or supplementary materials provided to ascertain if additional resources or data are available.
14. How can I stay updated on further developments or reports in the Quantum Sensors Industry?
To stay informed about further developments, trends, and reports in the Quantum Sensors Industry, consider subscribing to industry newsletters, following relevant companies and organizations, or regularly checking reputable industry news sources and publications.
Methodology
Step 1 - Identification of Relevant Samples Size from Population Database


Step 2 - Approaches for Defining Global Market Size (Value, Volume* & Price*)

Note*: In applicable scenarios
Step 3 - Data Sources
Primary Research
- Web Analytics
- Survey Reports
- Research Institute
- Latest Research Reports
- Opinion Leaders
Secondary Research
- Annual Reports
- White Paper
- Latest Press Release
- Industry Association
- Paid Database
- Investor Presentations

Step 4 - Data Triangulation
Involves using different sources of information in order to increase the validity of a study
These sources are likely to be stakeholders in a program - participants, other researchers, program staff, other community members, and so on.
Then we put all data in single framework & apply various statistical tools to find out the dynamic on the market.
During the analysis stage, feedback from the stakeholder groups would be compared to determine areas of agreement as well as areas of divergence