
Key Insights
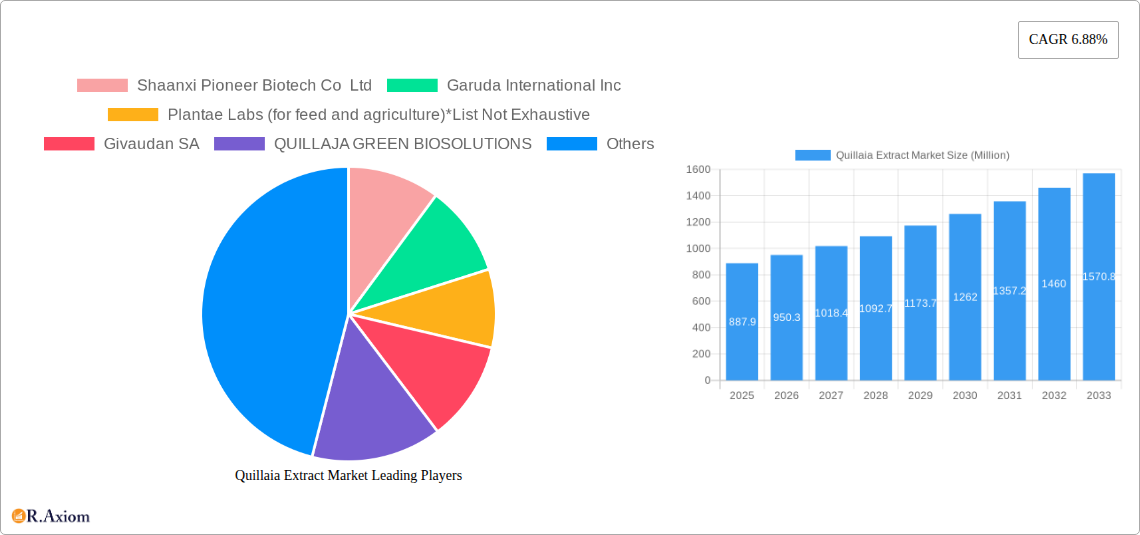
The Quillaia extract market, valued at $887.90 million in 2025, is projected to experience robust growth, exhibiting a compound annual growth rate (CAGR) of 6.88% from 2025 to 2033. This expansion is driven by the increasing demand for natural and sustainable ingredients across diverse sectors, particularly in the food and beverage, pharmaceutical, and personal care industries. The rising consumer preference for natural preservatives and emulsifiers, coupled with the unique saponin content of Quillaia extract offering excellent foaming and emulsifying properties, fuels market growth. Furthermore, the extract's applications in agriculture as a natural pesticide and in pharmaceuticals as an expectorant and adjuvant contribute significantly to the market's expansion. Growth is anticipated to be particularly strong in the Asia-Pacific region due to the growing population and rising disposable incomes, leading to increased consumption of food and beverage products containing natural ingredients. However, price volatility of raw materials and potential supply chain disruptions could act as restraints. The liquid form of Quillaia extract currently dominates the market, while the food and beverage application segment holds the largest market share. Key players, including Shaanxi Pioneer Biotech Co Ltd, Garuda International Inc, and Givaudan SA, are actively investing in research and development to enhance product quality and explore new applications, further stimulating market expansion. Competitive landscape is marked by both established players and emerging companies focusing on innovation and sustainable sourcing.
The market segmentation reveals significant opportunities within specific applications. The food and beverage sector's demand for natural emulsifiers and foaming agents is expected to drive considerable growth, followed by the pharmaceutical industry's use of Quillaia extract in formulations. The personal care and cosmetics sector also presents a promising avenue for growth, as consumers seek natural and sustainable alternatives. Geographical analysis indicates a significant market presence in North America and Europe, with strong growth potential in the Asia-Pacific region due to its expanding consumer base and increasing demand for natural products. Future growth hinges on technological advancements, sustainable sourcing practices, and successful penetration into new markets. Effective marketing strategies focusing on highlighting the unique benefits of Quillaia extract are crucial for driving adoption across various applications and regions.
Quillaia Extract Market: A Comprehensive Report (2019-2033)
This comprehensive report provides an in-depth analysis of the global Quillaia Extract market, offering valuable insights for stakeholders across the value chain. Covering the period 2019-2033, with 2025 as the base year, this study meticulously examines market dynamics, growth drivers, challenges, and opportunities, providing a robust forecast for the period 2025-2033.
Quillaia Extract Market Concentration & Innovation
The Quillaia Extract market exhibits a moderately concentrated landscape, with key players such as Ingredion Incorporated, Givaudan SA, and Shaanxi Pioneer Biotech Co Ltd holding significant market share. Precise market share figures are xx% , xx% and xx% respectively as of 2025. However, the market also features several smaller, specialized players, particularly in niche applications within the food and personal care sectors. Innovation in the Quillaia Extract market is driven by the increasing demand for natural and sustainable ingredients, alongside research into novel applications in pharmaceuticals and cosmetics. Regulatory frameworks, particularly those related to food safety and labeling, play a significant role in shaping market dynamics. Product substitutes, such as synthetic surfactants, exist; however, Quillaia Extract’s natural origin and unique properties provide a competitive advantage. End-user trends, such as the growing preference for clean-label products, further boost market growth. Mergers and acquisitions (M&A) activity, exemplified by Ingredion Incorporated's acquisition of Desert King in 2023 for an estimated value of xx Million USD, signifies consolidation and expansion within the industry. This deal significantly altered the market landscape, increasing Ingredion's presence in this space. Further M&A activities are anticipated in the coming years as larger corporations seek to expand their product portfolios and enhance their market share.
Quillaia Extract Market Industry Trends & Insights
The global Quillaia Extract market is experiencing robust growth, driven by escalating demand across various applications. The Compound Annual Growth Rate (CAGR) for the forecast period (2025-2033) is estimated at xx%. This growth is fueled by several key factors: the rising consumer preference for natural and sustainable products in food, beverages, personal care, and pharmaceuticals; technological advancements in extraction and purification methods, leading to higher-quality and more standardized products; and increasing research and development activities focusing on new applications and functionalities of Quillaia Extract. Market penetration is steadily increasing, particularly in developing economies where the demand for affordable and effective natural ingredients is high. Competitive dynamics are characterized by both intense competition among established players and the emergence of new entrants, especially in the sustainable agriculture sector. However, price fluctuations in raw materials and potential supply chain disruptions pose challenges to consistent market growth.

Dominant Markets & Segments in Quillaia Extract Market
The Quillaia Extract market showcases significant regional variations in its dominance, with North America (especially the United States) currently leading in terms of market share, holding approximately xx% of the global market. This dominance is primarily driven by high consumer demand for natural ingredients, robust regulatory frameworks supporting the use of natural extracts, and a well-established food and beverage industry.
Key Drivers of North American Dominance:
- Strong consumer preference for natural and clean-label products.
- Advanced technological infrastructure supporting efficient extraction and processing.
- Well-developed supply chains for the distribution of Quillaia Extract.
- Favorable regulatory environment promoting the use of natural ingredients.
Segment Analysis: Within the market segmentation by form, the powder segment holds a larger market share than the liquid segment, mainly due to its ease of handling, storage, and transportation. In terms of application, the food and beverage industry is currently the largest segment, followed by the personal care and cosmetics industry. The pharmaceutical segment shows significant growth potential, owing to the increasing demand for natural alternatives in drug formulations.
Europe and Asia-Pacific are also experiencing substantial growth, driven by increasing awareness of the health and cosmetic benefits of natural ingredients.
Quillaia Extract Market Product Developments
Recent product innovations have focused on developing higher-purity Quillaia Extract with improved functionality and enhanced stability. Technological advancements in extraction processes, like supercritical CO2 extraction, are enabling the production of superior-quality products. The development of specialized formulations tailored for specific applications in food, cosmetics, and pharmaceuticals, are expanding market opportunities. Companies are focusing on offering value-added products with improved performance and longer shelf life, further enhancing their competitive advantage.
Report Scope & Segmentation Analysis
This report comprehensively segments the Quillaia Extract market by form (Liquid, Powder) and application (Food, Beverage, Pharmaceutical, Personal Care and Cosmetics, Others).
By Form: The liquid segment is projected to grow at xx% CAGR during the forecast period, driven by its suitability in certain applications. The powder segment, however, is expected to maintain a larger market share due to ease of use and transport. Competitive dynamics within each segment depend on factors such as product purity, pricing, and supply chain efficiency.
By Application: The food and beverage segment is anticipated to remain the largest market, with growth fueled by increasing demand for clean-label products. Personal care and cosmetics are showing robust growth, driven by the rising popularity of natural ingredients. The pharmaceutical sector is poised for substantial growth, while the ‘Others’ segment includes smaller niche applications.
Key Drivers of Quillaia Extract Market Growth
The Quillaia Extract market's growth is propelled by several key factors. The rising global demand for natural and sustainable ingredients across diverse industries is a major driver. Technological advancements in extraction and purification methods improve product quality and consistency, while stringent regulatory frameworks mandating the use of natural ingredients in food and personal care products enhance market growth. The increasing prevalence of health-conscious consumers, combined with favorable economic conditions in several regions, is also contributing to expansion.
Challenges in the Quillaia Extract Market Sector
The Quillaia Extract market faces challenges such as price volatility of raw materials, impacting profitability. Supply chain disruptions due to climatic changes or geopolitical events pose significant risks. Intense competition among numerous players, especially in the food and beverage segments, necessitates continuous innovation and efficient cost management. Regulatory hurdles in different regions might impede market penetration. These combined factors have a considerable impact on the market's overall growth and sustainability.
Emerging Opportunities in Quillaia Extract Market
Emerging opportunities lie in the expansion into new geographic markets, particularly developing economies with growing demand for natural ingredients. The exploration of novel applications in areas such as nutraceuticals and biopharmaceuticals presents significant growth potential. Technological advancements in sustainable agriculture practices, like enhanced cultivation techniques, are also enhancing supply chain sustainability. The development of innovative formulations with improved stability and performance for specific applications further expands market opportunities.
Leading Players in the Quillaia Extract Market Market
- Shaanxi Pioneer Biotech Co Ltd
- Garuda International Inc
- Plantae Labs (for feed and agriculture)
- Givaudan SA
- QUILLAJA GREEN BIOSOLUTIONS
- Desert King
- Ingredion Incorporated
- Baja Yucca Company
- Brenntag AG
- StanChem, Inc.
Key Developments in Quillaia Extract Market Industry
- 2023: Acquisition of Desert King by Ingredion Incorporated.
- 2023: Partnership between Shaanxi Pioneer Biotech and Plantae Labs for joint R&D.
- 2023 onwards: Expansion of cultivation areas in Chile and Peru by QUILLAJA GREEN BIOSOLUTIONS.
These developments significantly shape the competitive landscape and technological advancements within the Quillaia Extract market.
Strategic Outlook for Quillaia Extract Market Market
The Quillaia Extract market is poised for continued expansion, driven by increasing demand across various sectors. Further innovation in extraction technologies and product formulations will be key to sustaining growth. Strategic partnerships and collaborations amongst industry players are expected to accelerate market penetration and enhance product offerings. The focus on sustainable sourcing and environmentally friendly production practices will play a crucial role in the market's future trajectory. Expansion into emerging markets and exploration of novel applications will further unlock growth opportunities. The market's future success rests on leveraging these catalysts and adapting to evolving consumer preferences and regulatory landscapes.
Quillaia Extract Market Segmentation
-
1. Form
- 1.1. Liquid
- 1.2. Powder
-
2. Application
-
2.1. Food
- 2.1.1. Bakery
- 2.1.2. Confectionary
- 2.1.3. Dairy
- 2.1.4. Others
-
2.2. Beverage
- 2.2.1. Alcholic
- 2.2.2. Non-Alcholic
- 2.3. Pharamceutical
- 2.4. Personal Care and Cosmetics
-
2.1. Food
Quillaia Extract Market Segmentation By Geography
-
1. North America
- 1.1. United States
- 1.2. Canada
- 1.3. Mexico
- 1.4. Rest of North America
-
2. Europe
- 2.1. Germany
- 2.2. United Kingdom
- 2.3. France
- 2.4. Italy
- 2.5. Russia
- 2.6. Spain
- 2.7. Rest of Europe
-
3. Asia Pacific
- 3.1. China
- 3.2. Japan
- 3.3. India
- 3.4. Australia
- 3.5. Rest of Asia Pacific
-
4. Rest of the World
- 4.1. South America
- 4.2. Middle East and Africa

Quillaia Extract Market REPORT HIGHLIGHTS
| Aspects | Details |
|---|---|
| Study Period | 2019-2033 |
| Base Year | 2024 |
| Estimated Year | 2025 |
| Forecast Period | 2025-2033 |
| Historical Period | 2019-2024 |
| Growth Rate | CAGR of 6.88% from 2019-2033 |
| Segmentation |
|
Table of Contents
- 1. Introduction
- 1.1. Research Scope
- 1.2. Market Segmentation
- 1.3. Research Methodology
- 1.4. Definitions and Assumptions
- 2. Executive Summary
- 2.1. Introduction
- 3. Market Dynamics
- 3.1. Introduction
- 3.2. Market Drivers
- 3.2.1. Increasing application of Gelatin in healthcare and pharmaceutical sector
- 3.3. Market Restrains
- 3.3.1. Rising demand for clean label products
- 3.4. Market Trends
- 3.4.1. Role of Specialty Food Ingredients in Processed Food Industry
- 4. Market Factor Analysis
- 4.1. Porters Five Forces
- 4.2. Supply/Value Chain
- 4.3. PESTEL analysis
- 4.4. Market Entropy
- 4.5. Patent/Trademark Analysis
- 5. Global Quillaia Extract Market Analysis, Insights and Forecast, 2019-2031
- 5.1. Market Analysis, Insights and Forecast - by Form
- 5.1.1. Liquid
- 5.1.2. Powder
- 5.2. Market Analysis, Insights and Forecast - by Application
- 5.2.1. Food
- 5.2.1.1. Bakery
- 5.2.1.2. Confectionary
- 5.2.1.3. Dairy
- 5.2.1.4. Others
- 5.2.2. Beverage
- 5.2.2.1. Alcholic
- 5.2.2.2. Non-Alcholic
- 5.2.3. Pharamceutical
- 5.2.4. Personal Care and Cosmetics
- 5.2.1. Food
- 5.3. Market Analysis, Insights and Forecast - by Region
- 5.3.1. North America
- 5.3.2. Europe
- 5.3.3. Asia Pacific
- 5.3.4. Rest of the World
- 5.1. Market Analysis, Insights and Forecast - by Form
- 6. North America Quillaia Extract Market Analysis, Insights and Forecast, 2019-2031
- 6.1. Market Analysis, Insights and Forecast - by Form
- 6.1.1. Liquid
- 6.1.2. Powder
- 6.2. Market Analysis, Insights and Forecast - by Application
- 6.2.1. Food
- 6.2.1.1. Bakery
- 6.2.1.2. Confectionary
- 6.2.1.3. Dairy
- 6.2.1.4. Others
- 6.2.2. Beverage
- 6.2.2.1. Alcholic
- 6.2.2.2. Non-Alcholic
- 6.2.3. Pharamceutical
- 6.2.4. Personal Care and Cosmetics
- 6.2.1. Food
- 6.1. Market Analysis, Insights and Forecast - by Form
- 7. Europe Quillaia Extract Market Analysis, Insights and Forecast, 2019-2031
- 7.1. Market Analysis, Insights and Forecast - by Form
- 7.1.1. Liquid
- 7.1.2. Powder
- 7.2. Market Analysis, Insights and Forecast - by Application
- 7.2.1. Food
- 7.2.1.1. Bakery
- 7.2.1.2. Confectionary
- 7.2.1.3. Dairy
- 7.2.1.4. Others
- 7.2.2. Beverage
- 7.2.2.1. Alcholic
- 7.2.2.2. Non-Alcholic
- 7.2.3. Pharamceutical
- 7.2.4. Personal Care and Cosmetics
- 7.2.1. Food
- 7.1. Market Analysis, Insights and Forecast - by Form
- 8. Asia Pacific Quillaia Extract Market Analysis, Insights and Forecast, 2019-2031
- 8.1. Market Analysis, Insights and Forecast - by Form
- 8.1.1. Liquid
- 8.1.2. Powder
- 8.2. Market Analysis, Insights and Forecast - by Application
- 8.2.1. Food
- 8.2.1.1. Bakery
- 8.2.1.2. Confectionary
- 8.2.1.3. Dairy
- 8.2.1.4. Others
- 8.2.2. Beverage
- 8.2.2.1. Alcholic
- 8.2.2.2. Non-Alcholic
- 8.2.3. Pharamceutical
- 8.2.4. Personal Care and Cosmetics
- 8.2.1. Food
- 8.1. Market Analysis, Insights and Forecast - by Form
- 9. Rest of the World Quillaia Extract Market Analysis, Insights and Forecast, 2019-2031
- 9.1. Market Analysis, Insights and Forecast - by Form
- 9.1.1. Liquid
- 9.1.2. Powder
- 9.2. Market Analysis, Insights and Forecast - by Application
- 9.2.1. Food
- 9.2.1.1. Bakery
- 9.2.1.2. Confectionary
- 9.2.1.3. Dairy
- 9.2.1.4. Others
- 9.2.2. Beverage
- 9.2.2.1. Alcholic
- 9.2.2.2. Non-Alcholic
- 9.2.3. Pharamceutical
- 9.2.4. Personal Care and Cosmetics
- 9.2.1. Food
- 9.1. Market Analysis, Insights and Forecast - by Form
- 10. North America Quillaia Extract Market Analysis, Insights and Forecast, 2019-2031
- 10.1. Market Analysis, Insights and Forecast - By Country/Sub-region
- 10.1.1 United States
- 10.1.2 Canada
- 10.1.3 Mexico
- 11. Europe Quillaia Extract Market Analysis, Insights and Forecast, 2019-2031
- 11.1. Market Analysis, Insights and Forecast - By Country/Sub-region
- 11.1.1 Germany
- 11.1.2 United Kingdom
- 11.1.3 France
- 11.1.4 Spain
- 11.1.5 Italy
- 11.1.6 Spain
- 11.1.7 Belgium
- 11.1.8 Netherland
- 11.1.9 Nordics
- 11.1.10 Rest of Europe
- 12. Asia Pacific Quillaia Extract Market Analysis, Insights and Forecast, 2019-2031
- 12.1. Market Analysis, Insights and Forecast - By Country/Sub-region
- 12.1.1 China
- 12.1.2 Japan
- 12.1.3 India
- 12.1.4 South Korea
- 12.1.5 Southeast Asia
- 12.1.6 Australia
- 12.1.7 Indonesia
- 12.1.8 Phillipes
- 12.1.9 Singapore
- 12.1.10 Thailandc
- 12.1.11 Rest of Asia Pacific
- 13. South America Quillaia Extract Market Analysis, Insights and Forecast, 2019-2031
- 13.1. Market Analysis, Insights and Forecast - By Country/Sub-region
- 13.1.1 Brazil
- 13.1.2 Argentina
- 13.1.3 Peru
- 13.1.4 Chile
- 13.1.5 Colombia
- 13.1.6 Ecuador
- 13.1.7 Venezuela
- 13.1.8 Rest of South America
- 14. North America Quillaia Extract Market Analysis, Insights and Forecast, 2019-2031
- 14.1. Market Analysis, Insights and Forecast - By Country/Sub-region
- 14.1.1 United States
- 14.1.2 Canada
- 14.1.3 Mexico
- 15. MEA Quillaia Extract Market Analysis, Insights and Forecast, 2019-2031
- 15.1. Market Analysis, Insights and Forecast - By Country/Sub-region
- 15.1.1 United Arab Emirates
- 15.1.2 Saudi Arabia
- 15.1.3 South Africa
- 15.1.4 Rest of Middle East and Africa
- 16. Competitive Analysis
- 16.1. Global Market Share Analysis 2024
- 16.2. Company Profiles
- 16.2.1 Shaanxi Pioneer Biotech Co Ltd
- 16.2.1.1. Overview
- 16.2.1.2. Products
- 16.2.1.3. SWOT Analysis
- 16.2.1.4. Recent Developments
- 16.2.1.5. Financials (Based on Availability)
- 16.2.2 Garuda International Inc
- 16.2.2.1. Overview
- 16.2.2.2. Products
- 16.2.2.3. SWOT Analysis
- 16.2.2.4. Recent Developments
- 16.2.2.5. Financials (Based on Availability)
- 16.2.3 Plantae Labs (for feed and agriculture)*List Not Exhaustive
- 16.2.3.1. Overview
- 16.2.3.2. Products
- 16.2.3.3. SWOT Analysis
- 16.2.3.4. Recent Developments
- 16.2.3.5. Financials (Based on Availability)
- 16.2.4 Givaudan SA
- 16.2.4.1. Overview
- 16.2.4.2. Products
- 16.2.4.3. SWOT Analysis
- 16.2.4.4. Recent Developments
- 16.2.4.5. Financials (Based on Availability)
- 16.2.5 QUILLAJA GREEN BIOSOLUTIONS
- 16.2.5.1. Overview
- 16.2.5.2. Products
- 16.2.5.3. SWOT Analysis
- 16.2.5.4. Recent Developments
- 16.2.5.5. Financials (Based on Availability)
- 16.2.6 Desert King
- 16.2.6.1. Overview
- 16.2.6.2. Products
- 16.2.6.3. SWOT Analysis
- 16.2.6.4. Recent Developments
- 16.2.6.5. Financials (Based on Availability)
- 16.2.7 Ingredion Incorporated
- 16.2.7.1. Overview
- 16.2.7.2. Products
- 16.2.7.3. SWOT Analysis
- 16.2.7.4. Recent Developments
- 16.2.7.5. Financials (Based on Availability)
- 16.2.8 Baja Yucca Company
- 16.2.8.1. Overview
- 16.2.8.2. Products
- 16.2.8.3. SWOT Analysis
- 16.2.8.4. Recent Developments
- 16.2.8.5. Financials (Based on Availability)
- 16.2.9 Brenntag AG
- 16.2.9.1. Overview
- 16.2.9.2. Products
- 16.2.9.3. SWOT Analysis
- 16.2.9.4. Recent Developments
- 16.2.9.5. Financials (Based on Availability)
- 16.2.10 StanChem Inc.
- 16.2.10.1. Overview
- 16.2.10.2. Products
- 16.2.10.3. SWOT Analysis
- 16.2.10.4. Recent Developments
- 16.2.10.5. Financials (Based on Availability)
- 16.2.1 Shaanxi Pioneer Biotech Co Ltd
List of Figures
- Figure 1: Global Quillaia Extract Market Revenue Breakdown (Million, %) by Region 2024 & 2032
- Figure 2: Global Quillaia Extract Market Volume Breakdown (K Tons, %) by Region 2024 & 2032
- Figure 3: North America Quillaia Extract Market Revenue (Million), by Country 2024 & 2032
- Figure 4: North America Quillaia Extract Market Volume (K Tons), by Country 2024 & 2032
- Figure 5: North America Quillaia Extract Market Revenue Share (%), by Country 2024 & 2032
- Figure 6: North America Quillaia Extract Market Volume Share (%), by Country 2024 & 2032
- Figure 7: Europe Quillaia Extract Market Revenue (Million), by Country 2024 & 2032
- Figure 8: Europe Quillaia Extract Market Volume (K Tons), by Country 2024 & 2032
- Figure 9: Europe Quillaia Extract Market Revenue Share (%), by Country 2024 & 2032
- Figure 10: Europe Quillaia Extract Market Volume Share (%), by Country 2024 & 2032
- Figure 11: Asia Pacific Quillaia Extract Market Revenue (Million), by Country 2024 & 2032
- Figure 12: Asia Pacific Quillaia Extract Market Volume (K Tons), by Country 2024 & 2032
- Figure 13: Asia Pacific Quillaia Extract Market Revenue Share (%), by Country 2024 & 2032
- Figure 14: Asia Pacific Quillaia Extract Market Volume Share (%), by Country 2024 & 2032
- Figure 15: South America Quillaia Extract Market Revenue (Million), by Country 2024 & 2032
- Figure 16: South America Quillaia Extract Market Volume (K Tons), by Country 2024 & 2032
- Figure 17: South America Quillaia Extract Market Revenue Share (%), by Country 2024 & 2032
- Figure 18: South America Quillaia Extract Market Volume Share (%), by Country 2024 & 2032
- Figure 19: North America Quillaia Extract Market Revenue (Million), by Country 2024 & 2032
- Figure 20: North America Quillaia Extract Market Volume (K Tons), by Country 2024 & 2032
- Figure 21: North America Quillaia Extract Market Revenue Share (%), by Country 2024 & 2032
- Figure 22: North America Quillaia Extract Market Volume Share (%), by Country 2024 & 2032
- Figure 23: MEA Quillaia Extract Market Revenue (Million), by Country 2024 & 2032
- Figure 24: MEA Quillaia Extract Market Volume (K Tons), by Country 2024 & 2032
- Figure 25: MEA Quillaia Extract Market Revenue Share (%), by Country 2024 & 2032
- Figure 26: MEA Quillaia Extract Market Volume Share (%), by Country 2024 & 2032
- Figure 27: North America Quillaia Extract Market Revenue (Million), by Form 2024 & 2032
- Figure 28: North America Quillaia Extract Market Volume (K Tons), by Form 2024 & 2032
- Figure 29: North America Quillaia Extract Market Revenue Share (%), by Form 2024 & 2032
- Figure 30: North America Quillaia Extract Market Volume Share (%), by Form 2024 & 2032
- Figure 31: North America Quillaia Extract Market Revenue (Million), by Application 2024 & 2032
- Figure 32: North America Quillaia Extract Market Volume (K Tons), by Application 2024 & 2032
- Figure 33: North America Quillaia Extract Market Revenue Share (%), by Application 2024 & 2032
- Figure 34: North America Quillaia Extract Market Volume Share (%), by Application 2024 & 2032
- Figure 35: North America Quillaia Extract Market Revenue (Million), by Country 2024 & 2032
- Figure 36: North America Quillaia Extract Market Volume (K Tons), by Country 2024 & 2032
- Figure 37: North America Quillaia Extract Market Revenue Share (%), by Country 2024 & 2032
- Figure 38: North America Quillaia Extract Market Volume Share (%), by Country 2024 & 2032
- Figure 39: Europe Quillaia Extract Market Revenue (Million), by Form 2024 & 2032
- Figure 40: Europe Quillaia Extract Market Volume (K Tons), by Form 2024 & 2032
- Figure 41: Europe Quillaia Extract Market Revenue Share (%), by Form 2024 & 2032
- Figure 42: Europe Quillaia Extract Market Volume Share (%), by Form 2024 & 2032
- Figure 43: Europe Quillaia Extract Market Revenue (Million), by Application 2024 & 2032
- Figure 44: Europe Quillaia Extract Market Volume (K Tons), by Application 2024 & 2032
- Figure 45: Europe Quillaia Extract Market Revenue Share (%), by Application 2024 & 2032
- Figure 46: Europe Quillaia Extract Market Volume Share (%), by Application 2024 & 2032
- Figure 47: Europe Quillaia Extract Market Revenue (Million), by Country 2024 & 2032
- Figure 48: Europe Quillaia Extract Market Volume (K Tons), by Country 2024 & 2032
- Figure 49: Europe Quillaia Extract Market Revenue Share (%), by Country 2024 & 2032
- Figure 50: Europe Quillaia Extract Market Volume Share (%), by Country 2024 & 2032
- Figure 51: Asia Pacific Quillaia Extract Market Revenue (Million), by Form 2024 & 2032
- Figure 52: Asia Pacific Quillaia Extract Market Volume (K Tons), by Form 2024 & 2032
- Figure 53: Asia Pacific Quillaia Extract Market Revenue Share (%), by Form 2024 & 2032
- Figure 54: Asia Pacific Quillaia Extract Market Volume Share (%), by Form 2024 & 2032
- Figure 55: Asia Pacific Quillaia Extract Market Revenue (Million), by Application 2024 & 2032
- Figure 56: Asia Pacific Quillaia Extract Market Volume (K Tons), by Application 2024 & 2032
- Figure 57: Asia Pacific Quillaia Extract Market Revenue Share (%), by Application 2024 & 2032
- Figure 58: Asia Pacific Quillaia Extract Market Volume Share (%), by Application 2024 & 2032
- Figure 59: Asia Pacific Quillaia Extract Market Revenue (Million), by Country 2024 & 2032
- Figure 60: Asia Pacific Quillaia Extract Market Volume (K Tons), by Country 2024 & 2032
- Figure 61: Asia Pacific Quillaia Extract Market Revenue Share (%), by Country 2024 & 2032
- Figure 62: Asia Pacific Quillaia Extract Market Volume Share (%), by Country 2024 & 2032
- Figure 63: Rest of the World Quillaia Extract Market Revenue (Million), by Form 2024 & 2032
- Figure 64: Rest of the World Quillaia Extract Market Volume (K Tons), by Form 2024 & 2032
- Figure 65: Rest of the World Quillaia Extract Market Revenue Share (%), by Form 2024 & 2032
- Figure 66: Rest of the World Quillaia Extract Market Volume Share (%), by Form 2024 & 2032
- Figure 67: Rest of the World Quillaia Extract Market Revenue (Million), by Application 2024 & 2032
- Figure 68: Rest of the World Quillaia Extract Market Volume (K Tons), by Application 2024 & 2032
- Figure 69: Rest of the World Quillaia Extract Market Revenue Share (%), by Application 2024 & 2032
- Figure 70: Rest of the World Quillaia Extract Market Volume Share (%), by Application 2024 & 2032
- Figure 71: Rest of the World Quillaia Extract Market Revenue (Million), by Country 2024 & 2032
- Figure 72: Rest of the World Quillaia Extract Market Volume (K Tons), by Country 2024 & 2032
- Figure 73: Rest of the World Quillaia Extract Market Revenue Share (%), by Country 2024 & 2032
- Figure 74: Rest of the World Quillaia Extract Market Volume Share (%), by Country 2024 & 2032
List of Tables
- Table 1: Global Quillaia Extract Market Revenue Million Forecast, by Region 2019 & 2032
- Table 2: Global Quillaia Extract Market Volume K Tons Forecast, by Region 2019 & 2032
- Table 3: Global Quillaia Extract Market Revenue Million Forecast, by Form 2019 & 2032
- Table 4: Global Quillaia Extract Market Volume K Tons Forecast, by Form 2019 & 2032
- Table 5: Global Quillaia Extract Market Revenue Million Forecast, by Application 2019 & 2032
- Table 6: Global Quillaia Extract Market Volume K Tons Forecast, by Application 2019 & 2032
- Table 7: Global Quillaia Extract Market Revenue Million Forecast, by Region 2019 & 2032
- Table 8: Global Quillaia Extract Market Volume K Tons Forecast, by Region 2019 & 2032
- Table 9: Global Quillaia Extract Market Revenue Million Forecast, by Country 2019 & 2032
- Table 10: Global Quillaia Extract Market Volume K Tons Forecast, by Country 2019 & 2032
- Table 11: United States Quillaia Extract Market Revenue (Million) Forecast, by Application 2019 & 2032
- Table 12: United States Quillaia Extract Market Volume (K Tons) Forecast, by Application 2019 & 2032
- Table 13: Canada Quillaia Extract Market Revenue (Million) Forecast, by Application 2019 & 2032
- Table 14: Canada Quillaia Extract Market Volume (K Tons) Forecast, by Application 2019 & 2032
- Table 15: Mexico Quillaia Extract Market Revenue (Million) Forecast, by Application 2019 & 2032
- Table 16: Mexico Quillaia Extract Market Volume (K Tons) Forecast, by Application 2019 & 2032
- Table 17: Global Quillaia Extract Market Revenue Million Forecast, by Country 2019 & 2032
- Table 18: Global Quillaia Extract Market Volume K Tons Forecast, by Country 2019 & 2032
- Table 19: Germany Quillaia Extract Market Revenue (Million) Forecast, by Application 2019 & 2032
- Table 20: Germany Quillaia Extract Market Volume (K Tons) Forecast, by Application 2019 & 2032
- Table 21: United Kingdom Quillaia Extract Market Revenue (Million) Forecast, by Application 2019 & 2032
- Table 22: United Kingdom Quillaia Extract Market Volume (K Tons) Forecast, by Application 2019 & 2032
- Table 23: France Quillaia Extract Market Revenue (Million) Forecast, by Application 2019 & 2032
- Table 24: France Quillaia Extract Market Volume (K Tons) Forecast, by Application 2019 & 2032
- Table 25: Spain Quillaia Extract Market Revenue (Million) Forecast, by Application 2019 & 2032
- Table 26: Spain Quillaia Extract Market Volume (K Tons) Forecast, by Application 2019 & 2032
- Table 27: Italy Quillaia Extract Market Revenue (Million) Forecast, by Application 2019 & 2032
- Table 28: Italy Quillaia Extract Market Volume (K Tons) Forecast, by Application 2019 & 2032
- Table 29: Spain Quillaia Extract Market Revenue (Million) Forecast, by Application 2019 & 2032
- Table 30: Spain Quillaia Extract Market Volume (K Tons) Forecast, by Application 2019 & 2032
- Table 31: Belgium Quillaia Extract Market Revenue (Million) Forecast, by Application 2019 & 2032
- Table 32: Belgium Quillaia Extract Market Volume (K Tons) Forecast, by Application 2019 & 2032
- Table 33: Netherland Quillaia Extract Market Revenue (Million) Forecast, by Application 2019 & 2032
- Table 34: Netherland Quillaia Extract Market Volume (K Tons) Forecast, by Application 2019 & 2032
- Table 35: Nordics Quillaia Extract Market Revenue (Million) Forecast, by Application 2019 & 2032
- Table 36: Nordics Quillaia Extract Market Volume (K Tons) Forecast, by Application 2019 & 2032
- Table 37: Rest of Europe Quillaia Extract Market Revenue (Million) Forecast, by Application 2019 & 2032
- Table 38: Rest of Europe Quillaia Extract Market Volume (K Tons) Forecast, by Application 2019 & 2032
- Table 39: Global Quillaia Extract Market Revenue Million Forecast, by Country 2019 & 2032
- Table 40: Global Quillaia Extract Market Volume K Tons Forecast, by Country 2019 & 2032
- Table 41: China Quillaia Extract Market Revenue (Million) Forecast, by Application 2019 & 2032
- Table 42: China Quillaia Extract Market Volume (K Tons) Forecast, by Application 2019 & 2032
- Table 43: Japan Quillaia Extract Market Revenue (Million) Forecast, by Application 2019 & 2032
- Table 44: Japan Quillaia Extract Market Volume (K Tons) Forecast, by Application 2019 & 2032
- Table 45: India Quillaia Extract Market Revenue (Million) Forecast, by Application 2019 & 2032
- Table 46: India Quillaia Extract Market Volume (K Tons) Forecast, by Application 2019 & 2032
- Table 47: South Korea Quillaia Extract Market Revenue (Million) Forecast, by Application 2019 & 2032
- Table 48: South Korea Quillaia Extract Market Volume (K Tons) Forecast, by Application 2019 & 2032
- Table 49: Southeast Asia Quillaia Extract Market Revenue (Million) Forecast, by Application 2019 & 2032
- Table 50: Southeast Asia Quillaia Extract Market Volume (K Tons) Forecast, by Application 2019 & 2032
- Table 51: Australia Quillaia Extract Market Revenue (Million) Forecast, by Application 2019 & 2032
- Table 52: Australia Quillaia Extract Market Volume (K Tons) Forecast, by Application 2019 & 2032
- Table 53: Indonesia Quillaia Extract Market Revenue (Million) Forecast, by Application 2019 & 2032
- Table 54: Indonesia Quillaia Extract Market Volume (K Tons) Forecast, by Application 2019 & 2032
- Table 55: Phillipes Quillaia Extract Market Revenue (Million) Forecast, by Application 2019 & 2032
- Table 56: Phillipes Quillaia Extract Market Volume (K Tons) Forecast, by Application 2019 & 2032
- Table 57: Singapore Quillaia Extract Market Revenue (Million) Forecast, by Application 2019 & 2032
- Table 58: Singapore Quillaia Extract Market Volume (K Tons) Forecast, by Application 2019 & 2032
- Table 59: Thailandc Quillaia Extract Market Revenue (Million) Forecast, by Application 2019 & 2032
- Table 60: Thailandc Quillaia Extract Market Volume (K Tons) Forecast, by Application 2019 & 2032
- Table 61: Rest of Asia Pacific Quillaia Extract Market Revenue (Million) Forecast, by Application 2019 & 2032
- Table 62: Rest of Asia Pacific Quillaia Extract Market Volume (K Tons) Forecast, by Application 2019 & 2032
- Table 63: Global Quillaia Extract Market Revenue Million Forecast, by Country 2019 & 2032
- Table 64: Global Quillaia Extract Market Volume K Tons Forecast, by Country 2019 & 2032
- Table 65: Brazil Quillaia Extract Market Revenue (Million) Forecast, by Application 2019 & 2032
- Table 66: Brazil Quillaia Extract Market Volume (K Tons) Forecast, by Application 2019 & 2032
- Table 67: Argentina Quillaia Extract Market Revenue (Million) Forecast, by Application 2019 & 2032
- Table 68: Argentina Quillaia Extract Market Volume (K Tons) Forecast, by Application 2019 & 2032
- Table 69: Peru Quillaia Extract Market Revenue (Million) Forecast, by Application 2019 & 2032
- Table 70: Peru Quillaia Extract Market Volume (K Tons) Forecast, by Application 2019 & 2032
- Table 71: Chile Quillaia Extract Market Revenue (Million) Forecast, by Application 2019 & 2032
- Table 72: Chile Quillaia Extract Market Volume (K Tons) Forecast, by Application 2019 & 2032
- Table 73: Colombia Quillaia Extract Market Revenue (Million) Forecast, by Application 2019 & 2032
- Table 74: Colombia Quillaia Extract Market Volume (K Tons) Forecast, by Application 2019 & 2032
- Table 75: Ecuador Quillaia Extract Market Revenue (Million) Forecast, by Application 2019 & 2032
- Table 76: Ecuador Quillaia Extract Market Volume (K Tons) Forecast, by Application 2019 & 2032
- Table 77: Venezuela Quillaia Extract Market Revenue (Million) Forecast, by Application 2019 & 2032
- Table 78: Venezuela Quillaia Extract Market Volume (K Tons) Forecast, by Application 2019 & 2032
- Table 79: Rest of South America Quillaia Extract Market Revenue (Million) Forecast, by Application 2019 & 2032
- Table 80: Rest of South America Quillaia Extract Market Volume (K Tons) Forecast, by Application 2019 & 2032
- Table 81: Global Quillaia Extract Market Revenue Million Forecast, by Country 2019 & 2032
- Table 82: Global Quillaia Extract Market Volume K Tons Forecast, by Country 2019 & 2032
- Table 83: United States Quillaia Extract Market Revenue (Million) Forecast, by Application 2019 & 2032
- Table 84: United States Quillaia Extract Market Volume (K Tons) Forecast, by Application 2019 & 2032
- Table 85: Canada Quillaia Extract Market Revenue (Million) Forecast, by Application 2019 & 2032
- Table 86: Canada Quillaia Extract Market Volume (K Tons) Forecast, by Application 2019 & 2032
- Table 87: Mexico Quillaia Extract Market Revenue (Million) Forecast, by Application 2019 & 2032
- Table 88: Mexico Quillaia Extract Market Volume (K Tons) Forecast, by Application 2019 & 2032
- Table 89: Global Quillaia Extract Market Revenue Million Forecast, by Country 2019 & 2032
- Table 90: Global Quillaia Extract Market Volume K Tons Forecast, by Country 2019 & 2032
- Table 91: United Arab Emirates Quillaia Extract Market Revenue (Million) Forecast, by Application 2019 & 2032
- Table 92: United Arab Emirates Quillaia Extract Market Volume (K Tons) Forecast, by Application 2019 & 2032
- Table 93: Saudi Arabia Quillaia Extract Market Revenue (Million) Forecast, by Application 2019 & 2032
- Table 94: Saudi Arabia Quillaia Extract Market Volume (K Tons) Forecast, by Application 2019 & 2032
- Table 95: South Africa Quillaia Extract Market Revenue (Million) Forecast, by Application 2019 & 2032
- Table 96: South Africa Quillaia Extract Market Volume (K Tons) Forecast, by Application 2019 & 2032
- Table 97: Rest of Middle East and Africa Quillaia Extract Market Revenue (Million) Forecast, by Application 2019 & 2032
- Table 98: Rest of Middle East and Africa Quillaia Extract Market Volume (K Tons) Forecast, by Application 2019 & 2032
- Table 99: Global Quillaia Extract Market Revenue Million Forecast, by Form 2019 & 2032
- Table 100: Global Quillaia Extract Market Volume K Tons Forecast, by Form 2019 & 2032
- Table 101: Global Quillaia Extract Market Revenue Million Forecast, by Application 2019 & 2032
- Table 102: Global Quillaia Extract Market Volume K Tons Forecast, by Application 2019 & 2032
- Table 103: Global Quillaia Extract Market Revenue Million Forecast, by Country 2019 & 2032
- Table 104: Global Quillaia Extract Market Volume K Tons Forecast, by Country 2019 & 2032
- Table 105: United States Quillaia Extract Market Revenue (Million) Forecast, by Application 2019 & 2032
- Table 106: United States Quillaia Extract Market Volume (K Tons) Forecast, by Application 2019 & 2032
- Table 107: Canada Quillaia Extract Market Revenue (Million) Forecast, by Application 2019 & 2032
- Table 108: Canada Quillaia Extract Market Volume (K Tons) Forecast, by Application 2019 & 2032
- Table 109: Mexico Quillaia Extract Market Revenue (Million) Forecast, by Application 2019 & 2032
- Table 110: Mexico Quillaia Extract Market Volume (K Tons) Forecast, by Application 2019 & 2032
- Table 111: Rest of North America Quillaia Extract Market Revenue (Million) Forecast, by Application 2019 & 2032
- Table 112: Rest of North America Quillaia Extract Market Volume (K Tons) Forecast, by Application 2019 & 2032
- Table 113: Global Quillaia Extract Market Revenue Million Forecast, by Form 2019 & 2032
- Table 114: Global Quillaia Extract Market Volume K Tons Forecast, by Form 2019 & 2032
- Table 115: Global Quillaia Extract Market Revenue Million Forecast, by Application 2019 & 2032
- Table 116: Global Quillaia Extract Market Volume K Tons Forecast, by Application 2019 & 2032
- Table 117: Global Quillaia Extract Market Revenue Million Forecast, by Country 2019 & 2032
- Table 118: Global Quillaia Extract Market Volume K Tons Forecast, by Country 2019 & 2032
- Table 119: Germany Quillaia Extract Market Revenue (Million) Forecast, by Application 2019 & 2032
- Table 120: Germany Quillaia Extract Market Volume (K Tons) Forecast, by Application 2019 & 2032
- Table 121: United Kingdom Quillaia Extract Market Revenue (Million) Forecast, by Application 2019 & 2032
- Table 122: United Kingdom Quillaia Extract Market Volume (K Tons) Forecast, by Application 2019 & 2032
- Table 123: France Quillaia Extract Market Revenue (Million) Forecast, by Application 2019 & 2032
- Table 124: France Quillaia Extract Market Volume (K Tons) Forecast, by Application 2019 & 2032
- Table 125: Italy Quillaia Extract Market Revenue (Million) Forecast, by Application 2019 & 2032
- Table 126: Italy Quillaia Extract Market Volume (K Tons) Forecast, by Application 2019 & 2032
- Table 127: Russia Quillaia Extract Market Revenue (Million) Forecast, by Application 2019 & 2032
- Table 128: Russia Quillaia Extract Market Volume (K Tons) Forecast, by Application 2019 & 2032
- Table 129: Spain Quillaia Extract Market Revenue (Million) Forecast, by Application 2019 & 2032
- Table 130: Spain Quillaia Extract Market Volume (K Tons) Forecast, by Application 2019 & 2032
- Table 131: Rest of Europe Quillaia Extract Market Revenue (Million) Forecast, by Application 2019 & 2032
- Table 132: Rest of Europe Quillaia Extract Market Volume (K Tons) Forecast, by Application 2019 & 2032
- Table 133: Global Quillaia Extract Market Revenue Million Forecast, by Form 2019 & 2032
- Table 134: Global Quillaia Extract Market Volume K Tons Forecast, by Form 2019 & 2032
- Table 135: Global Quillaia Extract Market Revenue Million Forecast, by Application 2019 & 2032
- Table 136: Global Quillaia Extract Market Volume K Tons Forecast, by Application 2019 & 2032
- Table 137: Global Quillaia Extract Market Revenue Million Forecast, by Country 2019 & 2032
- Table 138: Global Quillaia Extract Market Volume K Tons Forecast, by Country 2019 & 2032
- Table 139: China Quillaia Extract Market Revenue (Million) Forecast, by Application 2019 & 2032
- Table 140: China Quillaia Extract Market Volume (K Tons) Forecast, by Application 2019 & 2032
- Table 141: Japan Quillaia Extract Market Revenue (Million) Forecast, by Application 2019 & 2032
- Table 142: Japan Quillaia Extract Market Volume (K Tons) Forecast, by Application 2019 & 2032
- Table 143: India Quillaia Extract Market Revenue (Million) Forecast, by Application 2019 & 2032
- Table 144: India Quillaia Extract Market Volume (K Tons) Forecast, by Application 2019 & 2032
- Table 145: Australia Quillaia Extract Market Revenue (Million) Forecast, by Application 2019 & 2032
- Table 146: Australia Quillaia Extract Market Volume (K Tons) Forecast, by Application 2019 & 2032
- Table 147: Rest of Asia Pacific Quillaia Extract Market Revenue (Million) Forecast, by Application 2019 & 2032
- Table 148: Rest of Asia Pacific Quillaia Extract Market Volume (K Tons) Forecast, by Application 2019 & 2032
- Table 149: Global Quillaia Extract Market Revenue Million Forecast, by Form 2019 & 2032
- Table 150: Global Quillaia Extract Market Volume K Tons Forecast, by Form 2019 & 2032
- Table 151: Global Quillaia Extract Market Revenue Million Forecast, by Application 2019 & 2032
- Table 152: Global Quillaia Extract Market Volume K Tons Forecast, by Application 2019 & 2032
- Table 153: Global Quillaia Extract Market Revenue Million Forecast, by Country 2019 & 2032
- Table 154: Global Quillaia Extract Market Volume K Tons Forecast, by Country 2019 & 2032
- Table 155: South America Quillaia Extract Market Revenue (Million) Forecast, by Application 2019 & 2032
- Table 156: South America Quillaia Extract Market Volume (K Tons) Forecast, by Application 2019 & 2032
- Table 157: Middle East and Africa Quillaia Extract Market Revenue (Million) Forecast, by Application 2019 & 2032
- Table 158: Middle East and Africa Quillaia Extract Market Volume (K Tons) Forecast, by Application 2019 & 2032
Frequently Asked Questions
1. What is the projected Compound Annual Growth Rate (CAGR) of the Quillaia Extract Market?
The projected CAGR is approximately 6.88%.
2. Which companies are prominent players in the Quillaia Extract Market?
Key companies in the market include Shaanxi Pioneer Biotech Co Ltd, Garuda International Inc, Plantae Labs (for feed and agriculture)*List Not Exhaustive, Givaudan SA, QUILLAJA GREEN BIOSOLUTIONS, Desert King, Ingredion Incorporated, Baja Yucca Company, Brenntag AG , StanChem, Inc..
3. What are the main segments of the Quillaia Extract Market?
The market segments include Form, Application.
4. Can you provide details about the market size?
The market size is estimated to be USD 887.90 Million as of 2022.
5. What are some drivers contributing to market growth?
Increasing application of Gelatin in healthcare and pharmaceutical sector.
6. What are the notable trends driving market growth?
Role of Specialty Food Ingredients in Processed Food Industry.
7. Are there any restraints impacting market growth?
Rising demand for clean label products.
8. Can you provide examples of recent developments in the market?
Acquisition of Desert King by Ingredion Incorporated in 2023
9. What pricing options are available for accessing the report?
Pricing options include single-user, multi-user, and enterprise licenses priced at USD 4750, USD 5250, and USD 8750 respectively.
10. Is the market size provided in terms of value or volume?
The market size is provided in terms of value, measured in Million and volume, measured in K Tons.
11. Are there any specific market keywords associated with the report?
Yes, the market keyword associated with the report is "Quillaia Extract Market," which aids in identifying and referencing the specific market segment covered.
12. How do I determine which pricing option suits my needs best?
The pricing options vary based on user requirements and access needs. Individual users may opt for single-user licenses, while businesses requiring broader access may choose multi-user or enterprise licenses for cost-effective access to the report.
13. Are there any additional resources or data provided in the Quillaia Extract Market report?
While the report offers comprehensive insights, it's advisable to review the specific contents or supplementary materials provided to ascertain if additional resources or data are available.
14. How can I stay updated on further developments or reports in the Quillaia Extract Market?
To stay informed about further developments, trends, and reports in the Quillaia Extract Market, consider subscribing to industry newsletters, following relevant companies and organizations, or regularly checking reputable industry news sources and publications.
Methodology
Step 1 - Identification of Relevant Samples Size from Population Database


Step 2 - Approaches for Defining Global Market Size (Value, Volume* & Price*)

Note*: In applicable scenarios
Step 3 - Data Sources
Primary Research
- Web Analytics
- Survey Reports
- Research Institute
- Latest Research Reports
- Opinion Leaders
Secondary Research
- Annual Reports
- White Paper
- Latest Press Release
- Industry Association
- Paid Database
- Investor Presentations

Step 4 - Data Triangulation
Involves using different sources of information in order to increase the validity of a study
These sources are likely to be stakeholders in a program - participants, other researchers, program staff, other community members, and so on.
Then we put all data in single framework & apply various statistical tools to find out the dynamic on the market.
During the analysis stage, feedback from the stakeholder groups would be compared to determine areas of agreement as well as areas of divergence


