

Key Insights
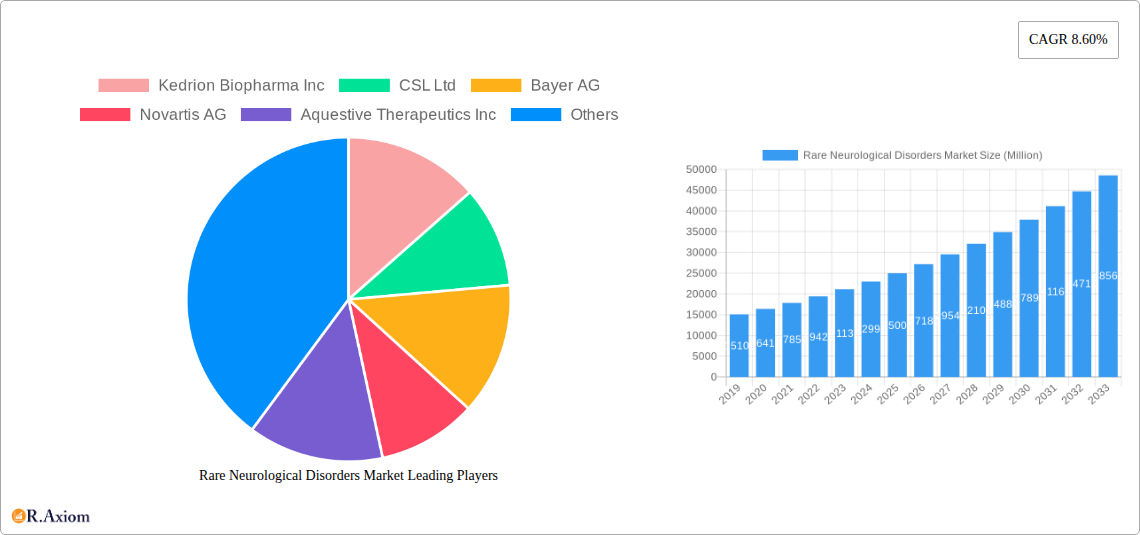
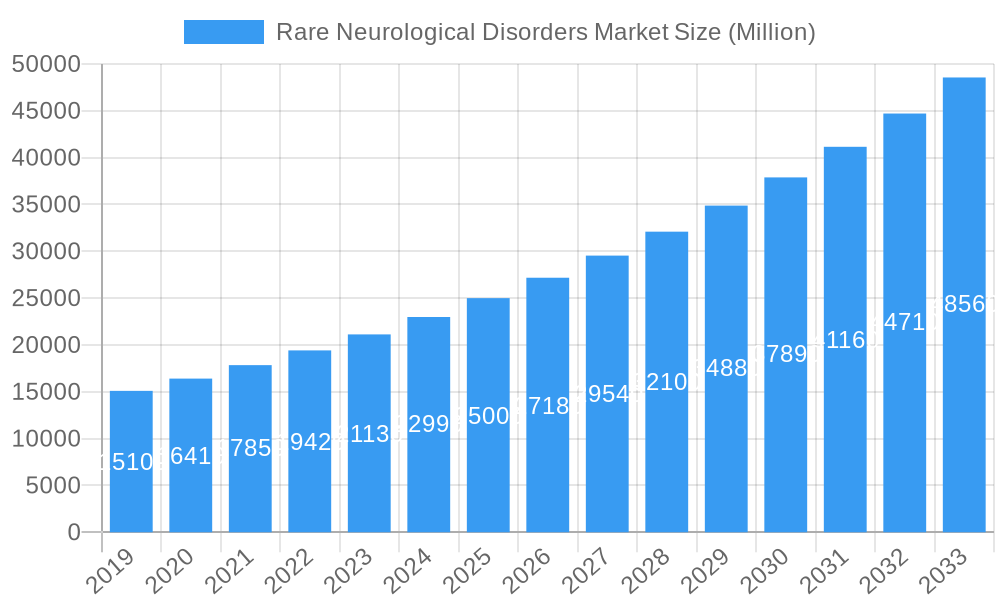
The global Rare Neurological Disorders Market is projected for significant expansion, expected to reach a market size of $15.72 billion by 2025, with a robust Compound Annual Growth Rate (CAGR) of 8.6% through 2033. This growth is fueled by increased R&D investment, enhanced understanding of rare neurological conditions, and the availability of advanced diagnostics for earlier detection. A growing pipeline of novel therapeutics, including biologics and gene therapies, is a key driver, offering new hope for previously untreatable conditions. The market is segmented by drug type, with biologics showing strong potential due to targeted mechanisms, and small molecules remaining important. Intravenous and oral administration modes are evolving to improve patient adherence and efficacy.
Rare Neurological Disorders Market Market Size (In Billion)
Market expansion is supported by major pharmaceutical companies such as Pfizer Inc., Novartis AG, and F Hoffmann - La Roche Ltd., alongside specialized biopharmaceutical firms like Biogen Inc. and Kedrion Biopharma Inc., all actively developing treatments. North America, led by the United States, is expected to retain dominance due to advanced healthcare infrastructure, high spending, and a strong presence of key players. Europe is a substantial market, with Germany and the UK leading. The Asia Pacific region, particularly China and Japan, is poised for the fastest growth, driven by rising healthcare expenditure, increased prevalence of neurological disorders, and supportive government initiatives. Challenges include high development and manufacturing costs for specialized treatments and stringent regulatory hurdles, which may moderate growth. Nevertheless, the market is characterized by dynamic expansion driven by unmet medical needs and therapeutic advancements.
Rare Neurological Disorders Market Company Market Share
Rare Neurological Disorders Market Market Concentration & Innovation
The Rare Neurological Disorders Market exhibits moderate to high concentration, driven by significant R&D investments and stringent regulatory approvals. Innovation in this sector is primarily propelled by advancements in gene therapy, personalized medicine, and novel drug delivery systems aimed at addressing unmet medical needs for diseases like Spinal Muscular Atrophy (SMA) and Huntington's Disease (HD). Key players like F Hoffmann - La Roche Ltd, Biogen Inc, and Pfizer Inc are at the forefront of developing breakthrough therapies. Regulatory frameworks, including orphan drug designations and expedited review processes, play a crucial role in fostering innovation and bringing novel treatments to market, although they also contribute to lengthy development cycles. Product substitutes are limited due to the highly specific nature of rare neurological conditions, but supportive care and advanced diagnostic tools can be considered indirect alternatives. End-user trends are shifting towards greater patient empowerment, demand for access to innovative treatments, and focus on quality of life improvements. Merger and acquisition (M&A) activities are observed as larger pharmaceutical companies seek to acquire promising early-stage therapies and pipeline assets. For instance, M&A deal values can range from tens of millions to over a billion dollars for promising rare disease assets.
Rare Neurological Disorders Market Industry Trends & Insights
The Rare Neurological Disorders Market is experiencing robust growth, fueled by increasing awareness, improved diagnostic capabilities, and a rising number of investigational therapies. The market size is projected to reach an estimated USD 80,500 Million by 2033, growing at a Compound Annual Growth Rate (CAGR) of XX% from the base year 2025. Technological disruptions are a significant trend, with gene therapy and RNA-based therapeutics revolutionizing treatment paradigms for previously untreatable conditions. For example, the successful development and approval of gene therapies for rare genetic disorders have opened new avenues for therapeutic intervention. Consumer preferences are increasingly focused on therapies that offer long-term efficacy, improved quality of life, and fewer side effects. Patients and advocacy groups are actively participating in research and demanding greater access to innovative treatments. Competitive dynamics are intensifying as more pharmaceutical and biotechnology companies enter the rare disease space, attracted by the potential for premium pricing and the opportunity to make a significant impact on patient lives. Market penetration is gradually increasing as more therapies gain regulatory approval and become accessible to a wider patient population. Challenges remain in terms of high development costs, complex clinical trials, and market access hurdles, but the unmet medical need in rare neurological disorders continues to drive investment and research.
Dominant Markets & Segments in Rare Neurological Disorders Market
The Biologics segment is a dominant force within the Rare Neurological Disorders Market. This dominance is attributed to the inherent complexity of rare neurological conditions, which often require highly targeted and sophisticated therapeutic interventions that biologics, such as gene therapies and monoclonal antibodies, are uniquely positioned to provide. The economic policies in developed nations, including strong reimbursement structures for orphan drugs and government incentives for R&D in rare diseases, significantly bolster the growth of the biologics segment. Furthermore, advancements in biopharmaceutical manufacturing technologies have made the production of complex biologics more feasible, albeit still costly.
- Key Drivers for Biologics Dominance:
- High Therapeutic Efficacy: Biologics offer precise targeting of disease mechanisms, leading to significant clinical improvements in conditions like SMA and certain genetic neurological disorders.
- Regulatory Support: Orphan drug designations and expedited review pathways facilitate faster market entry for novel biologic therapies.
- Technological Advancements: Innovations in gene editing (e.g., CRISPR), gene therapy vector development, and antibody engineering enable the creation of highly effective biologic treatments.
- Unmet Medical Needs: The inherent genetic or complex pathophysiological basis of many rare neurological disorders makes biologics a preferred therapeutic modality.
The Intravenous (IV) mode of administration remains a significant channel within this market, especially for biologics that require direct systemic delivery for optimal efficacy. While oral formulations are increasingly being developed for certain rare neurological conditions to enhance patient convenience, IV administration is often essential for drugs requiring precise dosing and immediate systemic distribution, particularly in critical care settings or for conditions impacting the central nervous system directly.
- Dominance of Intravenous Administration:
- Bioavailability and Efficacy: For many complex biologics and certain small molecules, IV administration ensures complete and immediate bioavailability, crucial for rapid therapeutic effect.
- Targeted Delivery: In neurological disorders, IV delivery can facilitate passage across the blood-brain barrier or ensure widespread distribution to affected neural tissues.
- Controlled Dosing: IV infusions allow for precise control over drug dosage and infusion rates, which is vital for managing sensitive neurological conditions.
Rare Neurological Disorders Market Product Developments
Product developments in the Rare Neurological Disorders Market are characterized by a strong focus on gene therapies, enzyme replacement therapies, and novel small molecules targeting specific genetic mutations or pathological pathways. Companies are leveraging advanced technologies like gene editing and RNA interference to create highly targeted and potentially curative treatments for conditions such as Huntington's Disease and Spinal Muscular Atrophy. These innovations offer significant competitive advantages by addressing the root cause of diseases, leading to improved patient outcomes and long-term disease management. The market fit for these products is driven by the critical unmet needs and the potential for transformative therapies in historically underserved patient populations.
Report Scope & Segmentation Analysis
The Rare Neurological Disorders Market is segmented by Drug Type into Biologics and Small Molecules. The Biologics segment, projected to hold a significant market share, encompasses gene therapies, antibody-based treatments, and other complex protein-based therapeutics designed for precise intervention in rare neurological diseases. The Small Molecules segment includes traditional pharmaceutical compounds designed to target specific pathways or symptoms associated with these disorders.
Further segmentation by Mode of Administration includes Intravenous (IV) and Oral administration. The Intravenous segment is crucial for delivering many biologic therapies, ensuring rapid and complete systemic distribution. The Oral segment represents a growing trend towards enhanced patient convenience and adherence, with ongoing research into developing orally available therapies for various rare neurological conditions.
Key Drivers of Rare Neurological Disorders Market Growth
The growth of the Rare Neurological Disorders Market is propelled by several interconnected factors. Firstly, advancements in genetic research and diagnostic technologies are enabling earlier and more accurate identification of rare neurological conditions, thereby expanding the patient pool seeking treatment. Secondly, the development of innovative therapies, particularly gene therapies and orphan drugs, is creating new treatment paradigms and offering hope to patients with limited options. Regulatory incentives, such as orphan drug designations and tax credits, encourage pharmaceutical companies to invest in the research and development of treatments for rare diseases. Furthermore, increasing patient advocacy and awareness campaigns are driving demand for effective treatments and raising the profile of rare neurological disorders. The expanding global healthcare infrastructure and improved access to specialized medical care also contribute to market expansion.
Challenges in the Rare Neurological Disorders Market Sector
Despite the promising growth, the Rare Neurological Disorders Market faces significant challenges. The extremely high cost of research and development for rare diseases, coupled with the small patient populations, results in very high drug prices, posing substantial access and affordability issues for patients and healthcare systems. Clinical trials for rare diseases are often complex and difficult to recruit for, leading to extended development timelines. Regulatory hurdles, while supportive through orphan drug designations, can still be stringent, requiring extensive evidence of safety and efficacy. Manufacturing complexities for biologics and gene therapies also present logistical and cost challenges. Furthermore, the lack of established market precedents and reimbursement frameworks for novel, high-cost therapies can create uncertainty and market access barriers.
Emerging Opportunities in Rare Neurological Disorders Market
Emerging opportunities in the Rare Neurological Disorders Market lie in the continued innovation of gene and cell therapies, which hold the potential for one-time, curative treatments. The increasing understanding of disease mechanisms is paving the way for personalized medicine approaches, tailoring treatments to individual genetic profiles. Expansion into emerging markets, where access to advanced diagnostics and treatments is growing, presents significant untapped potential. Furthermore, the development of advanced drug delivery systems that can overcome the blood-brain barrier more effectively will open new therapeutic avenues. Collaboration between pharmaceutical companies, academic institutions, and patient advocacy groups is crucial for accelerating research and improving patient outcomes.
Leading Players in the Rare Neurological Disorders Market Market
- Kedrion Biopharma Inc
- CSL Ltd
- Bayer AG
- Novartis AG
- Aquestive Therapeutics Inc
- US WorldMeds LLC (Solstice Neurosciences LLC)
- Merz Pharma GmbH & Co KGaA
- Teva Pharmaceutical Industries Ltd
- Merck & Co Inc (EMD Serono Inc )
- Biogen Inc
- F Hoffmann - La Roche Ltd
- Pfizer Inc
Key Developments in Rare Neurological Disorders Market Industry
- September 2021: NeuExcell Therapeutics and Spark Therapeutics entered a gene therapy collaboration to develop a safe and effective treatment for patients with Huntington's Disease (HD).
- July 2021: Roche launched the prescription medicine Evrysdi in India, which is used for spinal muscular atrophy in adults and children aged two months and older.
Strategic Outlook for Rare Neurological Disorders Market Market
The strategic outlook for the Rare Neurological Disorders Market is optimistic, driven by sustained innovation in genetic and cell-based therapies, coupled with increasing regulatory support and patient advocacy. Key growth catalysts include the continued investment in R&D for debilitating neurological conditions, the expansion of gene therapy pipelines, and the development of more accessible oral formulations. Companies are expected to focus on strategic partnerships and collaborations to accelerate drug development and improve market access. The growing understanding of rare disease genetics will enable more targeted therapeutic interventions. Furthermore, the increasing emphasis on patient-centric care and the demand for therapies that offer improved quality of life will shape future market strategies. The market is poised for significant expansion as novel treatments move from clinical trials to commercialization, addressing critical unmet medical needs.
Rare Neurological Disorders Market Segmentation
-
1. Drug Type
- 1.1. Biologics
- 1.2. Small Molecules
-
2. Mode of Administration
- 2.1. Intravenous
- 2.2. Oral
Rare Neurological Disorders Market Segmentation By Geography
-
1. North America
- 1.1. United States
- 1.2. Canada
- 1.3. Mexico
-
2. Europe
- 2.1. Germany
- 2.2. United Kingdom
- 2.3. France
- 2.4. Italy
- 2.5. Spain
- 2.6. Rest of Europe
-
3. Asia Pacific
- 3.1. China
- 3.2. Japan
- 3.3. India
- 3.4. Australia
- 3.5. South Korea
- 3.6. Rest of Asia Pacific
-
4. Middle East and Africa
- 4.1. GCC
- 4.2. South Africa
- 4.3. Rest of Middle East and Africa
-
5. South America
- 5.1. Brazil
- 5.2. Argentina
- 5.3. Rest of South America
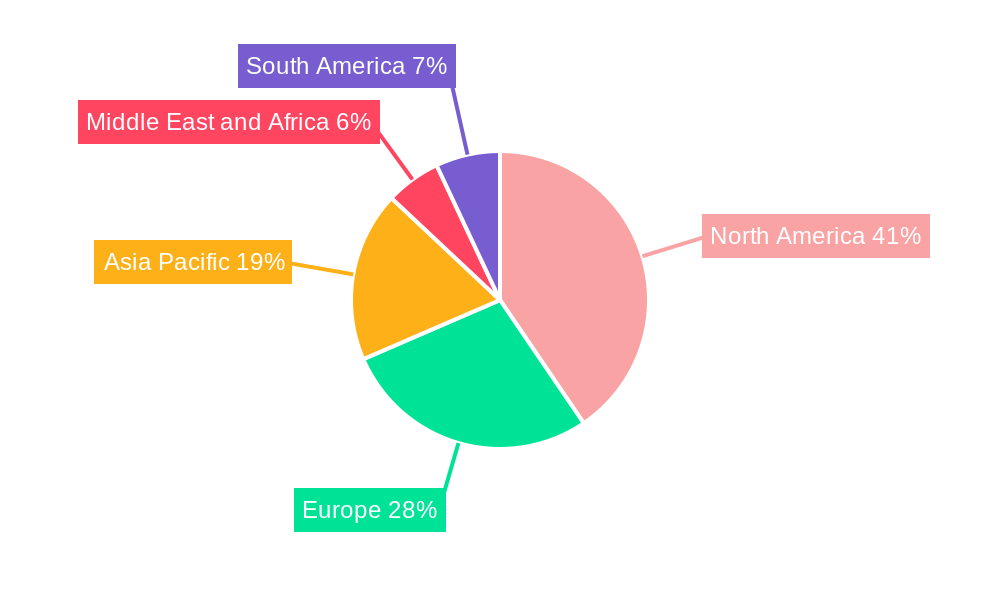
Rare Neurological Disorders Market Regional Market Share
Geographic Coverage of Rare Neurological Disorders Market
Rare Neurological Disorders Market REPORT HIGHLIGHTS
| Aspects | Details |
|---|---|
| Study Period | 2020-2034 |
| Base Year | 2025 |
| Estimated Year | 2026 |
| Forecast Period | 2026-2034 |
| Historical Period | 2020-2025 |
| Growth Rate | CAGR of 8.6% from 2020-2034 |
| Segmentation |
|
Table of Contents
- 1. Introduction
- 1.1. Research Scope
- 1.2. Market Segmentation
- 1.3. Research Objective
- 1.4. Definitions and Assumptions
- 2. Executive Summary
- 2.1. Market Snapshot
- 3. Market Dynamics
- 3.1. Market Drivers
- 3.2. Market Restrains
- 3.3. Market Trends
- 3.4. Market Opportunities
- 4. Market Factor Analysis
- 4.1. Porters Five Forces
- 4.1.1. Bargaining Power of Suppliers
- 4.1.2. Bargaining Power of Buyers
- 4.1.3. Threat of New Entrants
- 4.1.4. Threat of Substitutes
- 4.1.5. Competitive Rivalry
- 4.2. PESTEL analysis
- 4.3. BCG Analysis
- 4.3.1. Stars (High Growth, High Market Share)
- 4.3.2. Cash Cows (Low Growth, High Market Share)
- 4.3.3. Question Mark (High Growth, Low Market Share)
- 4.3.4. Dogs (Low Growth, Low Market Share)
- 4.4. Ansoff Matrix Analysis
- 4.5. Supply Chain Analysis
- 4.6. Regulatory Landscape
- 4.7. Current Market Potential and Opportunity Assessment (TAM–SAM–SOM Framework)
- 4.8. RAX Analyst Note
- 4.1. Porters Five Forces
- 5. Market Analysis, Insights and Forecast 2021-2033
- 5.1. Market Analysis, Insights and Forecast - by Drug Type
- 5.1.1. Biologics
- 5.1.2. Small Molecules
- 5.2. Market Analysis, Insights and Forecast - by Mode of Administration
- 5.2.1. Intravenous
- 5.2.2. Oral
- 5.3. Market Analysis, Insights and Forecast - by Region
- 5.3.1. North America
- 5.3.2. Europe
- 5.3.3. Asia Pacific
- 5.3.4. Middle East and Africa
- 5.3.5. South America
- 5.1. Market Analysis, Insights and Forecast - by Drug Type
- 6. Global Rare Neurological Disorders Market Analysis, Insights and Forecast, 2021-2033
- 6.1. Market Analysis, Insights and Forecast - by Drug Type
- 6.1.1. Biologics
- 6.1.2. Small Molecules
- 6.2. Market Analysis, Insights and Forecast - by Mode of Administration
- 6.2.1. Intravenous
- 6.2.2. Oral
- 6.1. Market Analysis, Insights and Forecast - by Drug Type
- 7. North America Rare Neurological Disorders Market Analysis, Insights and Forecast, 2020-2032
- 7.1. Market Analysis, Insights and Forecast - by Drug Type
- 7.1.1. Biologics
- 7.1.2. Small Molecules
- 7.2. Market Analysis, Insights and Forecast - by Mode of Administration
- 7.2.1. Intravenous
- 7.2.2. Oral
- 7.1. Market Analysis, Insights and Forecast - by Drug Type
- 8. Europe Rare Neurological Disorders Market Analysis, Insights and Forecast, 2020-2032
- 8.1. Market Analysis, Insights and Forecast - by Drug Type
- 8.1.1. Biologics
- 8.1.2. Small Molecules
- 8.2. Market Analysis, Insights and Forecast - by Mode of Administration
- 8.2.1. Intravenous
- 8.2.2. Oral
- 8.1. Market Analysis, Insights and Forecast - by Drug Type
- 9. Asia Pacific Rare Neurological Disorders Market Analysis, Insights and Forecast, 2020-2032
- 9.1. Market Analysis, Insights and Forecast - by Drug Type
- 9.1.1. Biologics
- 9.1.2. Small Molecules
- 9.2. Market Analysis, Insights and Forecast - by Mode of Administration
- 9.2.1. Intravenous
- 9.2.2. Oral
- 9.1. Market Analysis, Insights and Forecast - by Drug Type
- 10. Middle East and Africa Rare Neurological Disorders Market Analysis, Insights and Forecast, 2020-2032
- 10.1. Market Analysis, Insights and Forecast - by Drug Type
- 10.1.1. Biologics
- 10.1.2. Small Molecules
- 10.2. Market Analysis, Insights and Forecast - by Mode of Administration
- 10.2.1. Intravenous
- 10.2.2. Oral
- 10.1. Market Analysis, Insights and Forecast - by Drug Type
- 11. South America Rare Neurological Disorders Market Analysis, Insights and Forecast, 2020-2032
- 11.1. Market Analysis, Insights and Forecast - by Drug Type
- 11.1.1. Biologics
- 11.1.2. Small Molecules
- 11.2. Market Analysis, Insights and Forecast - by Mode of Administration
- 11.2.1. Intravenous
- 11.2.2. Oral
- 11.1. Market Analysis, Insights and Forecast - by Drug Type
- 12. Competitive Analysis
- 12.1. Company Profiles
- 12.1.1 Kedrion Biopharma Inc
- 12.1.1.1. Company Overview
- 12.1.1.2. Products
- 12.1.1.3. Company Financials
- 12.1.1.4. SWOT Analysis
- 12.1.2 CSL Ltd
- 12.1.2.1. Company Overview
- 12.1.2.2. Products
- 12.1.2.3. Company Financials
- 12.1.2.4. SWOT Analysis
- 12.1.3 Bayer AG
- 12.1.3.1. Company Overview
- 12.1.3.2. Products
- 12.1.3.3. Company Financials
- 12.1.3.4. SWOT Analysis
- 12.1.4 Novartis AG
- 12.1.4.1. Company Overview
- 12.1.4.2. Products
- 12.1.4.3. Company Financials
- 12.1.4.4. SWOT Analysis
- 12.1.5 Aquestive Therapeutics Inc
- 12.1.5.1. Company Overview
- 12.1.5.2. Products
- 12.1.5.3. Company Financials
- 12.1.5.4. SWOT Analysis
- 12.1.6 US WorldMeds LLC (Solstice Neurosciences LLC)
- 12.1.6.1. Company Overview
- 12.1.6.2. Products
- 12.1.6.3. Company Financials
- 12.1.6.4. SWOT Analysis
- 12.1.7 Merz Pharma GmbH & Co KGaA
- 12.1.7.1. Company Overview
- 12.1.7.2. Products
- 12.1.7.3. Company Financials
- 12.1.7.4. SWOT Analysis
- 12.1.8 Teva Pharmaceutical Industries Ltd
- 12.1.8.1. Company Overview
- 12.1.8.2. Products
- 12.1.8.3. Company Financials
- 12.1.8.4. SWOT Analysis
- 12.1.9 Merck & Co Inc (EMD Serono Inc )
- 12.1.9.1. Company Overview
- 12.1.9.2. Products
- 12.1.9.3. Company Financials
- 12.1.9.4. SWOT Analysis
- 12.1.10 Biogen Inc
- 12.1.10.1. Company Overview
- 12.1.10.2. Products
- 12.1.10.3. Company Financials
- 12.1.10.4. SWOT Analysis
- 12.1.11 F Hoffmann - La Roche Ltd
- 12.1.11.1. Company Overview
- 12.1.11.2. Products
- 12.1.11.3. Company Financials
- 12.1.11.4. SWOT Analysis
- 12.1.12 Pfizer Inc
- 12.1.12.1. Company Overview
- 12.1.12.2. Products
- 12.1.12.3. Company Financials
- 12.1.12.4. SWOT Analysis
- 12.1.1 Kedrion Biopharma Inc
- 12.2. Market Entropy
- 12.2.1 Company's Key Areas Served
- 12.2.2 Recent Developments
- 12.3. Company Market Share Analysis 2025
- 12.3.1 Top 5 Companies Market Share Analysis
- 12.3.2 Top 3 Companies Market Share Analysis
- 12.4. List of Potential Customers
- 13. Research Methodology
List of Figures
- Figure 1: Global Rare Neurological Disorders Market Revenue Breakdown (billion, %) by Region 2025 & 2033
- Figure 2: Global Rare Neurological Disorders Market Volume Breakdown (K Unit, %) by Region 2025 & 2033
- Figure 3: North America Rare Neurological Disorders Market Revenue (billion), by Drug Type 2025 & 2033
- Figure 4: North America Rare Neurological Disorders Market Volume (K Unit), by Drug Type 2025 & 2033
- Figure 5: North America Rare Neurological Disorders Market Revenue Share (%), by Drug Type 2025 & 2033
- Figure 6: North America Rare Neurological Disorders Market Volume Share (%), by Drug Type 2025 & 2033
- Figure 7: North America Rare Neurological Disorders Market Revenue (billion), by Mode of Administration 2025 & 2033
- Figure 8: North America Rare Neurological Disorders Market Volume (K Unit), by Mode of Administration 2025 & 2033
- Figure 9: North America Rare Neurological Disorders Market Revenue Share (%), by Mode of Administration 2025 & 2033
- Figure 10: North America Rare Neurological Disorders Market Volume Share (%), by Mode of Administration 2025 & 2033
- Figure 11: North America Rare Neurological Disorders Market Revenue (billion), by Country 2025 & 2033
- Figure 12: North America Rare Neurological Disorders Market Volume (K Unit), by Country 2025 & 2033
- Figure 13: North America Rare Neurological Disorders Market Revenue Share (%), by Country 2025 & 2033
- Figure 14: North America Rare Neurological Disorders Market Volume Share (%), by Country 2025 & 2033
- Figure 15: Europe Rare Neurological Disorders Market Revenue (billion), by Drug Type 2025 & 2033
- Figure 16: Europe Rare Neurological Disorders Market Volume (K Unit), by Drug Type 2025 & 2033
- Figure 17: Europe Rare Neurological Disorders Market Revenue Share (%), by Drug Type 2025 & 2033
- Figure 18: Europe Rare Neurological Disorders Market Volume Share (%), by Drug Type 2025 & 2033
- Figure 19: Europe Rare Neurological Disorders Market Revenue (billion), by Mode of Administration 2025 & 2033
- Figure 20: Europe Rare Neurological Disorders Market Volume (K Unit), by Mode of Administration 2025 & 2033
- Figure 21: Europe Rare Neurological Disorders Market Revenue Share (%), by Mode of Administration 2025 & 2033
- Figure 22: Europe Rare Neurological Disorders Market Volume Share (%), by Mode of Administration 2025 & 2033
- Figure 23: Europe Rare Neurological Disorders Market Revenue (billion), by Country 2025 & 2033
- Figure 24: Europe Rare Neurological Disorders Market Volume (K Unit), by Country 2025 & 2033
- Figure 25: Europe Rare Neurological Disorders Market Revenue Share (%), by Country 2025 & 2033
- Figure 26: Europe Rare Neurological Disorders Market Volume Share (%), by Country 2025 & 2033
- Figure 27: Asia Pacific Rare Neurological Disorders Market Revenue (billion), by Drug Type 2025 & 2033
- Figure 28: Asia Pacific Rare Neurological Disorders Market Volume (K Unit), by Drug Type 2025 & 2033
- Figure 29: Asia Pacific Rare Neurological Disorders Market Revenue Share (%), by Drug Type 2025 & 2033
- Figure 30: Asia Pacific Rare Neurological Disorders Market Volume Share (%), by Drug Type 2025 & 2033
- Figure 31: Asia Pacific Rare Neurological Disorders Market Revenue (billion), by Mode of Administration 2025 & 2033
- Figure 32: Asia Pacific Rare Neurological Disorders Market Volume (K Unit), by Mode of Administration 2025 & 2033
- Figure 33: Asia Pacific Rare Neurological Disorders Market Revenue Share (%), by Mode of Administration 2025 & 2033
- Figure 34: Asia Pacific Rare Neurological Disorders Market Volume Share (%), by Mode of Administration 2025 & 2033
- Figure 35: Asia Pacific Rare Neurological Disorders Market Revenue (billion), by Country 2025 & 2033
- Figure 36: Asia Pacific Rare Neurological Disorders Market Volume (K Unit), by Country 2025 & 2033
- Figure 37: Asia Pacific Rare Neurological Disorders Market Revenue Share (%), by Country 2025 & 2033
- Figure 38: Asia Pacific Rare Neurological Disorders Market Volume Share (%), by Country 2025 & 2033
- Figure 39: Middle East and Africa Rare Neurological Disorders Market Revenue (billion), by Drug Type 2025 & 2033
- Figure 40: Middle East and Africa Rare Neurological Disorders Market Volume (K Unit), by Drug Type 2025 & 2033
- Figure 41: Middle East and Africa Rare Neurological Disorders Market Revenue Share (%), by Drug Type 2025 & 2033
- Figure 42: Middle East and Africa Rare Neurological Disorders Market Volume Share (%), by Drug Type 2025 & 2033
- Figure 43: Middle East and Africa Rare Neurological Disorders Market Revenue (billion), by Mode of Administration 2025 & 2033
- Figure 44: Middle East and Africa Rare Neurological Disorders Market Volume (K Unit), by Mode of Administration 2025 & 2033
- Figure 45: Middle East and Africa Rare Neurological Disorders Market Revenue Share (%), by Mode of Administration 2025 & 2033
- Figure 46: Middle East and Africa Rare Neurological Disorders Market Volume Share (%), by Mode of Administration 2025 & 2033
- Figure 47: Middle East and Africa Rare Neurological Disorders Market Revenue (billion), by Country 2025 & 2033
- Figure 48: Middle East and Africa Rare Neurological Disorders Market Volume (K Unit), by Country 2025 & 2033
- Figure 49: Middle East and Africa Rare Neurological Disorders Market Revenue Share (%), by Country 2025 & 2033
- Figure 50: Middle East and Africa Rare Neurological Disorders Market Volume Share (%), by Country 2025 & 2033
- Figure 51: South America Rare Neurological Disorders Market Revenue (billion), by Drug Type 2025 & 2033
- Figure 52: South America Rare Neurological Disorders Market Volume (K Unit), by Drug Type 2025 & 2033
- Figure 53: South America Rare Neurological Disorders Market Revenue Share (%), by Drug Type 2025 & 2033
- Figure 54: South America Rare Neurological Disorders Market Volume Share (%), by Drug Type 2025 & 2033
- Figure 55: South America Rare Neurological Disorders Market Revenue (billion), by Mode of Administration 2025 & 2033
- Figure 56: South America Rare Neurological Disorders Market Volume (K Unit), by Mode of Administration 2025 & 2033
- Figure 57: South America Rare Neurological Disorders Market Revenue Share (%), by Mode of Administration 2025 & 2033
- Figure 58: South America Rare Neurological Disorders Market Volume Share (%), by Mode of Administration 2025 & 2033
- Figure 59: South America Rare Neurological Disorders Market Revenue (billion), by Country 2025 & 2033
- Figure 60: South America Rare Neurological Disorders Market Volume (K Unit), by Country 2025 & 2033
- Figure 61: South America Rare Neurological Disorders Market Revenue Share (%), by Country 2025 & 2033
- Figure 62: South America Rare Neurological Disorders Market Volume Share (%), by Country 2025 & 2033
List of Tables
- Table 1: Global Rare Neurological Disorders Market Revenue billion Forecast, by Drug Type 2020 & 2033
- Table 2: Global Rare Neurological Disorders Market Volume K Unit Forecast, by Drug Type 2020 & 2033
- Table 3: Global Rare Neurological Disorders Market Revenue billion Forecast, by Mode of Administration 2020 & 2033
- Table 4: Global Rare Neurological Disorders Market Volume K Unit Forecast, by Mode of Administration 2020 & 2033
- Table 5: Global Rare Neurological Disorders Market Revenue billion Forecast, by Region 2020 & 2033
- Table 6: Global Rare Neurological Disorders Market Volume K Unit Forecast, by Region 2020 & 2033
- Table 7: Global Rare Neurological Disorders Market Revenue billion Forecast, by Drug Type 2020 & 2033
- Table 8: Global Rare Neurological Disorders Market Volume K Unit Forecast, by Drug Type 2020 & 2033
- Table 9: Global Rare Neurological Disorders Market Revenue billion Forecast, by Mode of Administration 2020 & 2033
- Table 10: Global Rare Neurological Disorders Market Volume K Unit Forecast, by Mode of Administration 2020 & 2033
- Table 11: Global Rare Neurological Disorders Market Revenue billion Forecast, by Country 2020 & 2033
- Table 12: Global Rare Neurological Disorders Market Volume K Unit Forecast, by Country 2020 & 2033
- Table 13: United States Rare Neurological Disorders Market Revenue (billion) Forecast, by Application 2020 & 2033
- Table 14: United States Rare Neurological Disorders Market Volume (K Unit) Forecast, by Application 2020 & 2033
- Table 15: Canada Rare Neurological Disorders Market Revenue (billion) Forecast, by Application 2020 & 2033
- Table 16: Canada Rare Neurological Disorders Market Volume (K Unit) Forecast, by Application 2020 & 2033
- Table 17: Mexico Rare Neurological Disorders Market Revenue (billion) Forecast, by Application 2020 & 2033
- Table 18: Mexico Rare Neurological Disorders Market Volume (K Unit) Forecast, by Application 2020 & 2033
- Table 19: Global Rare Neurological Disorders Market Revenue billion Forecast, by Drug Type 2020 & 2033
- Table 20: Global Rare Neurological Disorders Market Volume K Unit Forecast, by Drug Type 2020 & 2033
- Table 21: Global Rare Neurological Disorders Market Revenue billion Forecast, by Mode of Administration 2020 & 2033
- Table 22: Global Rare Neurological Disorders Market Volume K Unit Forecast, by Mode of Administration 2020 & 2033
- Table 23: Global Rare Neurological Disorders Market Revenue billion Forecast, by Country 2020 & 2033
- Table 24: Global Rare Neurological Disorders Market Volume K Unit Forecast, by Country 2020 & 2033
- Table 25: Germany Rare Neurological Disorders Market Revenue (billion) Forecast, by Application 2020 & 2033
- Table 26: Germany Rare Neurological Disorders Market Volume (K Unit) Forecast, by Application 2020 & 2033
- Table 27: United Kingdom Rare Neurological Disorders Market Revenue (billion) Forecast, by Application 2020 & 2033
- Table 28: United Kingdom Rare Neurological Disorders Market Volume (K Unit) Forecast, by Application 2020 & 2033
- Table 29: France Rare Neurological Disorders Market Revenue (billion) Forecast, by Application 2020 & 2033
- Table 30: France Rare Neurological Disorders Market Volume (K Unit) Forecast, by Application 2020 & 2033
- Table 31: Italy Rare Neurological Disorders Market Revenue (billion) Forecast, by Application 2020 & 2033
- Table 32: Italy Rare Neurological Disorders Market Volume (K Unit) Forecast, by Application 2020 & 2033
- Table 33: Spain Rare Neurological Disorders Market Revenue (billion) Forecast, by Application 2020 & 2033
- Table 34: Spain Rare Neurological Disorders Market Volume (K Unit) Forecast, by Application 2020 & 2033
- Table 35: Rest of Europe Rare Neurological Disorders Market Revenue (billion) Forecast, by Application 2020 & 2033
- Table 36: Rest of Europe Rare Neurological Disorders Market Volume (K Unit) Forecast, by Application 2020 & 2033
- Table 37: Global Rare Neurological Disorders Market Revenue billion Forecast, by Drug Type 2020 & 2033
- Table 38: Global Rare Neurological Disorders Market Volume K Unit Forecast, by Drug Type 2020 & 2033
- Table 39: Global Rare Neurological Disorders Market Revenue billion Forecast, by Mode of Administration 2020 & 2033
- Table 40: Global Rare Neurological Disorders Market Volume K Unit Forecast, by Mode of Administration 2020 & 2033
- Table 41: Global Rare Neurological Disorders Market Revenue billion Forecast, by Country 2020 & 2033
- Table 42: Global Rare Neurological Disorders Market Volume K Unit Forecast, by Country 2020 & 2033
- Table 43: China Rare Neurological Disorders Market Revenue (billion) Forecast, by Application 2020 & 2033
- Table 44: China Rare Neurological Disorders Market Volume (K Unit) Forecast, by Application 2020 & 2033
- Table 45: Japan Rare Neurological Disorders Market Revenue (billion) Forecast, by Application 2020 & 2033
- Table 46: Japan Rare Neurological Disorders Market Volume (K Unit) Forecast, by Application 2020 & 2033
- Table 47: India Rare Neurological Disorders Market Revenue (billion) Forecast, by Application 2020 & 2033
- Table 48: India Rare Neurological Disorders Market Volume (K Unit) Forecast, by Application 2020 & 2033
- Table 49: Australia Rare Neurological Disorders Market Revenue (billion) Forecast, by Application 2020 & 2033
- Table 50: Australia Rare Neurological Disorders Market Volume (K Unit) Forecast, by Application 2020 & 2033
- Table 51: South Korea Rare Neurological Disorders Market Revenue (billion) Forecast, by Application 2020 & 2033
- Table 52: South Korea Rare Neurological Disorders Market Volume (K Unit) Forecast, by Application 2020 & 2033
- Table 53: Rest of Asia Pacific Rare Neurological Disorders Market Revenue (billion) Forecast, by Application 2020 & 2033
- Table 54: Rest of Asia Pacific Rare Neurological Disorders Market Volume (K Unit) Forecast, by Application 2020 & 2033
- Table 55: Global Rare Neurological Disorders Market Revenue billion Forecast, by Drug Type 2020 & 2033
- Table 56: Global Rare Neurological Disorders Market Volume K Unit Forecast, by Drug Type 2020 & 2033
- Table 57: Global Rare Neurological Disorders Market Revenue billion Forecast, by Mode of Administration 2020 & 2033
- Table 58: Global Rare Neurological Disorders Market Volume K Unit Forecast, by Mode of Administration 2020 & 2033
- Table 59: Global Rare Neurological Disorders Market Revenue billion Forecast, by Country 2020 & 2033
- Table 60: Global Rare Neurological Disorders Market Volume K Unit Forecast, by Country 2020 & 2033
- Table 61: GCC Rare Neurological Disorders Market Revenue (billion) Forecast, by Application 2020 & 2033
- Table 62: GCC Rare Neurological Disorders Market Volume (K Unit) Forecast, by Application 2020 & 2033
- Table 63: South Africa Rare Neurological Disorders Market Revenue (billion) Forecast, by Application 2020 & 2033
- Table 64: South Africa Rare Neurological Disorders Market Volume (K Unit) Forecast, by Application 2020 & 2033
- Table 65: Rest of Middle East and Africa Rare Neurological Disorders Market Revenue (billion) Forecast, by Application 2020 & 2033
- Table 66: Rest of Middle East and Africa Rare Neurological Disorders Market Volume (K Unit) Forecast, by Application 2020 & 2033
- Table 67: Global Rare Neurological Disorders Market Revenue billion Forecast, by Drug Type 2020 & 2033
- Table 68: Global Rare Neurological Disorders Market Volume K Unit Forecast, by Drug Type 2020 & 2033
- Table 69: Global Rare Neurological Disorders Market Revenue billion Forecast, by Mode of Administration 2020 & 2033
- Table 70: Global Rare Neurological Disorders Market Volume K Unit Forecast, by Mode of Administration 2020 & 2033
- Table 71: Global Rare Neurological Disorders Market Revenue billion Forecast, by Country 2020 & 2033
- Table 72: Global Rare Neurological Disorders Market Volume K Unit Forecast, by Country 2020 & 2033
- Table 73: Brazil Rare Neurological Disorders Market Revenue (billion) Forecast, by Application 2020 & 2033
- Table 74: Brazil Rare Neurological Disorders Market Volume (K Unit) Forecast, by Application 2020 & 2033
- Table 75: Argentina Rare Neurological Disorders Market Revenue (billion) Forecast, by Application 2020 & 2033
- Table 76: Argentina Rare Neurological Disorders Market Volume (K Unit) Forecast, by Application 2020 & 2033
- Table 77: Rest of South America Rare Neurological Disorders Market Revenue (billion) Forecast, by Application 2020 & 2033
- Table 78: Rest of South America Rare Neurological Disorders Market Volume (K Unit) Forecast, by Application 2020 & 2033
Frequently Asked Questions
1. What is the projected Compound Annual Growth Rate (CAGR) of the Rare Neurological Disorders Market?
The projected CAGR is approximately 8.6%.
2. Which companies are prominent players in the Rare Neurological Disorders Market?
Key companies in the market include Kedrion Biopharma Inc, CSL Ltd, Bayer AG, Novartis AG, Aquestive Therapeutics Inc, US WorldMeds LLC (Solstice Neurosciences LLC), Merz Pharma GmbH & Co KGaA, Teva Pharmaceutical Industries Ltd, Merck & Co Inc (EMD Serono Inc ), Biogen Inc, F Hoffmann - La Roche Ltd, Pfizer Inc.
3. What are the main segments of the Rare Neurological Disorders Market?
The market segments include Drug Type, Mode of Administration.
4. Can you provide details about the market size?
The market size is estimated to be USD 15.72 billion as of 2022.
5. What are some drivers contributing to market growth?
Increasing Prevalence of Rare Neurological Diseases; Promising Pipeline Drugs for Treatment of Rare Neurological Diseases; Favorable Government Policies Worldwide for Speeding up Diagnostic Processes.
6. What are the notable trends driving market growth?
The Small Molecules Segment is Expected to Hold a Major Share in the Rare Neurological Disease Treatment Market.
7. Are there any restraints impacting market growth?
High Cost of Rare Neurological Disease Treatment.
8. Can you provide examples of recent developments in the market?
September 2021: NeuExcell Therapeutics and Spark Therapeutics entered a gene therapy collaboration to develop a safe and effective treatment for patients with Huntington's Disease (HD).
9. What pricing options are available for accessing the report?
Pricing options include single-user, multi-user, and enterprise licenses priced at USD 4750, USD 5250, and USD 8750 respectively.
10. Is the market size provided in terms of value or volume?
The market size is provided in terms of value, measured in billion and volume, measured in K Unit.
11. Are there any specific market keywords associated with the report?
Yes, the market keyword associated with the report is "Rare Neurological Disorders Market," which aids in identifying and referencing the specific market segment covered.
12. How do I determine which pricing option suits my needs best?
The pricing options vary based on user requirements and access needs. Individual users may opt for single-user licenses, while businesses requiring broader access may choose multi-user or enterprise licenses for cost-effective access to the report.
13. Are there any additional resources or data provided in the Rare Neurological Disorders Market report?
While the report offers comprehensive insights, it's advisable to review the specific contents or supplementary materials provided to ascertain if additional resources or data are available.
14. How can I stay updated on further developments or reports in the Rare Neurological Disorders Market?
To stay informed about further developments, trends, and reports in the Rare Neurological Disorders Market, consider subscribing to industry newsletters, following relevant companies and organizations, or regularly checking reputable industry news sources and publications.
Methodology
Step 1 - Identification of Relevant Samples Size from Population Database


Step 2 - Approaches for Defining Global Market Size (Value, Volume* & Price*)

Note*: In applicable scenarios
Step 3 - Data Sources
Primary Research
- Web Analytics
- Survey Reports
- Research Institute
- Latest Research Reports
- Opinion Leaders
Secondary Research
- Annual Reports
- White Paper
- Latest Press Release
- Industry Association
- Paid Database
- Investor Presentations

Step 4 - Data Triangulation
Involves using different sources of information in order to increase the validity of a study
These sources are likely to be stakeholders in a program - participants, other researchers, program staff, other community members, and so on.
Then we put all data in single framework & apply various statistical tools to find out the dynamic on the market.
During the analysis stage, feedback from the stakeholder groups would be compared to determine areas of agreement as well as areas of divergence