Key Insights
The global reach stacker market, estimated at 3.2 billion in 2025, is poised for significant expansion. Driven by escalating global trade and the imperative for efficient cargo handling in seaports and industrial environments, the market is projected to achieve a Compound Annual Growth Rate (CAGR) of 6.9% from 2025 to 2033. Key catalysts for this growth include surging e-commerce volumes boosting port throughput, the automation of logistics for enhanced efficiency and cost savings, and the growing adoption of hybrid and electric powertrains in alignment with sustainability objectives. The seaport segment dominates the market, with high-tonnage reach stackers being particularly sought after for their superior cargo handling capabilities. Established leaders such as Konecranes, Liebherr, and Kalmar, alongside innovative emerging players, are shaping the competitive landscape. Geographic expansion is anticipated across North America, Europe, and rapidly developing Asia-Pacific economies, notably China and India. Potential challenges include volatile fuel prices, economic uncertainties impacting trade, and supply chain vulnerabilities.
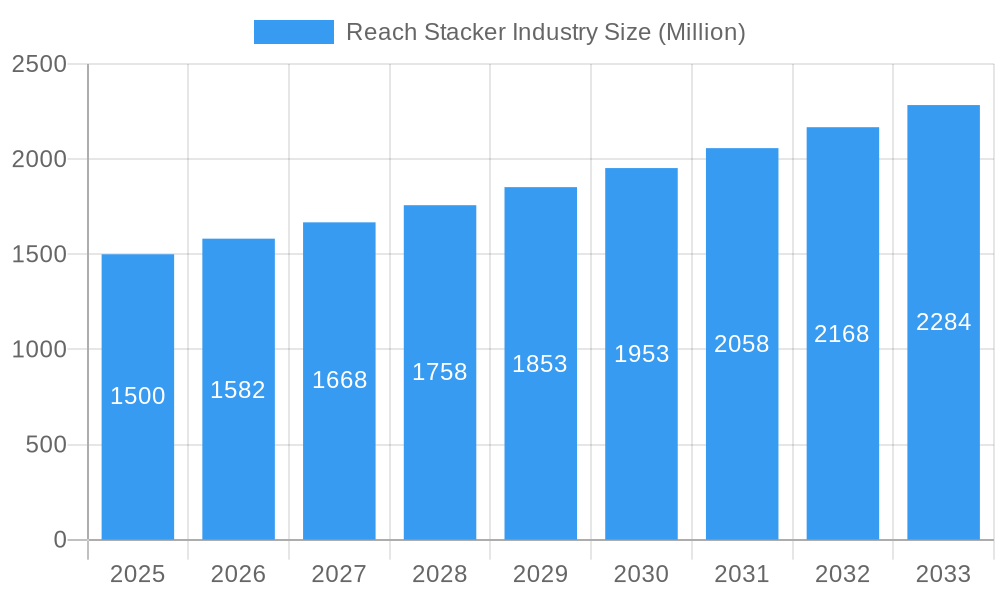
Reach Stacker Industry Market Size (In Billion)
Technological advancements, including the integration of advanced automation (autonomous operation, remote control), enhanced safety features, and data analytics for operational optimization, will be pivotal. The increasing emphasis on emission reduction is accelerating the development and adoption of sustainable hybrid and electric reach stackers. Mergers and acquisitions are expected to rise as companies seek to broaden their product offerings and market presence. Furthermore, governmental regulations promoting port efficiency and emission reduction will significantly influence the market's future trajectory.
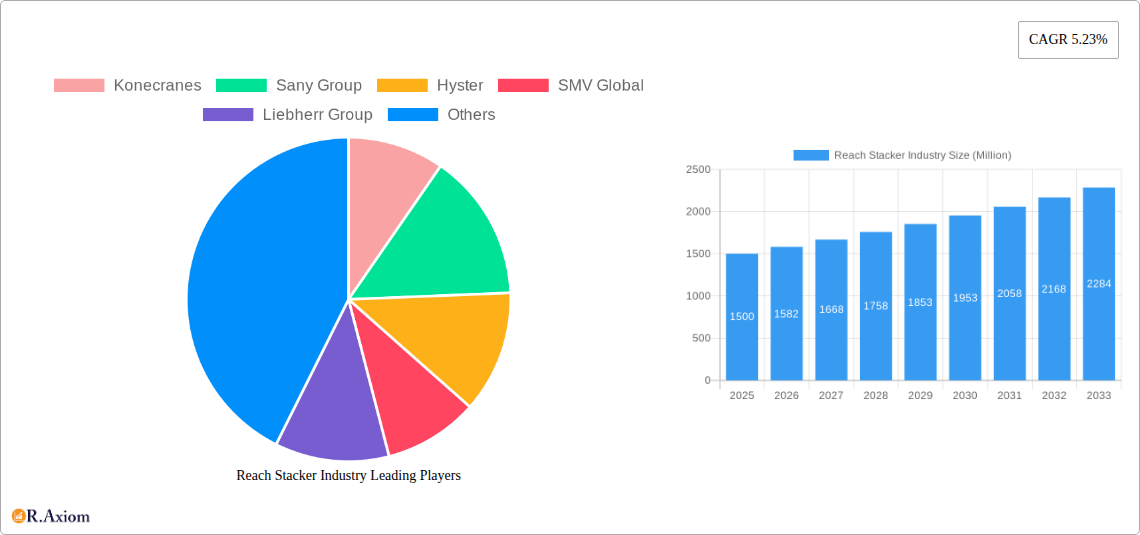
Reach Stacker Industry Company Market Share
Reach Stacker Industry Market Report: 2019-2033
This comprehensive report provides a detailed analysis of the global Reach Stacker industry, offering invaluable insights for stakeholders, investors, and industry professionals. The report covers the period 2019-2033, with a focus on the forecast period 2025-2033, using 2025 as the base year. The global market size in 2025 is estimated at $XX Million. This in-depth analysis explores market dynamics, competitive landscapes, technological advancements, and future growth opportunities within the Reach Stacker sector.
Reach Stacker Industry Market Concentration & Innovation
The Reach Stacker industry exhibits a moderately concentrated market structure, with key players like Konecranes, Sany Group, Hyster, SMV Global, Liebherr Group, Toyota, Kalmar Group, CVS Ferrari S P A, and Terex holding significant market share. However, the presence of numerous smaller players indicates a competitive landscape. Market concentration is further analyzed through metrics such as the Herfindahl-Hirschman Index (HHI) and market share distribution. Innovation is driven by the need for enhanced efficiency, improved safety features, and reduced environmental impact. Regulatory frameworks, including emission standards and safety regulations, significantly influence product development and market dynamics. The industry is witnessing increasing M&A activities, with deal values exceeding $XX Million in recent years. Substitute products, such as specialized forklifts, pose a competitive threat, especially in niche segments. End-user trends, including increasing demand for automation and remote operation capabilities, are reshaping the market landscape.
- Market Share (2025 Estimate): Konecranes - 15%; Sany Group - 12%; Hyster - 10%; Others - 63%
- M&A Deal Values (2019-2024): $XX Million
- Key Innovation Drivers: Automation, Emission Reduction Technologies, Improved Safety Features
Reach Stacker Industry Trends & Insights
The Reach Stacker industry is experiencing robust growth, driven by increasing global trade volumes and the expansion of port infrastructure. The Compound Annual Growth Rate (CAGR) for the forecast period (2025-2033) is estimated at XX%. Technological disruptions, such as the adoption of electric and hybrid powertrains, are influencing market dynamics. Consumer preferences are shifting towards environmentally friendly and fuel-efficient machines, driving the demand for hybrid and electric reach stackers. Competitive dynamics are characterized by intense rivalry among major players, leading to continuous product innovation and price competition. Market penetration of hybrid and electric reach stackers is steadily increasing, projected to reach XX% by 2033.
Dominant Markets & Segments in Reach Stacker Industry
The sea port segment dominates the Reach Stacker market, accounting for approximately XX% of the total market value in 2025. Geographically, Asia-Pacific is the leading region, driven by rapid economic growth and significant investments in port infrastructure. Within tonnage segments, the medium-tonnage segment holds the largest market share, owing to its versatility across diverse applications. The IC engine powertrain type continues to be dominant due to its established technology and higher power output; however, the hybrid powertrain segment is rapidly gaining traction due to increasing environmental concerns.
- Key Drivers for Sea Port Segment Dominance: High container traffic, expansion of port infrastructure, growing global trade
- Key Drivers for Asia-Pacific Regional Dominance: Rapid industrialization, rising import/export activities, strategic investments in port infrastructure.
- Key Drivers for Medium Tonnage Segment Dominance: Versatility, suitability for varied applications.
Reach Stacker Industry Product Developments
Recent product innovations focus on enhancing efficiency, safety, and sustainability. Manufacturers are incorporating advanced technologies such as automated stacking systems, telematics for remote monitoring, and emission reduction features. These developments are tailored to meet the increasing demand for higher productivity and lower operational costs while addressing environmental concerns. The market fit for these innovations is strong, driven by the need for optimized logistics and enhanced port efficiency.
Report Scope & Segmentation Analysis
This report provides a comprehensive segmentation analysis of the Reach Stacker market based on application (Sea Ports, Industrial), tonnage (Low, Medium, High), and powertrain type (IC Engine, Hybrid). Each segment is analyzed in terms of market size, growth projections, and competitive dynamics. The Sea Ports segment is projected to witness the highest growth rate, driven by expanding global trade and port modernization efforts. The Medium tonnage segment is expected to dominate in terms of market share. Similarly, the IC engine powertrain type is likely to dominate until the end of the forecast period due to cost-effectiveness, despite an increase in the hybrid powertrain segment.
Key Drivers of Reach Stacker Industry Growth
The Reach Stacker industry's growth is primarily driven by the expansion of global trade, increasing containerization, and infrastructural development in ports and industrial facilities. Technological advancements, such as automation and electric/hybrid powertrains, are further boosting market growth. Favorable government policies and regulations aimed at improving logistics efficiency contribute significantly to the industry's expansion.
Challenges in the Reach Stacker Industry Sector
Significant challenges include the high initial investment costs associated with advanced reach stackers, supply chain disruptions impacting the availability of components, and intense competition among manufacturers. Stringent emission regulations and rising fuel costs add to the operational expenses. These factors can impact profitability and hinder market expansion.
Emerging Opportunities in Reach Stacker Industry
Emerging opportunities lie in the adoption of automation, remote operation technologies, and the increasing demand for electric and hybrid reach stackers. Expansion into new markets, particularly in developing economies with growing port infrastructure, presents significant growth potential. Focus on developing specialized reach stackers for niche applications offers further avenues for market expansion.
Leading Players in the Reach Stacker Industry Market
- Konecranes
- Sany Group
- Hyster
- SMV Global
- Liebherr Group
- Toyota
- Kalmar Group
- CVS Ferrari S P A
- Terex
Key Developments in Reach Stacker Industry Industry
- January 2023: Konecranes launched a new generation of electric reach stackers with enhanced efficiency and reduced environmental impact.
- June 2022: Hyster announced a strategic partnership to expand its reach stacker distribution network in Southeast Asia.
- October 2021: Liebherr Group introduced a new hybrid reach stacker model, combining IC engine and electric powertrains. (Further developments will be added to the final report)
Strategic Outlook for Reach Stacker Industry Market
The Reach Stacker market is poised for continued growth, driven by technological advancements, infrastructural development, and increasing globalization. The focus on sustainability, automation, and enhanced safety features will shape future market trends. Expansion into emerging markets and strategic partnerships will play a crucial role in determining the success of key players in the coming years. The overall market outlook is positive, with significant growth potential in the forecast period.
Reach Stacker Industry Segmentation
-
1. Application
- 1.1. Sea Ports
- 1.2. Industrial
-
2. Tonnage
- 2.1. Low
- 2.2. Medium
- 2.3. High
-
3. Power Train Type
- 3.1. IC Engine
- 3.2. Hybrid
Reach Stacker Industry Segmentation By Geography
- 1. United States
- 2. Canada
- 3. Rest of North America
- 4. Germany
- 5. United Kingdom
- 6. France
- 7. Italy
- 8. Rest of Europe
- 9. China
- 10. India
- 11. Japan
- 12. South Korea
- 13. Rest of Asia Pacific
- 14. Mexico
- 15. Brazil
- 16. United Arab Emirates
- 17. Other Countries
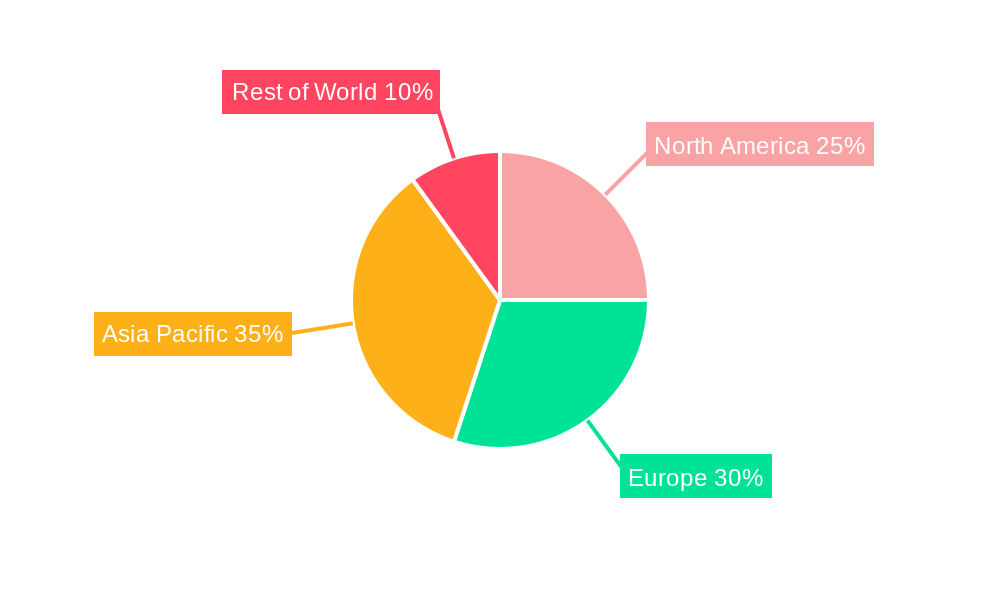
Reach Stacker Industry Regional Market Share
Geographic Coverage of Reach Stacker Industry
Reach Stacker Industry REPORT HIGHLIGHTS
| Aspects | Details |
|---|---|
| Study Period | 2020-2034 |
| Base Year | 2025 |
| Estimated Year | 2026 |
| Forecast Period | 2026-2034 |
| Historical Period | 2020-2025 |
| Growth Rate | CAGR of 6.9% from 2020-2034 |
| Segmentation |
|
Table of Contents
- 1. Introduction
- 1.1. Research Scope
- 1.2. Market Segmentation
- 1.3. Research Objective
- 1.4. Definitions and Assumptions
- 2. Executive Summary
- 2.1. Market Snapshot
- 3. Market Dynamics
- 3.1. Market Drivers
- 3.2. Market Restrains
- 3.3. Market Trends
- 3.4. Market Opportunities
- 4. Market Factor Analysis
- 4.1. Porters Five Forces
- 4.1.1. Bargaining Power of Suppliers
- 4.1.2. Bargaining Power of Buyers
- 4.1.3. Threat of New Entrants
- 4.1.4. Threat of Substitutes
- 4.1.5. Competitive Rivalry
- 4.2. PESTEL analysis
- 4.3. BCG Analysis
- 4.3.1. Stars (High Growth, High Market Share)
- 4.3.2. Cash Cows (Low Growth, High Market Share)
- 4.3.3. Question Mark (High Growth, Low Market Share)
- 4.3.4. Dogs (Low Growth, Low Market Share)
- 4.4. Ansoff Matrix Analysis
- 4.5. Supply Chain Analysis
- 4.6. Regulatory Landscape
- 4.7. Current Market Potential and Opportunity Assessment (TAM–SAM–SOM Framework)
- 4.8. RAX Analyst Note
- 4.1. Porters Five Forces
- 5. Market Analysis, Insights and Forecast 2021-2033
- 5.1. Market Analysis, Insights and Forecast - by Application
- 5.1.1. Sea Ports
- 5.1.2. Industrial
- 5.2. Market Analysis, Insights and Forecast - by Tonnage
- 5.2.1. Low
- 5.2.2. Medium
- 5.2.3. High
- 5.3. Market Analysis, Insights and Forecast - by Power Train Type
- 5.3.1. IC Engine
- 5.3.2. Hybrid
- 5.4. Market Analysis, Insights and Forecast - by Region
- 5.4.1. United States
- 5.4.2. Canada
- 5.4.3. Rest of North America
- 5.4.4. Germany
- 5.4.5. United Kingdom
- 5.4.6. France
- 5.4.7. Italy
- 5.4.8. Rest of Europe
- 5.4.9. China
- 5.4.10. India
- 5.4.11. Japan
- 5.4.12. South Korea
- 5.4.13. Rest of Asia Pacific
- 5.4.14. Mexico
- 5.4.15. Brazil
- 5.4.16. United Arab Emirates
- 5.4.17. Other Countries
- 5.1. Market Analysis, Insights and Forecast - by Application
- 6. Global Reach Stacker Industry Analysis, Insights and Forecast, 2021-2033
- 6.1. Market Analysis, Insights and Forecast - by Application
- 6.1.1. Sea Ports
- 6.1.2. Industrial
- 6.2. Market Analysis, Insights and Forecast - by Tonnage
- 6.2.1. Low
- 6.2.2. Medium
- 6.2.3. High
- 6.3. Market Analysis, Insights and Forecast - by Power Train Type
- 6.3.1. IC Engine
- 6.3.2. Hybrid
- 6.1. Market Analysis, Insights and Forecast - by Application
- 7. United States Reach Stacker Industry Analysis, Insights and Forecast, 2020-2032
- 7.1. Market Analysis, Insights and Forecast - by Application
- 7.1.1. Sea Ports
- 7.1.2. Industrial
- 7.2. Market Analysis, Insights and Forecast - by Tonnage
- 7.2.1. Low
- 7.2.2. Medium
- 7.2.3. High
- 7.3. Market Analysis, Insights and Forecast - by Power Train Type
- 7.3.1. IC Engine
- 7.3.2. Hybrid
- 7.1. Market Analysis, Insights and Forecast - by Application
- 8. Canada Reach Stacker Industry Analysis, Insights and Forecast, 2020-2032
- 8.1. Market Analysis, Insights and Forecast - by Application
- 8.1.1. Sea Ports
- 8.1.2. Industrial
- 8.2. Market Analysis, Insights and Forecast - by Tonnage
- 8.2.1. Low
- 8.2.2. Medium
- 8.2.3. High
- 8.3. Market Analysis, Insights and Forecast - by Power Train Type
- 8.3.1. IC Engine
- 8.3.2. Hybrid
- 8.1. Market Analysis, Insights and Forecast - by Application
- 9. Rest of North America Reach Stacker Industry Analysis, Insights and Forecast, 2020-2032
- 9.1. Market Analysis, Insights and Forecast - by Application
- 9.1.1. Sea Ports
- 9.1.2. Industrial
- 9.2. Market Analysis, Insights and Forecast - by Tonnage
- 9.2.1. Low
- 9.2.2. Medium
- 9.2.3. High
- 9.3. Market Analysis, Insights and Forecast - by Power Train Type
- 9.3.1. IC Engine
- 9.3.2. Hybrid
- 9.1. Market Analysis, Insights and Forecast - by Application
- 10. Germany Reach Stacker Industry Analysis, Insights and Forecast, 2020-2032
- 10.1. Market Analysis, Insights and Forecast - by Application
- 10.1.1. Sea Ports
- 10.1.2. Industrial
- 10.2. Market Analysis, Insights and Forecast - by Tonnage
- 10.2.1. Low
- 10.2.2. Medium
- 10.2.3. High
- 10.3. Market Analysis, Insights and Forecast - by Power Train Type
- 10.3.1. IC Engine
- 10.3.2. Hybrid
- 10.1. Market Analysis, Insights and Forecast - by Application
- 11. United Kingdom Reach Stacker Industry Analysis, Insights and Forecast, 2020-2032
- 11.1. Market Analysis, Insights and Forecast - by Application
- 11.1.1. Sea Ports
- 11.1.2. Industrial
- 11.2. Market Analysis, Insights and Forecast - by Tonnage
- 11.2.1. Low
- 11.2.2. Medium
- 11.2.3. High
- 11.3. Market Analysis, Insights and Forecast - by Power Train Type
- 11.3.1. IC Engine
- 11.3.2. Hybrid
- 11.1. Market Analysis, Insights and Forecast - by Application
- 12. France Reach Stacker Industry Analysis, Insights and Forecast, 2020-2032
- 12.1. Market Analysis, Insights and Forecast - by Application
- 12.1.1. Sea Ports
- 12.1.2. Industrial
- 12.2. Market Analysis, Insights and Forecast - by Tonnage
- 12.2.1. Low
- 12.2.2. Medium
- 12.2.3. High
- 12.3. Market Analysis, Insights and Forecast - by Power Train Type
- 12.3.1. IC Engine
- 12.3.2. Hybrid
- 12.1. Market Analysis, Insights and Forecast - by Application
- 13. Italy Reach Stacker Industry Analysis, Insights and Forecast, 2020-2032
- 13.1. Market Analysis, Insights and Forecast - by Application
- 13.1.1. Sea Ports
- 13.1.2. Industrial
- 13.2. Market Analysis, Insights and Forecast - by Tonnage
- 13.2.1. Low
- 13.2.2. Medium
- 13.2.3. High
- 13.3. Market Analysis, Insights and Forecast - by Power Train Type
- 13.3.1. IC Engine
- 13.3.2. Hybrid
- 13.1. Market Analysis, Insights and Forecast - by Application
- 14. Rest of Europe Reach Stacker Industry Analysis, Insights and Forecast, 2020-2032
- 14.1. Market Analysis, Insights and Forecast - by Application
- 14.1.1. Sea Ports
- 14.1.2. Industrial
- 14.2. Market Analysis, Insights and Forecast - by Tonnage
- 14.2.1. Low
- 14.2.2. Medium
- 14.2.3. High
- 14.3. Market Analysis, Insights and Forecast - by Power Train Type
- 14.3.1. IC Engine
- 14.3.2. Hybrid
- 14.1. Market Analysis, Insights and Forecast - by Application
- 15. China Reach Stacker Industry Analysis, Insights and Forecast, 2020-2032
- 15.1. Market Analysis, Insights and Forecast - by Application
- 15.1.1. Sea Ports
- 15.1.2. Industrial
- 15.2. Market Analysis, Insights and Forecast - by Tonnage
- 15.2.1. Low
- 15.2.2. Medium
- 15.2.3. High
- 15.3. Market Analysis, Insights and Forecast - by Power Train Type
- 15.3.1. IC Engine
- 15.3.2. Hybrid
- 15.1. Market Analysis, Insights and Forecast - by Application
- 16. India Reach Stacker Industry Analysis, Insights and Forecast, 2020-2032
- 16.1. Market Analysis, Insights and Forecast - by Application
- 16.1.1. Sea Ports
- 16.1.2. Industrial
- 16.2. Market Analysis, Insights and Forecast - by Tonnage
- 16.2.1. Low
- 16.2.2. Medium
- 16.2.3. High
- 16.3. Market Analysis, Insights and Forecast - by Power Train Type
- 16.3.1. IC Engine
- 16.3.2. Hybrid
- 16.1. Market Analysis, Insights and Forecast - by Application
- 17. Japan Reach Stacker Industry Analysis, Insights and Forecast, 2020-2032
- 17.1. Market Analysis, Insights and Forecast - by Application
- 17.1.1. Sea Ports
- 17.1.2. Industrial
- 17.2. Market Analysis, Insights and Forecast - by Tonnage
- 17.2.1. Low
- 17.2.2. Medium
- 17.2.3. High
- 17.3. Market Analysis, Insights and Forecast - by Power Train Type
- 17.3.1. IC Engine
- 17.3.2. Hybrid
- 17.1. Market Analysis, Insights and Forecast - by Application
- 18. South Korea Reach Stacker Industry Analysis, Insights and Forecast, 2020-2032
- 18.1. Market Analysis, Insights and Forecast - by Application
- 18.1.1. Sea Ports
- 18.1.2. Industrial
- 18.2. Market Analysis, Insights and Forecast - by Tonnage
- 18.2.1. Low
- 18.2.2. Medium
- 18.2.3. High
- 18.3. Market Analysis, Insights and Forecast - by Power Train Type
- 18.3.1. IC Engine
- 18.3.2. Hybrid
- 18.1. Market Analysis, Insights and Forecast - by Application
- 19. Rest of Asia Pacific Reach Stacker Industry Analysis, Insights and Forecast, 2020-2032
- 19.1. Market Analysis, Insights and Forecast - by Application
- 19.1.1. Sea Ports
- 19.1.2. Industrial
- 19.2. Market Analysis, Insights and Forecast - by Tonnage
- 19.2.1. Low
- 19.2.2. Medium
- 19.2.3. High
- 19.3. Market Analysis, Insights and Forecast - by Power Train Type
- 19.3.1. IC Engine
- 19.3.2. Hybrid
- 19.1. Market Analysis, Insights and Forecast - by Application
- 20. Mexico Reach Stacker Industry Analysis, Insights and Forecast, 2020-2032
- 20.1. Market Analysis, Insights and Forecast - by Application
- 20.1.1. Sea Ports
- 20.1.2. Industrial
- 20.2. Market Analysis, Insights and Forecast - by Tonnage
- 20.2.1. Low
- 20.2.2. Medium
- 20.2.3. High
- 20.3. Market Analysis, Insights and Forecast - by Power Train Type
- 20.3.1. IC Engine
- 20.3.2. Hybrid
- 20.1. Market Analysis, Insights and Forecast - by Application
- 21. Brazil Reach Stacker Industry Analysis, Insights and Forecast, 2020-2032
- 21.1. Market Analysis, Insights and Forecast - by Application
- 21.1.1. Sea Ports
- 21.1.2. Industrial
- 21.2. Market Analysis, Insights and Forecast - by Tonnage
- 21.2.1. Low
- 21.2.2. Medium
- 21.2.3. High
- 21.3. Market Analysis, Insights and Forecast - by Power Train Type
- 21.3.1. IC Engine
- 21.3.2. Hybrid
- 21.1. Market Analysis, Insights and Forecast - by Application
- 22. United Arab Emirates Reach Stacker Industry Analysis, Insights and Forecast, 2020-2032
- 22.1. Market Analysis, Insights and Forecast - by Application
- 22.1.1. Sea Ports
- 22.1.2. Industrial
- 22.2. Market Analysis, Insights and Forecast - by Tonnage
- 22.2.1. Low
- 22.2.2. Medium
- 22.2.3. High
- 22.3. Market Analysis, Insights and Forecast - by Power Train Type
- 22.3.1. IC Engine
- 22.3.2. Hybrid
- 22.1. Market Analysis, Insights and Forecast - by Application
- 23. Other Countries Reach Stacker Industry Analysis, Insights and Forecast, 2020-2032
- 23.1. Market Analysis, Insights and Forecast - by Application
- 23.1.1. Sea Ports
- 23.1.2. Industrial
- 23.2. Market Analysis, Insights and Forecast - by Tonnage
- 23.2.1. Low
- 23.2.2. Medium
- 23.2.3. High
- 23.3. Market Analysis, Insights and Forecast - by Power Train Type
- 23.3.1. IC Engine
- 23.3.2. Hybrid
- 23.1. Market Analysis, Insights and Forecast - by Application
- 24. Competitive Analysis
- 24.1. Company Profiles
- 24.1.1 Konecranes
- 24.1.1.1. Company Overview
- 24.1.1.2. Products
- 24.1.1.3. Company Financials
- 24.1.1.4. SWOT Analysis
- 24.1.2 Sany Group
- 24.1.2.1. Company Overview
- 24.1.2.2. Products
- 24.1.2.3. Company Financials
- 24.1.2.4. SWOT Analysis
- 24.1.3 Hyster
- 24.1.3.1. Company Overview
- 24.1.3.2. Products
- 24.1.3.3. Company Financials
- 24.1.3.4. SWOT Analysis
- 24.1.4 SMV Global
- 24.1.4.1. Company Overview
- 24.1.4.2. Products
- 24.1.4.3. Company Financials
- 24.1.4.4. SWOT Analysis
- 24.1.5 Liebherr Group
- 24.1.5.1. Company Overview
- 24.1.5.2. Products
- 24.1.5.3. Company Financials
- 24.1.5.4. SWOT Analysis
- 24.1.6 Toyota*List Not Exhaustive
- 24.1.6.1. Company Overview
- 24.1.6.2. Products
- 24.1.6.3. Company Financials
- 24.1.6.4. SWOT Analysis
- 24.1.7 Kalmar Group
- 24.1.7.1. Company Overview
- 24.1.7.2. Products
- 24.1.7.3. Company Financials
- 24.1.7.4. SWOT Analysis
- 24.1.8 CVS Ferrari S P A
- 24.1.8.1. Company Overview
- 24.1.8.2. Products
- 24.1.8.3. Company Financials
- 24.1.8.4. SWOT Analysis
- 24.1.9 Terex
- 24.1.9.1. Company Overview
- 24.1.9.2. Products
- 24.1.9.3. Company Financials
- 24.1.9.4. SWOT Analysis
- 24.1.1 Konecranes
- 24.2. Market Entropy
- 24.2.1 Company's Key Areas Served
- 24.2.2 Recent Developments
- 24.3. Company Market Share Analysis 2025
- 24.3.1 Top 5 Companies Market Share Analysis
- 24.3.2 Top 3 Companies Market Share Analysis
- 24.4. List of Potential Customers
- 25. Research Methodology
List of Figures
- Figure 1: Global Reach Stacker Industry Revenue Breakdown (billion, %) by Region 2025 & 2033
- Figure 2: United States Reach Stacker Industry Revenue (billion), by Application 2025 & 2033
- Figure 3: United States Reach Stacker Industry Revenue Share (%), by Application 2025 & 2033
- Figure 4: United States Reach Stacker Industry Revenue (billion), by Tonnage 2025 & 2033
- Figure 5: United States Reach Stacker Industry Revenue Share (%), by Tonnage 2025 & 2033
- Figure 6: United States Reach Stacker Industry Revenue (billion), by Power Train Type 2025 & 2033
- Figure 7: United States Reach Stacker Industry Revenue Share (%), by Power Train Type 2025 & 2033
- Figure 8: United States Reach Stacker Industry Revenue (billion), by Country 2025 & 2033
- Figure 9: United States Reach Stacker Industry Revenue Share (%), by Country 2025 & 2033
- Figure 10: Canada Reach Stacker Industry Revenue (billion), by Application 2025 & 2033
- Figure 11: Canada Reach Stacker Industry Revenue Share (%), by Application 2025 & 2033
- Figure 12: Canada Reach Stacker Industry Revenue (billion), by Tonnage 2025 & 2033
- Figure 13: Canada Reach Stacker Industry Revenue Share (%), by Tonnage 2025 & 2033
- Figure 14: Canada Reach Stacker Industry Revenue (billion), by Power Train Type 2025 & 2033
- Figure 15: Canada Reach Stacker Industry Revenue Share (%), by Power Train Type 2025 & 2033
- Figure 16: Canada Reach Stacker Industry Revenue (billion), by Country 2025 & 2033
- Figure 17: Canada Reach Stacker Industry Revenue Share (%), by Country 2025 & 2033
- Figure 18: Rest of North America Reach Stacker Industry Revenue (billion), by Application 2025 & 2033
- Figure 19: Rest of North America Reach Stacker Industry Revenue Share (%), by Application 2025 & 2033
- Figure 20: Rest of North America Reach Stacker Industry Revenue (billion), by Tonnage 2025 & 2033
- Figure 21: Rest of North America Reach Stacker Industry Revenue Share (%), by Tonnage 2025 & 2033
- Figure 22: Rest of North America Reach Stacker Industry Revenue (billion), by Power Train Type 2025 & 2033
- Figure 23: Rest of North America Reach Stacker Industry Revenue Share (%), by Power Train Type 2025 & 2033
- Figure 24: Rest of North America Reach Stacker Industry Revenue (billion), by Country 2025 & 2033
- Figure 25: Rest of North America Reach Stacker Industry Revenue Share (%), by Country 2025 & 2033
- Figure 26: Germany Reach Stacker Industry Revenue (billion), by Application 2025 & 2033
- Figure 27: Germany Reach Stacker Industry Revenue Share (%), by Application 2025 & 2033
- Figure 28: Germany Reach Stacker Industry Revenue (billion), by Tonnage 2025 & 2033
- Figure 29: Germany Reach Stacker Industry Revenue Share (%), by Tonnage 2025 & 2033
- Figure 30: Germany Reach Stacker Industry Revenue (billion), by Power Train Type 2025 & 2033
- Figure 31: Germany Reach Stacker Industry Revenue Share (%), by Power Train Type 2025 & 2033
- Figure 32: Germany Reach Stacker Industry Revenue (billion), by Country 2025 & 2033
- Figure 33: Germany Reach Stacker Industry Revenue Share (%), by Country 2025 & 2033
- Figure 34: United Kingdom Reach Stacker Industry Revenue (billion), by Application 2025 & 2033
- Figure 35: United Kingdom Reach Stacker Industry Revenue Share (%), by Application 2025 & 2033
- Figure 36: United Kingdom Reach Stacker Industry Revenue (billion), by Tonnage 2025 & 2033
- Figure 37: United Kingdom Reach Stacker Industry Revenue Share (%), by Tonnage 2025 & 2033
- Figure 38: United Kingdom Reach Stacker Industry Revenue (billion), by Power Train Type 2025 & 2033
- Figure 39: United Kingdom Reach Stacker Industry Revenue Share (%), by Power Train Type 2025 & 2033
- Figure 40: United Kingdom Reach Stacker Industry Revenue (billion), by Country 2025 & 2033
- Figure 41: United Kingdom Reach Stacker Industry Revenue Share (%), by Country 2025 & 2033
- Figure 42: France Reach Stacker Industry Revenue (billion), by Application 2025 & 2033
- Figure 43: France Reach Stacker Industry Revenue Share (%), by Application 2025 & 2033
- Figure 44: France Reach Stacker Industry Revenue (billion), by Tonnage 2025 & 2033
- Figure 45: France Reach Stacker Industry Revenue Share (%), by Tonnage 2025 & 2033
- Figure 46: France Reach Stacker Industry Revenue (billion), by Power Train Type 2025 & 2033
- Figure 47: France Reach Stacker Industry Revenue Share (%), by Power Train Type 2025 & 2033
- Figure 48: France Reach Stacker Industry Revenue (billion), by Country 2025 & 2033
- Figure 49: France Reach Stacker Industry Revenue Share (%), by Country 2025 & 2033
- Figure 50: Italy Reach Stacker Industry Revenue (billion), by Application 2025 & 2033
- Figure 51: Italy Reach Stacker Industry Revenue Share (%), by Application 2025 & 2033
- Figure 52: Italy Reach Stacker Industry Revenue (billion), by Tonnage 2025 & 2033
- Figure 53: Italy Reach Stacker Industry Revenue Share (%), by Tonnage 2025 & 2033
- Figure 54: Italy Reach Stacker Industry Revenue (billion), by Power Train Type 2025 & 2033
- Figure 55: Italy Reach Stacker Industry Revenue Share (%), by Power Train Type 2025 & 2033
- Figure 56: Italy Reach Stacker Industry Revenue (billion), by Country 2025 & 2033
- Figure 57: Italy Reach Stacker Industry Revenue Share (%), by Country 2025 & 2033
- Figure 58: Rest of Europe Reach Stacker Industry Revenue (billion), by Application 2025 & 2033
- Figure 59: Rest of Europe Reach Stacker Industry Revenue Share (%), by Application 2025 & 2033
- Figure 60: Rest of Europe Reach Stacker Industry Revenue (billion), by Tonnage 2025 & 2033
- Figure 61: Rest of Europe Reach Stacker Industry Revenue Share (%), by Tonnage 2025 & 2033
- Figure 62: Rest of Europe Reach Stacker Industry Revenue (billion), by Power Train Type 2025 & 2033
- Figure 63: Rest of Europe Reach Stacker Industry Revenue Share (%), by Power Train Type 2025 & 2033
- Figure 64: Rest of Europe Reach Stacker Industry Revenue (billion), by Country 2025 & 2033
- Figure 65: Rest of Europe Reach Stacker Industry Revenue Share (%), by Country 2025 & 2033
- Figure 66: China Reach Stacker Industry Revenue (billion), by Application 2025 & 2033
- Figure 67: China Reach Stacker Industry Revenue Share (%), by Application 2025 & 2033
- Figure 68: China Reach Stacker Industry Revenue (billion), by Tonnage 2025 & 2033
- Figure 69: China Reach Stacker Industry Revenue Share (%), by Tonnage 2025 & 2033
- Figure 70: China Reach Stacker Industry Revenue (billion), by Power Train Type 2025 & 2033
- Figure 71: China Reach Stacker Industry Revenue Share (%), by Power Train Type 2025 & 2033
- Figure 72: China Reach Stacker Industry Revenue (billion), by Country 2025 & 2033
- Figure 73: China Reach Stacker Industry Revenue Share (%), by Country 2025 & 2033
- Figure 74: India Reach Stacker Industry Revenue (billion), by Application 2025 & 2033
- Figure 75: India Reach Stacker Industry Revenue Share (%), by Application 2025 & 2033
- Figure 76: India Reach Stacker Industry Revenue (billion), by Tonnage 2025 & 2033
- Figure 77: India Reach Stacker Industry Revenue Share (%), by Tonnage 2025 & 2033
- Figure 78: India Reach Stacker Industry Revenue (billion), by Power Train Type 2025 & 2033
- Figure 79: India Reach Stacker Industry Revenue Share (%), by Power Train Type 2025 & 2033
- Figure 80: India Reach Stacker Industry Revenue (billion), by Country 2025 & 2033
- Figure 81: India Reach Stacker Industry Revenue Share (%), by Country 2025 & 2033
- Figure 82: Japan Reach Stacker Industry Revenue (billion), by Application 2025 & 2033
- Figure 83: Japan Reach Stacker Industry Revenue Share (%), by Application 2025 & 2033
- Figure 84: Japan Reach Stacker Industry Revenue (billion), by Tonnage 2025 & 2033
- Figure 85: Japan Reach Stacker Industry Revenue Share (%), by Tonnage 2025 & 2033
- Figure 86: Japan Reach Stacker Industry Revenue (billion), by Power Train Type 2025 & 2033
- Figure 87: Japan Reach Stacker Industry Revenue Share (%), by Power Train Type 2025 & 2033
- Figure 88: Japan Reach Stacker Industry Revenue (billion), by Country 2025 & 2033
- Figure 89: Japan Reach Stacker Industry Revenue Share (%), by Country 2025 & 2033
- Figure 90: South Korea Reach Stacker Industry Revenue (billion), by Application 2025 & 2033
- Figure 91: South Korea Reach Stacker Industry Revenue Share (%), by Application 2025 & 2033
- Figure 92: South Korea Reach Stacker Industry Revenue (billion), by Tonnage 2025 & 2033
- Figure 93: South Korea Reach Stacker Industry Revenue Share (%), by Tonnage 2025 & 2033
- Figure 94: South Korea Reach Stacker Industry Revenue (billion), by Power Train Type 2025 & 2033
- Figure 95: South Korea Reach Stacker Industry Revenue Share (%), by Power Train Type 2025 & 2033
- Figure 96: South Korea Reach Stacker Industry Revenue (billion), by Country 2025 & 2033
- Figure 97: South Korea Reach Stacker Industry Revenue Share (%), by Country 2025 & 2033
- Figure 98: Rest of Asia Pacific Reach Stacker Industry Revenue (billion), by Application 2025 & 2033
- Figure 99: Rest of Asia Pacific Reach Stacker Industry Revenue Share (%), by Application 2025 & 2033
- Figure 100: Rest of Asia Pacific Reach Stacker Industry Revenue (billion), by Tonnage 2025 & 2033
- Figure 101: Rest of Asia Pacific Reach Stacker Industry Revenue Share (%), by Tonnage 2025 & 2033
- Figure 102: Rest of Asia Pacific Reach Stacker Industry Revenue (billion), by Power Train Type 2025 & 2033
- Figure 103: Rest of Asia Pacific Reach Stacker Industry Revenue Share (%), by Power Train Type 2025 & 2033
- Figure 104: Rest of Asia Pacific Reach Stacker Industry Revenue (billion), by Country 2025 & 2033
- Figure 105: Rest of Asia Pacific Reach Stacker Industry Revenue Share (%), by Country 2025 & 2033
- Figure 106: Mexico Reach Stacker Industry Revenue (billion), by Application 2025 & 2033
- Figure 107: Mexico Reach Stacker Industry Revenue Share (%), by Application 2025 & 2033
- Figure 108: Mexico Reach Stacker Industry Revenue (billion), by Tonnage 2025 & 2033
- Figure 109: Mexico Reach Stacker Industry Revenue Share (%), by Tonnage 2025 & 2033
- Figure 110: Mexico Reach Stacker Industry Revenue (billion), by Power Train Type 2025 & 2033
- Figure 111: Mexico Reach Stacker Industry Revenue Share (%), by Power Train Type 2025 & 2033
- Figure 112: Mexico Reach Stacker Industry Revenue (billion), by Country 2025 & 2033
- Figure 113: Mexico Reach Stacker Industry Revenue Share (%), by Country 2025 & 2033
- Figure 114: Brazil Reach Stacker Industry Revenue (billion), by Application 2025 & 2033
- Figure 115: Brazil Reach Stacker Industry Revenue Share (%), by Application 2025 & 2033
- Figure 116: Brazil Reach Stacker Industry Revenue (billion), by Tonnage 2025 & 2033
- Figure 117: Brazil Reach Stacker Industry Revenue Share (%), by Tonnage 2025 & 2033
- Figure 118: Brazil Reach Stacker Industry Revenue (billion), by Power Train Type 2025 & 2033
- Figure 119: Brazil Reach Stacker Industry Revenue Share (%), by Power Train Type 2025 & 2033
- Figure 120: Brazil Reach Stacker Industry Revenue (billion), by Country 2025 & 2033
- Figure 121: Brazil Reach Stacker Industry Revenue Share (%), by Country 2025 & 2033
- Figure 122: United Arab Emirates Reach Stacker Industry Revenue (billion), by Application 2025 & 2033
- Figure 123: United Arab Emirates Reach Stacker Industry Revenue Share (%), by Application 2025 & 2033
- Figure 124: United Arab Emirates Reach Stacker Industry Revenue (billion), by Tonnage 2025 & 2033
- Figure 125: United Arab Emirates Reach Stacker Industry Revenue Share (%), by Tonnage 2025 & 2033
- Figure 126: United Arab Emirates Reach Stacker Industry Revenue (billion), by Power Train Type 2025 & 2033
- Figure 127: United Arab Emirates Reach Stacker Industry Revenue Share (%), by Power Train Type 2025 & 2033
- Figure 128: United Arab Emirates Reach Stacker Industry Revenue (billion), by Country 2025 & 2033
- Figure 129: United Arab Emirates Reach Stacker Industry Revenue Share (%), by Country 2025 & 2033
- Figure 130: Other Countries Reach Stacker Industry Revenue (billion), by Application 2025 & 2033
- Figure 131: Other Countries Reach Stacker Industry Revenue Share (%), by Application 2025 & 2033
- Figure 132: Other Countries Reach Stacker Industry Revenue (billion), by Tonnage 2025 & 2033
- Figure 133: Other Countries Reach Stacker Industry Revenue Share (%), by Tonnage 2025 & 2033
- Figure 134: Other Countries Reach Stacker Industry Revenue (billion), by Power Train Type 2025 & 2033
- Figure 135: Other Countries Reach Stacker Industry Revenue Share (%), by Power Train Type 2025 & 2033
- Figure 136: Other Countries Reach Stacker Industry Revenue (billion), by Country 2025 & 2033
- Figure 137: Other Countries Reach Stacker Industry Revenue Share (%), by Country 2025 & 2033
List of Tables
- Table 1: Global Reach Stacker Industry Revenue billion Forecast, by Application 2020 & 2033
- Table 2: Global Reach Stacker Industry Revenue billion Forecast, by Tonnage 2020 & 2033
- Table 3: Global Reach Stacker Industry Revenue billion Forecast, by Power Train Type 2020 & 2033
- Table 4: Global Reach Stacker Industry Revenue billion Forecast, by Region 2020 & 2033
- Table 5: Global Reach Stacker Industry Revenue billion Forecast, by Application 2020 & 2033
- Table 6: Global Reach Stacker Industry Revenue billion Forecast, by Tonnage 2020 & 2033
- Table 7: Global Reach Stacker Industry Revenue billion Forecast, by Power Train Type 2020 & 2033
- Table 8: Global Reach Stacker Industry Revenue billion Forecast, by Country 2020 & 2033
- Table 9: Global Reach Stacker Industry Revenue billion Forecast, by Application 2020 & 2033
- Table 10: Global Reach Stacker Industry Revenue billion Forecast, by Tonnage 2020 & 2033
- Table 11: Global Reach Stacker Industry Revenue billion Forecast, by Power Train Type 2020 & 2033
- Table 12: Global Reach Stacker Industry Revenue billion Forecast, by Country 2020 & 2033
- Table 13: Global Reach Stacker Industry Revenue billion Forecast, by Application 2020 & 2033
- Table 14: Global Reach Stacker Industry Revenue billion Forecast, by Tonnage 2020 & 2033
- Table 15: Global Reach Stacker Industry Revenue billion Forecast, by Power Train Type 2020 & 2033
- Table 16: Global Reach Stacker Industry Revenue billion Forecast, by Country 2020 & 2033
- Table 17: Global Reach Stacker Industry Revenue billion Forecast, by Application 2020 & 2033
- Table 18: Global Reach Stacker Industry Revenue billion Forecast, by Tonnage 2020 & 2033
- Table 19: Global Reach Stacker Industry Revenue billion Forecast, by Power Train Type 2020 & 2033
- Table 20: Global Reach Stacker Industry Revenue billion Forecast, by Country 2020 & 2033
- Table 21: Global Reach Stacker Industry Revenue billion Forecast, by Application 2020 & 2033
- Table 22: Global Reach Stacker Industry Revenue billion Forecast, by Tonnage 2020 & 2033
- Table 23: Global Reach Stacker Industry Revenue billion Forecast, by Power Train Type 2020 & 2033
- Table 24: Global Reach Stacker Industry Revenue billion Forecast, by Country 2020 & 2033
- Table 25: Global Reach Stacker Industry Revenue billion Forecast, by Application 2020 & 2033
- Table 26: Global Reach Stacker Industry Revenue billion Forecast, by Tonnage 2020 & 2033
- Table 27: Global Reach Stacker Industry Revenue billion Forecast, by Power Train Type 2020 & 2033
- Table 28: Global Reach Stacker Industry Revenue billion Forecast, by Country 2020 & 2033
- Table 29: Global Reach Stacker Industry Revenue billion Forecast, by Application 2020 & 2033
- Table 30: Global Reach Stacker Industry Revenue billion Forecast, by Tonnage 2020 & 2033
- Table 31: Global Reach Stacker Industry Revenue billion Forecast, by Power Train Type 2020 & 2033
- Table 32: Global Reach Stacker Industry Revenue billion Forecast, by Country 2020 & 2033
- Table 33: Global Reach Stacker Industry Revenue billion Forecast, by Application 2020 & 2033
- Table 34: Global Reach Stacker Industry Revenue billion Forecast, by Tonnage 2020 & 2033
- Table 35: Global Reach Stacker Industry Revenue billion Forecast, by Power Train Type 2020 & 2033
- Table 36: Global Reach Stacker Industry Revenue billion Forecast, by Country 2020 & 2033
- Table 37: Global Reach Stacker Industry Revenue billion Forecast, by Application 2020 & 2033
- Table 38: Global Reach Stacker Industry Revenue billion Forecast, by Tonnage 2020 & 2033
- Table 39: Global Reach Stacker Industry Revenue billion Forecast, by Power Train Type 2020 & 2033
- Table 40: Global Reach Stacker Industry Revenue billion Forecast, by Country 2020 & 2033
- Table 41: Global Reach Stacker Industry Revenue billion Forecast, by Application 2020 & 2033
- Table 42: Global Reach Stacker Industry Revenue billion Forecast, by Tonnage 2020 & 2033
- Table 43: Global Reach Stacker Industry Revenue billion Forecast, by Power Train Type 2020 & 2033
- Table 44: Global Reach Stacker Industry Revenue billion Forecast, by Country 2020 & 2033
- Table 45: Global Reach Stacker Industry Revenue billion Forecast, by Application 2020 & 2033
- Table 46: Global Reach Stacker Industry Revenue billion Forecast, by Tonnage 2020 & 2033
- Table 47: Global Reach Stacker Industry Revenue billion Forecast, by Power Train Type 2020 & 2033
- Table 48: Global Reach Stacker Industry Revenue billion Forecast, by Country 2020 & 2033
- Table 49: Global Reach Stacker Industry Revenue billion Forecast, by Application 2020 & 2033
- Table 50: Global Reach Stacker Industry Revenue billion Forecast, by Tonnage 2020 & 2033
- Table 51: Global Reach Stacker Industry Revenue billion Forecast, by Power Train Type 2020 & 2033
- Table 52: Global Reach Stacker Industry Revenue billion Forecast, by Country 2020 & 2033
- Table 53: Global Reach Stacker Industry Revenue billion Forecast, by Application 2020 & 2033
- Table 54: Global Reach Stacker Industry Revenue billion Forecast, by Tonnage 2020 & 2033
- Table 55: Global Reach Stacker Industry Revenue billion Forecast, by Power Train Type 2020 & 2033
- Table 56: Global Reach Stacker Industry Revenue billion Forecast, by Country 2020 & 2033
- Table 57: Global Reach Stacker Industry Revenue billion Forecast, by Application 2020 & 2033
- Table 58: Global Reach Stacker Industry Revenue billion Forecast, by Tonnage 2020 & 2033
- Table 59: Global Reach Stacker Industry Revenue billion Forecast, by Power Train Type 2020 & 2033
- Table 60: Global Reach Stacker Industry Revenue billion Forecast, by Country 2020 & 2033
- Table 61: Global Reach Stacker Industry Revenue billion Forecast, by Application 2020 & 2033
- Table 62: Global Reach Stacker Industry Revenue billion Forecast, by Tonnage 2020 & 2033
- Table 63: Global Reach Stacker Industry Revenue billion Forecast, by Power Train Type 2020 & 2033
- Table 64: Global Reach Stacker Industry Revenue billion Forecast, by Country 2020 & 2033
- Table 65: Global Reach Stacker Industry Revenue billion Forecast, by Application 2020 & 2033
- Table 66: Global Reach Stacker Industry Revenue billion Forecast, by Tonnage 2020 & 2033
- Table 67: Global Reach Stacker Industry Revenue billion Forecast, by Power Train Type 2020 & 2033
- Table 68: Global Reach Stacker Industry Revenue billion Forecast, by Country 2020 & 2033
- Table 69: Global Reach Stacker Industry Revenue billion Forecast, by Application 2020 & 2033
- Table 70: Global Reach Stacker Industry Revenue billion Forecast, by Tonnage 2020 & 2033
- Table 71: Global Reach Stacker Industry Revenue billion Forecast, by Power Train Type 2020 & 2033
- Table 72: Global Reach Stacker Industry Revenue billion Forecast, by Country 2020 & 2033
Frequently Asked Questions
1. What is the projected Compound Annual Growth Rate (CAGR) of the Reach Stacker Industry?
The projected CAGR is approximately 6.9%.
2. Which companies are prominent players in the Reach Stacker Industry?
Key companies in the market include Konecranes, Sany Group, Hyster, SMV Global, Liebherr Group, Toyota*List Not Exhaustive, Kalmar Group, CVS Ferrari S P A, Terex.
3. What are the main segments of the Reach Stacker Industry?
The market segments include Application, Tonnage, Power Train Type.
4. Can you provide details about the market size?
The market size is estimated to be USD 3.2 billion as of 2022.
5. What are some drivers contributing to market growth?
Diverse Selection Among Car Models is Anticipated to Drive the Market Growth.
6. What are the notable trends driving market growth?
Electric Reach Stacker to Gain Momentum.
7. Are there any restraints impacting market growth?
Counterfeit and Illegally Imported Vehicles are Restraining the Market Growth.
8. Can you provide examples of recent developments in the market?
N/A
9. What pricing options are available for accessing the report?
Pricing options include single-user, multi-user, and enterprise licenses priced at USD 4750, USD 5250, and USD 8750 respectively.
10. Is the market size provided in terms of value or volume?
The market size is provided in terms of value, measured in billion.
11. Are there any specific market keywords associated with the report?
Yes, the market keyword associated with the report is "Reach Stacker Industry," which aids in identifying and referencing the specific market segment covered.
12. How do I determine which pricing option suits my needs best?
The pricing options vary based on user requirements and access needs. Individual users may opt for single-user licenses, while businesses requiring broader access may choose multi-user or enterprise licenses for cost-effective access to the report.
13. Are there any additional resources or data provided in the Reach Stacker Industry report?
While the report offers comprehensive insights, it's advisable to review the specific contents or supplementary materials provided to ascertain if additional resources or data are available.
14. How can I stay updated on further developments or reports in the Reach Stacker Industry?
To stay informed about further developments, trends, and reports in the Reach Stacker Industry, consider subscribing to industry newsletters, following relevant companies and organizations, or regularly checking reputable industry news sources and publications.
Methodology
Step 1 - Identification of Relevant Samples Size from Population Database


Step 2 - Approaches for Defining Global Market Size (Value, Volume* & Price*)

Note*: In applicable scenarios
Step 3 - Data Sources
Primary Research
- Web Analytics
- Survey Reports
- Research Institute
- Latest Research Reports
- Opinion Leaders
Secondary Research
- Annual Reports
- White Paper
- Latest Press Release
- Industry Association
- Paid Database
- Investor Presentations

Step 4 - Data Triangulation
Involves using different sources of information in order to increase the validity of a study
These sources are likely to be stakeholders in a program - participants, other researchers, program staff, other community members, and so on.
Then we put all data in single framework & apply various statistical tools to find out the dynamic on the market.
During the analysis stage, feedback from the stakeholder groups would be compared to determine areas of agreement as well as areas of divergence

