

Key Insights
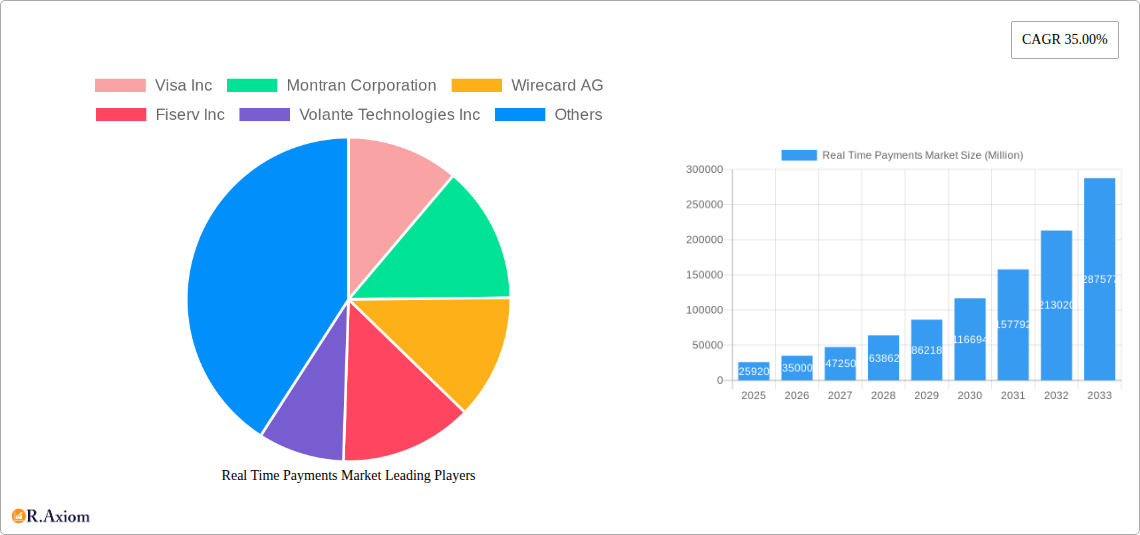
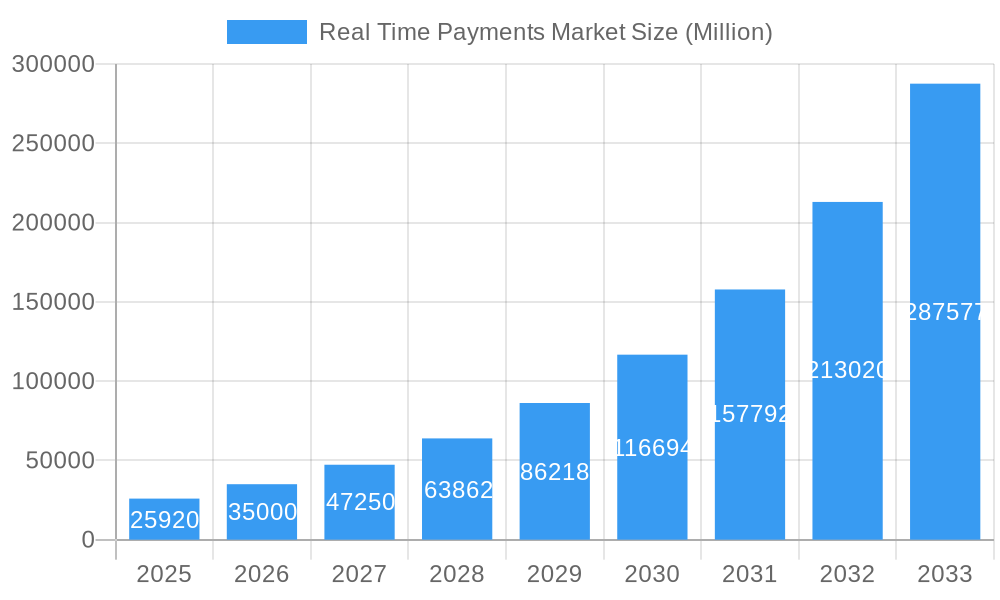
The real-time payments market is experiencing explosive growth, projected to reach $25.92 billion in 2025 and exhibiting a remarkable Compound Annual Growth Rate (CAGR) of 35%. This surge is driven by several key factors. The increasing adoption of mobile banking and digital wallets fuels the demand for instant transactions, bypassing traditional clearing systems. Furthermore, the rising need for faster cross-border payments, coupled with the strengthening regulatory frameworks supporting real-time transactions in various regions, significantly contributes to market expansion. E-commerce's continued dominance and the growing preference for contactless payments further accelerate this trend. The market is segmented primarily by payment type, encompassing Person-to-Person (P2P) and Person-to-Business (P2B) transactions. Major players like Visa, Mastercard, PayPal, and others are actively investing in technological advancements and strategic partnerships to solidify their market position. The competitive landscape is highly dynamic, characterized by continuous innovation and the emergence of new fintech companies.
Real Time Payments Market Market Size (In Billion)
Looking ahead, the forecast period (2025-2033) promises even more robust growth, driven by the increasing penetration of smartphones, enhanced cybersecurity measures, and further technological advancements in payment processing. Regional variations will be significant, with North America and Europe expected to maintain a substantial market share due to early adoption and developed infrastructure. However, the Asia-Pacific region is poised for rapid growth fueled by a large, digitally-savvy population and increasing financial inclusion initiatives. Despite the positive outlook, challenges remain, including the need for robust security protocols to mitigate fraud and the potential for regulatory hurdles in different jurisdictions. Addressing these challenges will be crucial for sustained market expansion and the continued adoption of real-time payment solutions globally.
Real Time Payments Market Company Market Share
This comprehensive report provides an in-depth analysis of the Real Time Payments market, offering valuable insights for stakeholders across the industry. Covering the period 2019-2033, with a base year of 2025 and a forecast period of 2025-2033, this report examines market dynamics, growth drivers, challenges, and emerging opportunities. The market size is projected to reach xx Million by 2033, exhibiting a CAGR of xx% during the forecast period.
Real Time Payments Market Concentration & Innovation
The Real Time Payments market demonstrates a moderately concentrated landscape, with key players such as Visa Inc, Mastercard Inc, and PayPal Holdings Inc holding significant market share. However, the market is also characterized by ongoing innovation, driven by the increasing demand for faster, more secure, and cost-effective payment solutions. Regulatory frameworks, such as PSD2 in Europe and similar initiatives globally, are shaping the competitive landscape and driving innovation. Product substitutes, such as traditional wire transfers, are facing increasing pressure due to the superior speed and convenience of real-time payments. End-user trends show a clear preference for digital and mobile payment solutions, further accelerating the adoption of real-time payment systems. Mergers and acquisitions (M&A) activity in the sector has been significant, with deal values exceeding xx Million in recent years, reflecting the strategic importance of real-time payments for established financial institutions and technology companies.
- Market Share: Visa Inc and Mastercard Inc hold a combined market share of approximately xx%, while PayPal Holdings Inc holds approximately xx%.
- M&A Activity: Significant M&A activity witnessed in the period 2019-2024 with total deal value exceeding xx Million. This includes strategic acquisitions focused on enhancing technology, expanding geographical reach, and strengthening product offerings.
Real Time Payments Market Industry Trends & Insights
The Real Time Payments market is experiencing robust growth, propelled by several key factors. The increasing adoption of smartphones and mobile banking apps, coupled with the growing preference for digital transactions, is driving significant market expansion. Technological advancements, such as the development of advanced APIs and cloud-based solutions, are further enhancing the efficiency and scalability of real-time payment systems. Consumer preferences are shifting towards seamless and instant payment experiences, creating a strong demand for real-time payment solutions across various sectors. The competitive landscape is dynamic, with both established financial institutions and fintech companies vying for market share, leading to continuous innovation and improved services. This competitive environment is expected to drive further market expansion. The market penetration rate is projected to reach xx% by 2033, indicating substantial growth potential.
Dominant Markets & Segments in Real Time Payments Market
The North American region currently dominates the real-time payments market, driven by factors such as strong technological infrastructure, high smartphone penetration, and a well-developed financial ecosystem. Within the payment types, Person-to-Person (P2P) payments currently hold the largest market share, fueled by the widespread adoption of mobile payment apps and social media integration. However, Person-to-Business (P2B) payments are experiencing rapid growth, driven by increasing e-commerce activities and the demand for faster business-to-consumer transactions.
- Key Drivers for North America:
- Robust technological infrastructure.
- High smartphone penetration.
- Well-developed financial ecosystem.
- Favorable regulatory environment.
- Key Drivers for P2P Segment:
- Widespread adoption of mobile payment apps.
- Social media integration.
- Increasing consumer preference for convenient and instant payments.
- Key Drivers for P2B Segment:
- Growth of e-commerce and online businesses.
- Demand for faster and more efficient business-to-consumer payments.
Real Time Payments Market Product Developments
Recent product innovations focus on enhancing security, improving user experience, and expanding functionalities. The integration of biometric authentication, AI-powered fraud detection, and advanced data analytics are enhancing the security of real-time payment systems. User-friendly interfaces and seamless integration with existing financial applications are improving user experience. New functionalities, such as request-to-pay capabilities and cross-border payments, are expanding the applications of real-time payment systems, enhancing market fit and driving growth.
Report Scope & Segmentation Analysis
This report segments the real-time payments market primarily by Type of Payment: P2P and P2B. The P2P segment is further segmented by payment app type (standalone, integrated within social media, etc.), while the P2B segment is categorized by industry verticals (e-commerce, retail, etc.). Each segment is analyzed based on market size, growth projections, and competitive dynamics. For example, the P2P segment is projected to grow at a CAGR of xx% from 2025 to 2033, driven by the increasing adoption of mobile wallets and social commerce platforms. The competitive landscape within each segment is analyzed, highlighting key players, their market strategies, and their competitive advantages.
Key Drivers of Real Time Payments Market Growth
The growth of the real-time payments market is driven by several key factors: rapid technological advancements, supportive government policies and regulations, and the growing need for instant, secure, and cost-effective payment solutions. The widespread adoption of smartphones and mobile banking apps has accelerated the shift towards digital payments, creating a strong demand for real-time payment solutions. Furthermore, supportive government initiatives and regulatory frameworks are encouraging the adoption and expansion of real-time payment systems. The increasing integration of real-time payments into various business processes is further enhancing market growth.
Challenges in the Real Time Payments Market Sector
Despite its strong growth trajectory, the real-time payments market faces several challenges, including ensuring robust security measures to protect against fraud and cyber threats. Addressing cross-border payment complexities and regulatory compliance requirements across different jurisdictions presents significant hurdles. Maintaining interoperability between different real-time payment systems and achieving seamless integration across various platforms remains a challenge. These factors impact the overall cost-effectiveness and scalability of real-time payment solutions.
Emerging Opportunities in Real Time Payments Market
Emerging opportunities lie in expanding into new markets, particularly in developing economies with high mobile penetration rates. Further development of innovative payment solutions tailored for specific industry needs offers significant potential. The growing adoption of open banking APIs and the integration of artificial intelligence (AI) and machine learning (ML) technologies can unlock new growth opportunities. The focus on enhancing user experience and addressing consumer concerns related to security and privacy will drive adoption and market growth.
Leading Players in the Real Time Payments Market Market
- Visa Inc
- Montran Corporation
- Wirecard AG
- Fiserv Inc
- Volante Technologies Inc
- Temenos AG
- FIS Global
- Finastra
- Mastercard Inc
- ACI Worldwide Inc
- Paypal Holdings Inc
Key Developments in Real Time Payments Market Industry
- April 2023: Visa announced a partnership with PayPal and Venmo to pilot Visa+, enabling faster and more secure P2P money transfers between different apps. This significantly expands the reach and interoperability of real-time payment systems.
- April 2023: CRED launched UPI-based P2P payments, offering users a new payment option and increasing competition in the P2P payment space. This enhances convenience for CRED users and contributes to the broader adoption of real-time P2P payments.
Strategic Outlook for Real Time Payments Market Market
The future of the real-time payments market is bright, with continued growth driven by technological advancements, regulatory support, and evolving consumer preferences. The market is poised for further expansion, driven by the increasing adoption of digital payment methods and the growing demand for faster, more secure, and cost-effective payment solutions. Strategic partnerships and collaborations among financial institutions and fintech companies will further accelerate innovation and market expansion. The focus on enhancing security, improving user experience, and addressing cross-border payment challenges will drive future growth.
Real Time Payments Market Segmentation
-
1. Type of Payment
- 1.1. P2P
- 1.2. P2B
Real Time Payments Market Segmentation By Geography
-
1. North America
- 1.1. United States
- 1.2. Canada
-
2. Europe
- 2.1. United Kingdom
- 2.2. Germany
- 2.3. Spain
- 2.4. Sweden
- 2.5. Finland
- 2.6. Rest of Europe
-
3. Asia Pacific
- 3.1. China
- 3.2. India
- 3.3. South Korea
- 3.4. Thailand
- 3.5. Japan
- 3.6. Rest of Asia Pacific
-
4. Latin America
- 4.1. Brazil
- 4.2. Argentina
- 4.3. Colombia
- 4.4. Mexico
- 4.5. Rest of Latin America
-
5. Middle East and Africa
- 5.1. United Arab Emirates
- 5.2. South Africa
- 5.3. Nigeria
- 5.4. Rest of Middle East and Africa
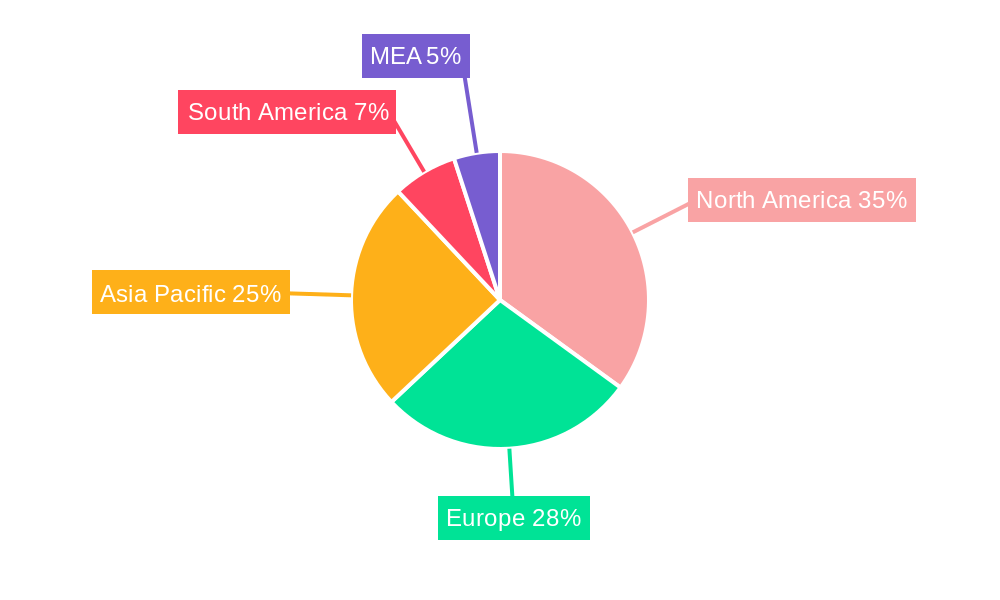
Real Time Payments Market Regional Market Share
Geographic Coverage of Real Time Payments Market
Real Time Payments Market REPORT HIGHLIGHTS
| Aspects | Details |
|---|---|
| Study Period | 2020-2034 |
| Base Year | 2025 |
| Estimated Year | 2026 |
| Forecast Period | 2026-2034 |
| Historical Period | 2020-2025 |
| Growth Rate | CAGR of 35.00% from 2020-2034 |
| Segmentation |
|
Table of Contents
- 1. Introduction
- 1.1. Research Scope
- 1.2. Market Segmentation
- 1.3. Research Objective
- 1.4. Definitions and Assumptions
- 2. Executive Summary
- 2.1. Market Snapshot
- 3. Market Dynamics
- 3.1. Market Drivers
- 3.2. Market Restrains
- 3.3. Market Trends
- 3.4. Market Opportunities
- 4. Market Factor Analysis
- 4.1. Porters Five Forces
- 4.1.1. Bargaining Power of Suppliers
- 4.1.2. Bargaining Power of Buyers
- 4.1.3. Threat of New Entrants
- 4.1.4. Threat of Substitutes
- 4.1.5. Competitive Rivalry
- 4.2. PESTEL analysis
- 4.3. BCG Analysis
- 4.3.1. Stars (High Growth, High Market Share)
- 4.3.2. Cash Cows (Low Growth, High Market Share)
- 4.3.3. Question Mark (High Growth, Low Market Share)
- 4.3.4. Dogs (Low Growth, Low Market Share)
- 4.4. Ansoff Matrix Analysis
- 4.5. Supply Chain Analysis
- 4.6. Regulatory Landscape
- 4.7. Current Market Potential and Opportunity Assessment (TAM–SAM–SOM Framework)
- 4.8. RAX Analyst Note
- 4.1. Porters Five Forces
- 5. Market Analysis, Insights and Forecast 2021-2033
- 5.1. Market Analysis, Insights and Forecast - by Type of Payment
- 5.1.1. P2P
- 5.1.2. P2B
- 5.2. Market Analysis, Insights and Forecast - by Region
- 5.2.1. North America
- 5.2.2. Europe
- 5.2.3. Asia Pacific
- 5.2.4. Latin America
- 5.2.5. Middle East and Africa
- 5.1. Market Analysis, Insights and Forecast - by Type of Payment
- 6. Global Real Time Payments Market Analysis, Insights and Forecast, 2021-2033
- 6.1. Market Analysis, Insights and Forecast - by Type of Payment
- 6.1.1. P2P
- 6.1.2. P2B
- 6.1. Market Analysis, Insights and Forecast - by Type of Payment
- 7. North America Real Time Payments Market Analysis, Insights and Forecast, 2020-2032
- 7.1. Market Analysis, Insights and Forecast - by Type of Payment
- 7.1.1. P2P
- 7.1.2. P2B
- 7.1. Market Analysis, Insights and Forecast - by Type of Payment
- 8. Europe Real Time Payments Market Analysis, Insights and Forecast, 2020-2032
- 8.1. Market Analysis, Insights and Forecast - by Type of Payment
- 8.1.1. P2P
- 8.1.2. P2B
- 8.1. Market Analysis, Insights and Forecast - by Type of Payment
- 9. Asia Pacific Real Time Payments Market Analysis, Insights and Forecast, 2020-2032
- 9.1. Market Analysis, Insights and Forecast - by Type of Payment
- 9.1.1. P2P
- 9.1.2. P2B
- 9.1. Market Analysis, Insights and Forecast - by Type of Payment
- 10. Latin America Real Time Payments Market Analysis, Insights and Forecast, 2020-2032
- 10.1. Market Analysis, Insights and Forecast - by Type of Payment
- 10.1.1. P2P
- 10.1.2. P2B
- 10.1. Market Analysis, Insights and Forecast - by Type of Payment
- 11. Middle East and Africa Real Time Payments Market Analysis, Insights and Forecast, 2020-2032
- 11.1. Market Analysis, Insights and Forecast - by Type of Payment
- 11.1.1. P2P
- 11.1.2. P2B
- 11.1. Market Analysis, Insights and Forecast - by Type of Payment
- 12. Competitive Analysis
- 12.1. Company Profiles
- 12.1.1 Visa Inc
- 12.1.1.1. Company Overview
- 12.1.1.2. Products
- 12.1.1.3. Company Financials
- 12.1.1.4. SWOT Analysis
- 12.1.2 Montran Corporation
- 12.1.2.1. Company Overview
- 12.1.2.2. Products
- 12.1.2.3. Company Financials
- 12.1.2.4. SWOT Analysis
- 12.1.3 Wirecard AG
- 12.1.3.1. Company Overview
- 12.1.3.2. Products
- 12.1.3.3. Company Financials
- 12.1.3.4. SWOT Analysis
- 12.1.4 Fiserv Inc
- 12.1.4.1. Company Overview
- 12.1.4.2. Products
- 12.1.4.3. Company Financials
- 12.1.4.4. SWOT Analysis
- 12.1.5 Volante Technologies Inc
- 12.1.5.1. Company Overview
- 12.1.5.2. Products
- 12.1.5.3. Company Financials
- 12.1.5.4. SWOT Analysis
- 12.1.6 Temenos AG
- 12.1.6.1. Company Overview
- 12.1.6.2. Products
- 12.1.6.3. Company Financials
- 12.1.6.4. SWOT Analysis
- 12.1.7 FIS Global
- 12.1.7.1. Company Overview
- 12.1.7.2. Products
- 12.1.7.3. Company Financials
- 12.1.7.4. SWOT Analysis
- 12.1.8 Finastra
- 12.1.8.1. Company Overview
- 12.1.8.2. Products
- 12.1.8.3. Company Financials
- 12.1.8.4. SWOT Analysis
- 12.1.9 Mastercard Inc
- 12.1.9.1. Company Overview
- 12.1.9.2. Products
- 12.1.9.3. Company Financials
- 12.1.9.4. SWOT Analysis
- 12.1.10 ACI Worldwide Inc
- 12.1.10.1. Company Overview
- 12.1.10.2. Products
- 12.1.10.3. Company Financials
- 12.1.10.4. SWOT Analysis
- 12.1.11 Paypal Holdings Inc
- 12.1.11.1. Company Overview
- 12.1.11.2. Products
- 12.1.11.3. Company Financials
- 12.1.11.4. SWOT Analysis
- 12.1.1 Visa Inc
- 12.2. Market Entropy
- 12.2.1 Company's Key Areas Served
- 12.2.2 Recent Developments
- 12.3. Company Market Share Analysis 2025
- 12.3.1 Top 5 Companies Market Share Analysis
- 12.3.2 Top 3 Companies Market Share Analysis
- 12.4. List of Potential Customers
- 13. Research Methodology
List of Figures
- Figure 1: Global Real Time Payments Market Revenue Breakdown (Million, %) by Region 2025 & 2033
- Figure 2: Global Real Time Payments Market Volume Breakdown (K Unit, %) by Region 2025 & 2033
- Figure 3: North America Real Time Payments Market Revenue (Million), by Type of Payment 2025 & 2033
- Figure 4: North America Real Time Payments Market Volume (K Unit), by Type of Payment 2025 & 2033
- Figure 5: North America Real Time Payments Market Revenue Share (%), by Type of Payment 2025 & 2033
- Figure 6: North America Real Time Payments Market Volume Share (%), by Type of Payment 2025 & 2033
- Figure 7: North America Real Time Payments Market Revenue (Million), by Country 2025 & 2033
- Figure 8: North America Real Time Payments Market Volume (K Unit), by Country 2025 & 2033
- Figure 9: North America Real Time Payments Market Revenue Share (%), by Country 2025 & 2033
- Figure 10: North America Real Time Payments Market Volume Share (%), by Country 2025 & 2033
- Figure 11: Europe Real Time Payments Market Revenue (Million), by Type of Payment 2025 & 2033
- Figure 12: Europe Real Time Payments Market Volume (K Unit), by Type of Payment 2025 & 2033
- Figure 13: Europe Real Time Payments Market Revenue Share (%), by Type of Payment 2025 & 2033
- Figure 14: Europe Real Time Payments Market Volume Share (%), by Type of Payment 2025 & 2033
- Figure 15: Europe Real Time Payments Market Revenue (Million), by Country 2025 & 2033
- Figure 16: Europe Real Time Payments Market Volume (K Unit), by Country 2025 & 2033
- Figure 17: Europe Real Time Payments Market Revenue Share (%), by Country 2025 & 2033
- Figure 18: Europe Real Time Payments Market Volume Share (%), by Country 2025 & 2033
- Figure 19: Asia Pacific Real Time Payments Market Revenue (Million), by Type of Payment 2025 & 2033
- Figure 20: Asia Pacific Real Time Payments Market Volume (K Unit), by Type of Payment 2025 & 2033
- Figure 21: Asia Pacific Real Time Payments Market Revenue Share (%), by Type of Payment 2025 & 2033
- Figure 22: Asia Pacific Real Time Payments Market Volume Share (%), by Type of Payment 2025 & 2033
- Figure 23: Asia Pacific Real Time Payments Market Revenue (Million), by Country 2025 & 2033
- Figure 24: Asia Pacific Real Time Payments Market Volume (K Unit), by Country 2025 & 2033
- Figure 25: Asia Pacific Real Time Payments Market Revenue Share (%), by Country 2025 & 2033
- Figure 26: Asia Pacific Real Time Payments Market Volume Share (%), by Country 2025 & 2033
- Figure 27: Latin America Real Time Payments Market Revenue (Million), by Type of Payment 2025 & 2033
- Figure 28: Latin America Real Time Payments Market Volume (K Unit), by Type of Payment 2025 & 2033
- Figure 29: Latin America Real Time Payments Market Revenue Share (%), by Type of Payment 2025 & 2033
- Figure 30: Latin America Real Time Payments Market Volume Share (%), by Type of Payment 2025 & 2033
- Figure 31: Latin America Real Time Payments Market Revenue (Million), by Country 2025 & 2033
- Figure 32: Latin America Real Time Payments Market Volume (K Unit), by Country 2025 & 2033
- Figure 33: Latin America Real Time Payments Market Revenue Share (%), by Country 2025 & 2033
- Figure 34: Latin America Real Time Payments Market Volume Share (%), by Country 2025 & 2033
- Figure 35: Middle East and Africa Real Time Payments Market Revenue (Million), by Type of Payment 2025 & 2033
- Figure 36: Middle East and Africa Real Time Payments Market Volume (K Unit), by Type of Payment 2025 & 2033
- Figure 37: Middle East and Africa Real Time Payments Market Revenue Share (%), by Type of Payment 2025 & 2033
- Figure 38: Middle East and Africa Real Time Payments Market Volume Share (%), by Type of Payment 2025 & 2033
- Figure 39: Middle East and Africa Real Time Payments Market Revenue (Million), by Country 2025 & 2033
- Figure 40: Middle East and Africa Real Time Payments Market Volume (K Unit), by Country 2025 & 2033
- Figure 41: Middle East and Africa Real Time Payments Market Revenue Share (%), by Country 2025 & 2033
- Figure 42: Middle East and Africa Real Time Payments Market Volume Share (%), by Country 2025 & 2033
List of Tables
- Table 1: Global Real Time Payments Market Revenue Million Forecast, by Type of Payment 2020 & 2033
- Table 2: Global Real Time Payments Market Volume K Unit Forecast, by Type of Payment 2020 & 2033
- Table 3: Global Real Time Payments Market Revenue Million Forecast, by Region 2020 & 2033
- Table 4: Global Real Time Payments Market Volume K Unit Forecast, by Region 2020 & 2033
- Table 5: Global Real Time Payments Market Revenue Million Forecast, by Type of Payment 2020 & 2033
- Table 6: Global Real Time Payments Market Volume K Unit Forecast, by Type of Payment 2020 & 2033
- Table 7: Global Real Time Payments Market Revenue Million Forecast, by Country 2020 & 2033
- Table 8: Global Real Time Payments Market Volume K Unit Forecast, by Country 2020 & 2033
- Table 9: United States Real Time Payments Market Revenue (Million) Forecast, by Application 2020 & 2033
- Table 10: United States Real Time Payments Market Volume (K Unit) Forecast, by Application 2020 & 2033
- Table 11: Canada Real Time Payments Market Revenue (Million) Forecast, by Application 2020 & 2033
- Table 12: Canada Real Time Payments Market Volume (K Unit) Forecast, by Application 2020 & 2033
- Table 13: Global Real Time Payments Market Revenue Million Forecast, by Type of Payment 2020 & 2033
- Table 14: Global Real Time Payments Market Volume K Unit Forecast, by Type of Payment 2020 & 2033
- Table 15: Global Real Time Payments Market Revenue Million Forecast, by Country 2020 & 2033
- Table 16: Global Real Time Payments Market Volume K Unit Forecast, by Country 2020 & 2033
- Table 17: United Kingdom Real Time Payments Market Revenue (Million) Forecast, by Application 2020 & 2033
- Table 18: United Kingdom Real Time Payments Market Volume (K Unit) Forecast, by Application 2020 & 2033
- Table 19: Germany Real Time Payments Market Revenue (Million) Forecast, by Application 2020 & 2033
- Table 20: Germany Real Time Payments Market Volume (K Unit) Forecast, by Application 2020 & 2033
- Table 21: Spain Real Time Payments Market Revenue (Million) Forecast, by Application 2020 & 2033
- Table 22: Spain Real Time Payments Market Volume (K Unit) Forecast, by Application 2020 & 2033
- Table 23: Sweden Real Time Payments Market Revenue (Million) Forecast, by Application 2020 & 2033
- Table 24: Sweden Real Time Payments Market Volume (K Unit) Forecast, by Application 2020 & 2033
- Table 25: Finland Real Time Payments Market Revenue (Million) Forecast, by Application 2020 & 2033
- Table 26: Finland Real Time Payments Market Volume (K Unit) Forecast, by Application 2020 & 2033
- Table 27: Rest of Europe Real Time Payments Market Revenue (Million) Forecast, by Application 2020 & 2033
- Table 28: Rest of Europe Real Time Payments Market Volume (K Unit) Forecast, by Application 2020 & 2033
- Table 29: Global Real Time Payments Market Revenue Million Forecast, by Type of Payment 2020 & 2033
- Table 30: Global Real Time Payments Market Volume K Unit Forecast, by Type of Payment 2020 & 2033
- Table 31: Global Real Time Payments Market Revenue Million Forecast, by Country 2020 & 2033
- Table 32: Global Real Time Payments Market Volume K Unit Forecast, by Country 2020 & 2033
- Table 33: China Real Time Payments Market Revenue (Million) Forecast, by Application 2020 & 2033
- Table 34: China Real Time Payments Market Volume (K Unit) Forecast, by Application 2020 & 2033
- Table 35: India Real Time Payments Market Revenue (Million) Forecast, by Application 2020 & 2033
- Table 36: India Real Time Payments Market Volume (K Unit) Forecast, by Application 2020 & 2033
- Table 37: South Korea Real Time Payments Market Revenue (Million) Forecast, by Application 2020 & 2033
- Table 38: South Korea Real Time Payments Market Volume (K Unit) Forecast, by Application 2020 & 2033
- Table 39: Thailand Real Time Payments Market Revenue (Million) Forecast, by Application 2020 & 2033
- Table 40: Thailand Real Time Payments Market Volume (K Unit) Forecast, by Application 2020 & 2033
- Table 41: Japan Real Time Payments Market Revenue (Million) Forecast, by Application 2020 & 2033
- Table 42: Japan Real Time Payments Market Volume (K Unit) Forecast, by Application 2020 & 2033
- Table 43: Rest of Asia Pacific Real Time Payments Market Revenue (Million) Forecast, by Application 2020 & 2033
- Table 44: Rest of Asia Pacific Real Time Payments Market Volume (K Unit) Forecast, by Application 2020 & 2033
- Table 45: Global Real Time Payments Market Revenue Million Forecast, by Type of Payment 2020 & 2033
- Table 46: Global Real Time Payments Market Volume K Unit Forecast, by Type of Payment 2020 & 2033
- Table 47: Global Real Time Payments Market Revenue Million Forecast, by Country 2020 & 2033
- Table 48: Global Real Time Payments Market Volume K Unit Forecast, by Country 2020 & 2033
- Table 49: Brazil Real Time Payments Market Revenue (Million) Forecast, by Application 2020 & 2033
- Table 50: Brazil Real Time Payments Market Volume (K Unit) Forecast, by Application 2020 & 2033
- Table 51: Argentina Real Time Payments Market Revenue (Million) Forecast, by Application 2020 & 2033
- Table 52: Argentina Real Time Payments Market Volume (K Unit) Forecast, by Application 2020 & 2033
- Table 53: Colombia Real Time Payments Market Revenue (Million) Forecast, by Application 2020 & 2033
- Table 54: Colombia Real Time Payments Market Volume (K Unit) Forecast, by Application 2020 & 2033
- Table 55: Mexico Real Time Payments Market Revenue (Million) Forecast, by Application 2020 & 2033
- Table 56: Mexico Real Time Payments Market Volume (K Unit) Forecast, by Application 2020 & 2033
- Table 57: Rest of Latin America Real Time Payments Market Revenue (Million) Forecast, by Application 2020 & 2033
- Table 58: Rest of Latin America Real Time Payments Market Volume (K Unit) Forecast, by Application 2020 & 2033
- Table 59: Global Real Time Payments Market Revenue Million Forecast, by Type of Payment 2020 & 2033
- Table 60: Global Real Time Payments Market Volume K Unit Forecast, by Type of Payment 2020 & 2033
- Table 61: Global Real Time Payments Market Revenue Million Forecast, by Country 2020 & 2033
- Table 62: Global Real Time Payments Market Volume K Unit Forecast, by Country 2020 & 2033
- Table 63: United Arab Emirates Real Time Payments Market Revenue (Million) Forecast, by Application 2020 & 2033
- Table 64: United Arab Emirates Real Time Payments Market Volume (K Unit) Forecast, by Application 2020 & 2033
- Table 65: South Africa Real Time Payments Market Revenue (Million) Forecast, by Application 2020 & 2033
- Table 66: South Africa Real Time Payments Market Volume (K Unit) Forecast, by Application 2020 & 2033
- Table 67: Nigeria Real Time Payments Market Revenue (Million) Forecast, by Application 2020 & 2033
- Table 68: Nigeria Real Time Payments Market Volume (K Unit) Forecast, by Application 2020 & 2033
- Table 69: Rest of Middle East and Africa Real Time Payments Market Revenue (Million) Forecast, by Application 2020 & 2033
- Table 70: Rest of Middle East and Africa Real Time Payments Market Volume (K Unit) Forecast, by Application 2020 & 2033
Frequently Asked Questions
1. What is the projected Compound Annual Growth Rate (CAGR) of the Real Time Payments Market?
The projected CAGR is approximately 35.00%.
2. Which companies are prominent players in the Real Time Payments Market?
Key companies in the market include Visa Inc, Montran Corporation, Wirecard AG, Fiserv Inc, Volante Technologies Inc, Temenos AG, FIS Global, Finastra, Mastercard Inc, ACI Worldwide Inc, Paypal Holdings Inc.
3. What are the main segments of the Real Time Payments Market?
The market segments include Type of Payment.
4. Can you provide details about the market size?
The market size is estimated to be USD 25.92 Million as of 2022.
5. What are some drivers contributing to market growth?
Increased Smartphone Penetration; Ease of Convenience; Falling Reliance on Traditional Banking.
6. What are the notable trends driving market growth?
P2B Segment Holds the Key to Drive the Market.
7. Are there any restraints impacting market growth?
Operational Challenges Involving Cross-border Payments.
8. Can you provide examples of recent developments in the market?
Apr 2023: Visa announced a partnership with PayPal and Venmo to pilot Visa+, an innovative service that aims to enable individuals to move money quickly and securely between different person-to-person (P2P) digital payment apps. Later in 2023, Venmo and PayPal users in the United States will be able to start moving money seamlessly between the two platforms.
9. What pricing options are available for accessing the report?
Pricing options include single-user, multi-user, and enterprise licenses priced at USD 4750, USD 5250, and USD 8750 respectively.
10. Is the market size provided in terms of value or volume?
The market size is provided in terms of value, measured in Million and volume, measured in K Unit.
11. Are there any specific market keywords associated with the report?
Yes, the market keyword associated with the report is "Real Time Payments Market," which aids in identifying and referencing the specific market segment covered.
12. How do I determine which pricing option suits my needs best?
The pricing options vary based on user requirements and access needs. Individual users may opt for single-user licenses, while businesses requiring broader access may choose multi-user or enterprise licenses for cost-effective access to the report.
13. Are there any additional resources or data provided in the Real Time Payments Market report?
While the report offers comprehensive insights, it's advisable to review the specific contents or supplementary materials provided to ascertain if additional resources or data are available.
14. How can I stay updated on further developments or reports in the Real Time Payments Market?
To stay informed about further developments, trends, and reports in the Real Time Payments Market, consider subscribing to industry newsletters, following relevant companies and organizations, or regularly checking reputable industry news sources and publications.
Methodology
Step 1 - Identification of Relevant Samples Size from Population Database


Step 2 - Approaches for Defining Global Market Size (Value, Volume* & Price*)

Note*: In applicable scenarios
Step 3 - Data Sources
Primary Research
- Web Analytics
- Survey Reports
- Research Institute
- Latest Research Reports
- Opinion Leaders
Secondary Research
- Annual Reports
- White Paper
- Latest Press Release
- Industry Association
- Paid Database
- Investor Presentations

Step 4 - Data Triangulation
Involves using different sources of information in order to increase the validity of a study
These sources are likely to be stakeholders in a program - participants, other researchers, program staff, other community members, and so on.
Then we put all data in single framework & apply various statistical tools to find out the dynamic on the market.
During the analysis stage, feedback from the stakeholder groups would be compared to determine areas of agreement as well as areas of divergence