

Key Insights
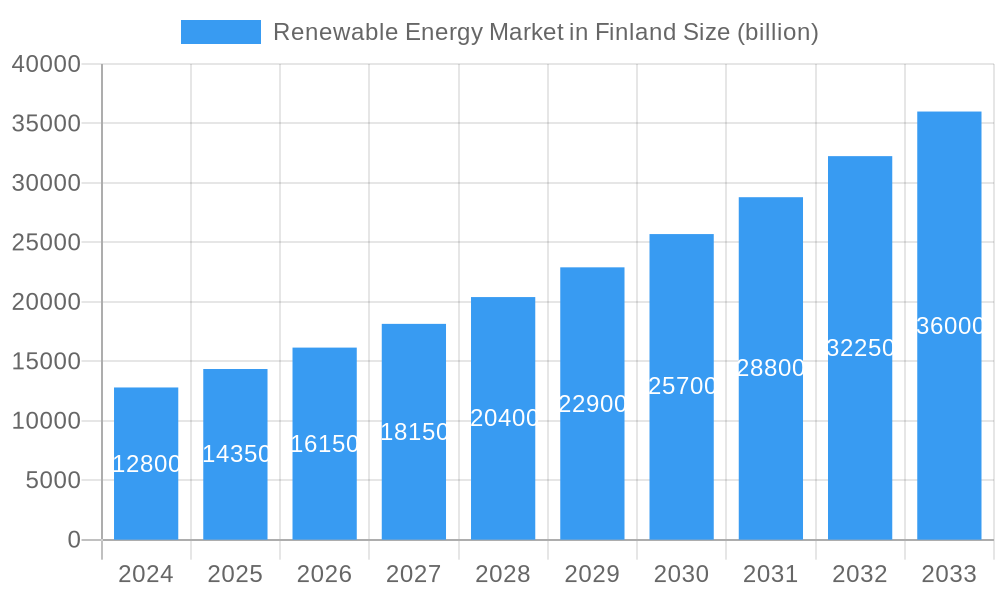
The Finnish renewable energy market is poised for substantial growth, projected to reach an estimated USD 12.8 billion in 2024. This expansion is driven by a robust CAGR of 12.37%, indicating a dynamic and rapidly evolving sector. The increasing demand for sustainable energy solutions, coupled with supportive government policies and technological advancements, are key factors propelling this growth. Finland's commitment to decarbonization and energy independence further strengthens the outlook for renewable sources like wind, hydropower, and bioenergy. Investments in offshore wind farms, alongside continued development in onshore wind and advanced bioenergy technologies, are expected to be significant contributors to market expansion. The integration of smart grid technologies and energy storage solutions will also play a crucial role in ensuring grid stability and maximizing the utilization of intermittent renewable sources, further solidifying Finland's position as a leader in the European renewable energy landscape.
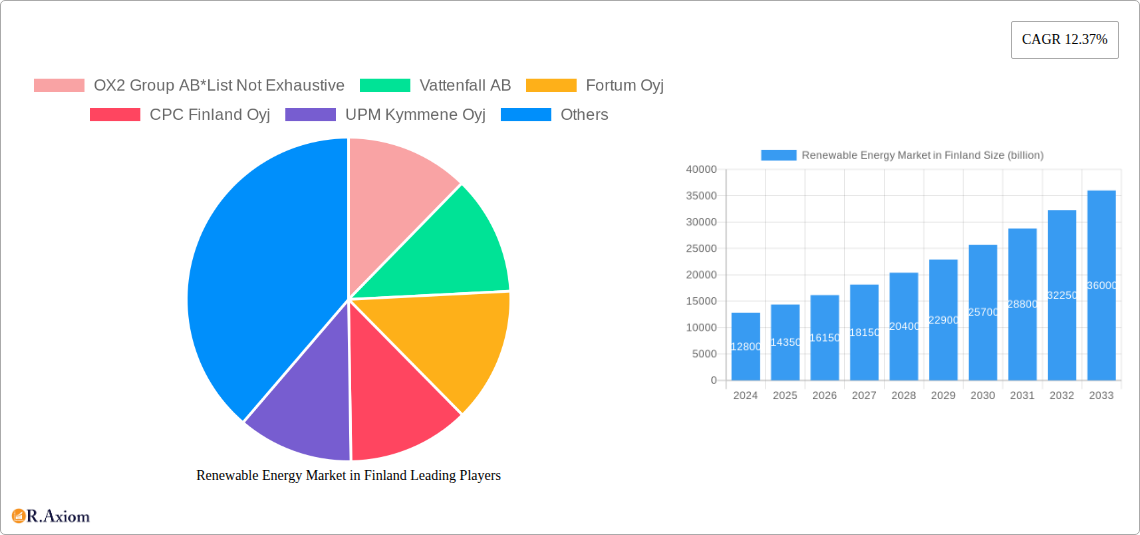
Renewable Energy Market in Finland Market Size (In Billion)
The market's trajectory is characterized by several key trends, including the escalating adoption of hybrid renewable energy systems and the growing importance of green hydrogen production as a future energy carrier. Innovations in energy efficiency and storage are also becoming paramount. However, the market faces certain restraints, such as the upfront capital investment required for large-scale renewable energy projects and the potential for grid infrastructure limitations to hinder rapid expansion. Nevertheless, the Finnish government's ambitious renewable energy targets and the strong presence of key players like Vattenfall AB, Fortum Oyj, and OX2 Group AB, investing heavily in new capacity and technological innovation, suggest that these challenges are being actively addressed. The market is segmented across Hydropower, Wind, Bioenergy, and Other Types, with Wind energy anticipated to dominate due to favorable geographical conditions and technological advancements.
Renewable Energy Market in Finland Company Market Share
Renewable Energy Market in Finland: Market Concentration & Innovation
The Finnish renewable energy market is characterized by a moderate concentration, with key players like Fortum Oyj, Vattenfall AB, and OX2 Group AB holding significant market share. Innovation is a critical driver, fueled by government support for R&D and the pursuit of ambitious climate targets. Finland's regulatory framework, including feed-in tariffs and renewable energy quotas, actively encourages investment and the adoption of cleaner energy sources. Product substitutes, while present in the form of fossil fuels, are increasingly disadvantaged by carbon pricing and sustainability mandates. End-user trends demonstrate a strong preference for green energy, with both industrial and residential consumers seeking to reduce their carbon footprint. Mergers and acquisitions (M&A) activity is a notable feature, with substantial deal values observed as companies consolidate their positions and expand their renewable portfolios. For instance, strategic acquisitions in the wind and bioenergy sectors are reshaping the competitive landscape, aiming to achieve economies of scale and enhance technological capabilities. The market share of leading companies is estimated to be in the range of 15-25%, with M&A deal values reaching billions.
Renewable Energy Market in Finland Industry Trends & Insights
The Finnish renewable energy market is poised for robust growth, projected to expand at a Compound Annual Growth Rate (CAGR) of approximately 8.5% during the forecast period of 2025–2033. This expansion is primarily driven by Finland's unwavering commitment to decarbonization and energy independence, supported by favorable government policies and a growing societal demand for sustainable solutions. Technological advancements are continuously enhancing the efficiency and cost-effectiveness of renewable energy generation, particularly in wind and bioenergy. The market penetration of renewable sources is expected to reach over 70% by 2033. Consumer preferences are shifting decisively towards green energy, with businesses increasingly prioritizing renewable procurement to meet their corporate social responsibility goals and improve their brand image. Industrial end-users are actively seeking long-term power purchase agreements (PPAs) for renewable energy to secure stable pricing and demonstrate their commitment to sustainability. The competitive dynamics are evolving, with traditional energy providers investing heavily in renewable infrastructure and new entrants with specialized expertise emerging. The bioenergy sector, in particular, is benefiting from advancements in biomass conversion technologies and the availability of sustainable raw materials. Hydropower, while a mature technology, continues to play a crucial role in grid stability. The "Other Types" segment, encompassing solar and geothermal energy, is experiencing accelerated growth as costs decline and technological capabilities improve, offering significant future potential.
Dominant Markets & Segments in Renewable Energy Market in Finland
The Wind energy segment stands as the dominant force in the Finnish renewable energy market, exhibiting exceptional growth and investment during the historical and forecast periods. Key drivers underpinning this dominance include favorable wind resources across the country, particularly along the coastlines and in the northern regions, coupled with a stable and supportive regulatory environment that incentivizes wind farm development. Economic policies, such as streamlined permitting processes and tax incentives for renewable energy projects, further bolster investment in wind power. The availability of advanced turbine technologies has significantly improved energy yields and reduced operational costs, making wind energy increasingly competitive. Infrastructure development, including grid upgrades to accommodate intermittent wind generation and the construction of offshore wind farms, is also a critical factor in its ascendancy.
Bioenergy represents another significant and steadily growing segment, benefiting from Finland's abundant forest resources and a strong tradition of utilizing biomass for heat and power generation. The economic policies favoring the use of sustainable biomass, coupled with advancements in bioenergy technologies like co-firing and advanced biofuels, contribute to its consistent expansion. Infrastructure for biomass collection and processing, along with research into novel bioenergy feedstocks, are key enablers.
Hydropower, while a mature and established renewable energy source in Finland, contributes a consistent base load to the energy mix. Its dominance is more about stability than rapid expansion, as new large-scale hydropower projects are limited by environmental considerations and existing infrastructure. Economic policies focus on maintaining existing facilities and optimizing their output.
The Other Types segment, primarily encompassing solar energy and emerging technologies like geothermal, is experiencing the most rapid percentage growth. While its current market share is smaller, its future potential is substantial. Drivers include declining solar panel costs, increasing efficiency, and growing consumer interest in distributed generation. Government initiatives supporting solar adoption and the development of pilot projects for geothermal energy are crucial for its expansion.
Renewable Energy Market in Finland Product Developments
Innovations in renewable energy technology are rapidly transforming the Finnish market. Advancements in larger and more efficient wind turbines are increasing energy capture and reducing the levelized cost of electricity. In bioenergy, research into advanced biofuels from waste streams and algae is opening new avenues for sustainable fuel production. Solar energy is witnessing improvements in photovoltaic panel efficiency and energy storage solutions, making it more viable for both large-scale and residential applications. These developments offer competitive advantages by enhancing reliability, reducing environmental impact, and contributing to the overall cost-effectiveness of renewable energy solutions.
Renewable Energy Market in Finland Report Scope & Segmentation Analysis
The Hydropower segment, a foundational component of Finland's renewable energy landscape, is expected to maintain its contribution to the energy mix, with steady market sizes in the billions and moderate growth projections. Its competitive dynamics are largely characterized by established players and infrastructure. The Wind segment is the primary growth engine, projected to experience significant expansion in market size and penetration throughout the forecast period, driven by ongoing project developments and technological advancements. Bioenergy will continue to hold a substantial market share, supported by consistent demand and sustainable resource availability, with growth driven by technological enhancements and policy support. The Other Types segment, primarily solar and geothermal, is forecast to exhibit the highest percentage growth, albeit from a smaller base, as market penetration increases due to falling costs and supportive policies.
Key Drivers of Renewable Energy Market in Finland Growth
Finland's renewable energy market growth is propelled by several key factors. Foremost is the government's ambitious climate targets and supportive policy framework, including subsidies and tax incentives. Secondly, technological advancements in wind turbine efficiency and bioenergy conversion are making renewables increasingly cost-competitive. Thirdly, growing corporate and public demand for sustainable energy is driving investment and adoption. Finally, the desire for energy independence and security, particularly in light of global geopolitical shifts, further strengthens the impetus for domestic renewable energy production.
Challenges in the Renewable Energy Market in Finland Sector
Despite its strong growth trajectory, the Finnish renewable energy market faces several challenges. Grid integration and infrastructure limitations can pose hurdles for accommodating the intermittent nature of wind and solar power, requiring significant investment in grid modernization. Permitting processes and land use conflicts can lead to project delays and increased costs. Supply chain volatility and raw material availability, particularly for biomass, can impact operational efficiency. Furthermore, evolving regulatory landscapes and potential shifts in government support could introduce uncertainty for investors. Competitive pressures from traditional energy sources, though diminishing, can also present localized challenges.
Emerging Opportunities in Renewable Energy Market in Finland
Emerging opportunities in the Finnish renewable energy market are abundant. The development of offshore wind farms presents significant untapped potential. Advancements in energy storage solutions, including battery technology and hydrogen, are crucial for enhancing grid stability and enabling greater renewable integration. The increasing focus on circular economy principles is creating opportunities for waste-to-energy projects and the utilization of by-products from renewable processes. Furthermore, the growing adoption of electric vehicles is driving demand for renewable electricity to power transportation, creating a synergistic growth opportunity.
Leading Players in the Renewable Energy Market in Finland Market
- OX2 Group AB
- Vattenfall AB
- Fortum Oyj
- CPC Finland Oyj
- UPM Kymmene Oyj
- Pohjolan Voima Oyj
- ABO Wind AG
- Valoe Oyj
- SGS AG
Key Developments in Renewable Energy Market in Finland Industry
- 2023 October: OX2 Group AB announced plans for a significant new wind farm development in Northern Finland, aiming to add an estimated 600 MW to the national grid.
- 2023 September: Vattenfall AB secured funding for a major offshore wind project, signaling increased investment in this emerging sector.
- 2023 July: Fortum Oyj expanded its bioenergy portfolio through strategic acquisitions, reinforcing its position in sustainable heat and power generation.
- 2023 May: UPM Kymmene Oyj continued its investment in renewable energy solutions derived from forest industry by-products, enhancing its bioenergy capabilities.
- 2023 April: Valoe Oyj reported advancements in its solar panel technology, aiming to improve efficiency and cost-competitiveness for the Finnish market.
- 2022: Several M&A deals in the renewable energy sector involving Finnish assets reached combined values in the billions, indicating strong investor confidence and market consolidation.
Strategic Outlook for Renewable Energy Market in Finland Market
The strategic outlook for the Finnish renewable energy market is exceptionally positive, driven by a confluence of ambitious climate goals, robust policy support, and technological innovation. The continued expansion of wind energy, coupled with the burgeoning potential of offshore wind, will be a primary growth catalyst. Investment in grid modernization and energy storage solutions will be crucial for maximizing the integration of intermittent renewables. The bioenergy sector will remain a stable and significant contributor, benefiting from sustainable resource management and technological advancements. Emerging opportunities in solar and other renewable technologies, supported by decreasing costs and increasing consumer acceptance, will further diversify and strengthen the market. The strategic focus on energy independence and decarbonization ensures sustained investment and growth in the coming years.
Renewable Energy Market in Finland Segmentation
-
1. Type
- 1.1. Hydropower
- 1.2. Wind
- 1.3. Bioenergy
- 1.4. OtherTypes
Renewable Energy Market in Finland Segmentation By Geography
-
1. North America
- 1.1. United States
- 1.2. Canada
- 1.3. Mexico
-
2. South America
- 2.1. Brazil
- 2.2. Argentina
- 2.3. Rest of South America
-
3. Europe
- 3.1. United Kingdom
- 3.2. Germany
- 3.3. France
- 3.4. Italy
- 3.5. Spain
- 3.6. Russia
- 3.7. Benelux
- 3.8. Nordics
- 3.9. Rest of Europe
-
4. Middle East & Africa
- 4.1. Turkey
- 4.2. Israel
- 4.3. GCC
- 4.4. North Africa
- 4.5. South Africa
- 4.6. Rest of Middle East & Africa
-
5. Asia Pacific
- 5.1. China
- 5.2. India
- 5.3. Japan
- 5.4. South Korea
- 5.5. ASEAN
- 5.6. Oceania
- 5.7. Rest of Asia Pacific
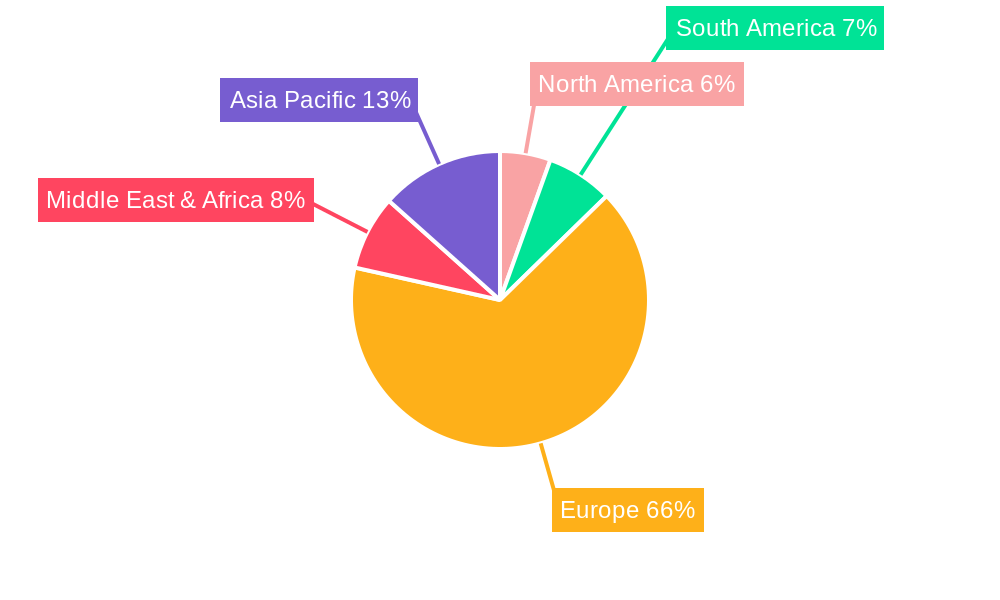
Renewable Energy Market in Finland Regional Market Share
Geographic Coverage of Renewable Energy Market in Finland
Renewable Energy Market in Finland REPORT HIGHLIGHTS
| Aspects | Details |
|---|---|
| Study Period | 2020-2034 |
| Base Year | 2025 |
| Estimated Year | 2026 |
| Forecast Period | 2026-2034 |
| Historical Period | 2020-2025 |
| Growth Rate | CAGR of 12.37% from 2020-2034 |
| Segmentation |
|
Table of Contents
- 1. Introduction
- 1.1. Research Scope
- 1.2. Market Segmentation
- 1.3. Research Objective
- 1.4. Definitions and Assumptions
- 2. Executive Summary
- 2.1. Market Snapshot
- 3. Market Dynamics
- 3.1. Market Drivers
- 3.2. Market Restrains
- 3.3. Market Trends
- 3.4. Market Opportunities
- 4. Market Factor Analysis
- 4.1. Porters Five Forces
- 4.1.1. Bargaining Power of Suppliers
- 4.1.2. Bargaining Power of Buyers
- 4.1.3. Threat of New Entrants
- 4.1.4. Threat of Substitutes
- 4.1.5. Competitive Rivalry
- 4.2. PESTEL analysis
- 4.3. BCG Analysis
- 4.3.1. Stars (High Growth, High Market Share)
- 4.3.2. Cash Cows (Low Growth, High Market Share)
- 4.3.3. Question Mark (High Growth, Low Market Share)
- 4.3.4. Dogs (Low Growth, Low Market Share)
- 4.4. Ansoff Matrix Analysis
- 4.5. Supply Chain Analysis
- 4.6. Regulatory Landscape
- 4.7. Current Market Potential and Opportunity Assessment (TAM–SAM–SOM Framework)
- 4.8. RAX Analyst Note
- 4.1. Porters Five Forces
- 5. Market Analysis, Insights and Forecast 2021-2033
- 5.1. Market Analysis, Insights and Forecast - by Type
- 5.1.1. Hydropower
- 5.1.2. Wind
- 5.1.3. Bioenergy
- 5.1.4. OtherTypes
- 5.2. Market Analysis, Insights and Forecast - by Region
- 5.2.1. North America
- 5.2.2. South America
- 5.2.3. Europe
- 5.2.4. Middle East & Africa
- 5.2.5. Asia Pacific
- 5.1. Market Analysis, Insights and Forecast - by Type
- 6. Global Renewable Energy Market in Finland Analysis, Insights and Forecast, 2021-2033
- 6.1. Market Analysis, Insights and Forecast - by Type
- 6.1.1. Hydropower
- 6.1.2. Wind
- 6.1.3. Bioenergy
- 6.1.4. OtherTypes
- 6.1. Market Analysis, Insights and Forecast - by Type
- 7. North America Renewable Energy Market in Finland Analysis, Insights and Forecast, 2020-2032
- 7.1. Market Analysis, Insights and Forecast - by Type
- 7.1.1. Hydropower
- 7.1.2. Wind
- 7.1.3. Bioenergy
- 7.1.4. OtherTypes
- 7.1. Market Analysis, Insights and Forecast - by Type
- 8. South America Renewable Energy Market in Finland Analysis, Insights and Forecast, 2020-2032
- 8.1. Market Analysis, Insights and Forecast - by Type
- 8.1.1. Hydropower
- 8.1.2. Wind
- 8.1.3. Bioenergy
- 8.1.4. OtherTypes
- 8.1. Market Analysis, Insights and Forecast - by Type
- 9. Europe Renewable Energy Market in Finland Analysis, Insights and Forecast, 2020-2032
- 9.1. Market Analysis, Insights and Forecast - by Type
- 9.1.1. Hydropower
- 9.1.2. Wind
- 9.1.3. Bioenergy
- 9.1.4. OtherTypes
- 9.1. Market Analysis, Insights and Forecast - by Type
- 10. Middle East & Africa Renewable Energy Market in Finland Analysis, Insights and Forecast, 2020-2032
- 10.1. Market Analysis, Insights and Forecast - by Type
- 10.1.1. Hydropower
- 10.1.2. Wind
- 10.1.3. Bioenergy
- 10.1.4. OtherTypes
- 10.1. Market Analysis, Insights and Forecast - by Type
- 11. Asia Pacific Renewable Energy Market in Finland Analysis, Insights and Forecast, 2020-2032
- 11.1. Market Analysis, Insights and Forecast - by Type
- 11.1.1. Hydropower
- 11.1.2. Wind
- 11.1.3. Bioenergy
- 11.1.4. OtherTypes
- 11.1. Market Analysis, Insights and Forecast - by Type
- 12. Competitive Analysis
- 12.1. Company Profiles
- 12.1.1 OX2 Group AB*List Not Exhaustive
- 12.1.1.1. Company Overview
- 12.1.1.2. Products
- 12.1.1.3. Company Financials
- 12.1.1.4. SWOT Analysis
- 12.1.2 Vattenfall AB
- 12.1.2.1. Company Overview
- 12.1.2.2. Products
- 12.1.2.3. Company Financials
- 12.1.2.4. SWOT Analysis
- 12.1.3 Fortum Oyj
- 12.1.3.1. Company Overview
- 12.1.3.2. Products
- 12.1.3.3. Company Financials
- 12.1.3.4. SWOT Analysis
- 12.1.4 CPC Finland Oyj
- 12.1.4.1. Company Overview
- 12.1.4.2. Products
- 12.1.4.3. Company Financials
- 12.1.4.4. SWOT Analysis
- 12.1.5 UPM Kymmene Oyj
- 12.1.5.1. Company Overview
- 12.1.5.2. Products
- 12.1.5.3. Company Financials
- 12.1.5.4. SWOT Analysis
- 12.1.6 Pohjolan Voima Oyj
- 12.1.6.1. Company Overview
- 12.1.6.2. Products
- 12.1.6.3. Company Financials
- 12.1.6.4. SWOT Analysis
- 12.1.7 ABO Wind AG
- 12.1.7.1. Company Overview
- 12.1.7.2. Products
- 12.1.7.3. Company Financials
- 12.1.7.4. SWOT Analysis
- 12.1.8 Valoe Oyj
- 12.1.8.1. Company Overview
- 12.1.8.2. Products
- 12.1.8.3. Company Financials
- 12.1.8.4. SWOT Analysis
- 12.1.9 SGS AG
- 12.1.9.1. Company Overview
- 12.1.9.2. Products
- 12.1.9.3. Company Financials
- 12.1.9.4. SWOT Analysis
- 12.1.1 OX2 Group AB*List Not Exhaustive
- 12.2. Market Entropy
- 12.2.1 Company's Key Areas Served
- 12.2.2 Recent Developments
- 12.3. Company Market Share Analysis 2025
- 12.3.1 Top 5 Companies Market Share Analysis
- 12.3.2 Top 3 Companies Market Share Analysis
- 12.4. List of Potential Customers
- 13. Research Methodology
List of Figures
- Figure 1: Global Renewable Energy Market in Finland Revenue Breakdown (billion, %) by Region 2025 & 2033
- Figure 2: Global Renewable Energy Market in Finland Volume Breakdown (Gigawatt, %) by Region 2025 & 2033
- Figure 3: North America Renewable Energy Market in Finland Revenue (billion), by Type 2025 & 2033
- Figure 4: North America Renewable Energy Market in Finland Volume (Gigawatt), by Type 2025 & 2033
- Figure 5: North America Renewable Energy Market in Finland Revenue Share (%), by Type 2025 & 2033
- Figure 6: North America Renewable Energy Market in Finland Volume Share (%), by Type 2025 & 2033
- Figure 7: North America Renewable Energy Market in Finland Revenue (billion), by Country 2025 & 2033
- Figure 8: North America Renewable Energy Market in Finland Volume (Gigawatt), by Country 2025 & 2033
- Figure 9: North America Renewable Energy Market in Finland Revenue Share (%), by Country 2025 & 2033
- Figure 10: North America Renewable Energy Market in Finland Volume Share (%), by Country 2025 & 2033
- Figure 11: South America Renewable Energy Market in Finland Revenue (billion), by Type 2025 & 2033
- Figure 12: South America Renewable Energy Market in Finland Volume (Gigawatt), by Type 2025 & 2033
- Figure 13: South America Renewable Energy Market in Finland Revenue Share (%), by Type 2025 & 2033
- Figure 14: South America Renewable Energy Market in Finland Volume Share (%), by Type 2025 & 2033
- Figure 15: South America Renewable Energy Market in Finland Revenue (billion), by Country 2025 & 2033
- Figure 16: South America Renewable Energy Market in Finland Volume (Gigawatt), by Country 2025 & 2033
- Figure 17: South America Renewable Energy Market in Finland Revenue Share (%), by Country 2025 & 2033
- Figure 18: South America Renewable Energy Market in Finland Volume Share (%), by Country 2025 & 2033
- Figure 19: Europe Renewable Energy Market in Finland Revenue (billion), by Type 2025 & 2033
- Figure 20: Europe Renewable Energy Market in Finland Volume (Gigawatt), by Type 2025 & 2033
- Figure 21: Europe Renewable Energy Market in Finland Revenue Share (%), by Type 2025 & 2033
- Figure 22: Europe Renewable Energy Market in Finland Volume Share (%), by Type 2025 & 2033
- Figure 23: Europe Renewable Energy Market in Finland Revenue (billion), by Country 2025 & 2033
- Figure 24: Europe Renewable Energy Market in Finland Volume (Gigawatt), by Country 2025 & 2033
- Figure 25: Europe Renewable Energy Market in Finland Revenue Share (%), by Country 2025 & 2033
- Figure 26: Europe Renewable Energy Market in Finland Volume Share (%), by Country 2025 & 2033
- Figure 27: Middle East & Africa Renewable Energy Market in Finland Revenue (billion), by Type 2025 & 2033
- Figure 28: Middle East & Africa Renewable Energy Market in Finland Volume (Gigawatt), by Type 2025 & 2033
- Figure 29: Middle East & Africa Renewable Energy Market in Finland Revenue Share (%), by Type 2025 & 2033
- Figure 30: Middle East & Africa Renewable Energy Market in Finland Volume Share (%), by Type 2025 & 2033
- Figure 31: Middle East & Africa Renewable Energy Market in Finland Revenue (billion), by Country 2025 & 2033
- Figure 32: Middle East & Africa Renewable Energy Market in Finland Volume (Gigawatt), by Country 2025 & 2033
- Figure 33: Middle East & Africa Renewable Energy Market in Finland Revenue Share (%), by Country 2025 & 2033
- Figure 34: Middle East & Africa Renewable Energy Market in Finland Volume Share (%), by Country 2025 & 2033
- Figure 35: Asia Pacific Renewable Energy Market in Finland Revenue (billion), by Type 2025 & 2033
- Figure 36: Asia Pacific Renewable Energy Market in Finland Volume (Gigawatt), by Type 2025 & 2033
- Figure 37: Asia Pacific Renewable Energy Market in Finland Revenue Share (%), by Type 2025 & 2033
- Figure 38: Asia Pacific Renewable Energy Market in Finland Volume Share (%), by Type 2025 & 2033
- Figure 39: Asia Pacific Renewable Energy Market in Finland Revenue (billion), by Country 2025 & 2033
- Figure 40: Asia Pacific Renewable Energy Market in Finland Volume (Gigawatt), by Country 2025 & 2033
- Figure 41: Asia Pacific Renewable Energy Market in Finland Revenue Share (%), by Country 2025 & 2033
- Figure 42: Asia Pacific Renewable Energy Market in Finland Volume Share (%), by Country 2025 & 2033
List of Tables
- Table 1: Global Renewable Energy Market in Finland Revenue billion Forecast, by Type 2020 & 2033
- Table 2: Global Renewable Energy Market in Finland Volume Gigawatt Forecast, by Type 2020 & 2033
- Table 3: Global Renewable Energy Market in Finland Revenue billion Forecast, by Region 2020 & 2033
- Table 4: Global Renewable Energy Market in Finland Volume Gigawatt Forecast, by Region 2020 & 2033
- Table 5: Global Renewable Energy Market in Finland Revenue billion Forecast, by Type 2020 & 2033
- Table 6: Global Renewable Energy Market in Finland Volume Gigawatt Forecast, by Type 2020 & 2033
- Table 7: Global Renewable Energy Market in Finland Revenue billion Forecast, by Country 2020 & 2033
- Table 8: Global Renewable Energy Market in Finland Volume Gigawatt Forecast, by Country 2020 & 2033
- Table 9: United States Renewable Energy Market in Finland Revenue (billion) Forecast, by Application 2020 & 2033
- Table 10: United States Renewable Energy Market in Finland Volume (Gigawatt) Forecast, by Application 2020 & 2033
- Table 11: Canada Renewable Energy Market in Finland Revenue (billion) Forecast, by Application 2020 & 2033
- Table 12: Canada Renewable Energy Market in Finland Volume (Gigawatt) Forecast, by Application 2020 & 2033
- Table 13: Mexico Renewable Energy Market in Finland Revenue (billion) Forecast, by Application 2020 & 2033
- Table 14: Mexico Renewable Energy Market in Finland Volume (Gigawatt) Forecast, by Application 2020 & 2033
- Table 15: Global Renewable Energy Market in Finland Revenue billion Forecast, by Type 2020 & 2033
- Table 16: Global Renewable Energy Market in Finland Volume Gigawatt Forecast, by Type 2020 & 2033
- Table 17: Global Renewable Energy Market in Finland Revenue billion Forecast, by Country 2020 & 2033
- Table 18: Global Renewable Energy Market in Finland Volume Gigawatt Forecast, by Country 2020 & 2033
- Table 19: Brazil Renewable Energy Market in Finland Revenue (billion) Forecast, by Application 2020 & 2033
- Table 20: Brazil Renewable Energy Market in Finland Volume (Gigawatt) Forecast, by Application 2020 & 2033
- Table 21: Argentina Renewable Energy Market in Finland Revenue (billion) Forecast, by Application 2020 & 2033
- Table 22: Argentina Renewable Energy Market in Finland Volume (Gigawatt) Forecast, by Application 2020 & 2033
- Table 23: Rest of South America Renewable Energy Market in Finland Revenue (billion) Forecast, by Application 2020 & 2033
- Table 24: Rest of South America Renewable Energy Market in Finland Volume (Gigawatt) Forecast, by Application 2020 & 2033
- Table 25: Global Renewable Energy Market in Finland Revenue billion Forecast, by Type 2020 & 2033
- Table 26: Global Renewable Energy Market in Finland Volume Gigawatt Forecast, by Type 2020 & 2033
- Table 27: Global Renewable Energy Market in Finland Revenue billion Forecast, by Country 2020 & 2033
- Table 28: Global Renewable Energy Market in Finland Volume Gigawatt Forecast, by Country 2020 & 2033
- Table 29: United Kingdom Renewable Energy Market in Finland Revenue (billion) Forecast, by Application 2020 & 2033
- Table 30: United Kingdom Renewable Energy Market in Finland Volume (Gigawatt) Forecast, by Application 2020 & 2033
- Table 31: Germany Renewable Energy Market in Finland Revenue (billion) Forecast, by Application 2020 & 2033
- Table 32: Germany Renewable Energy Market in Finland Volume (Gigawatt) Forecast, by Application 2020 & 2033
- Table 33: France Renewable Energy Market in Finland Revenue (billion) Forecast, by Application 2020 & 2033
- Table 34: France Renewable Energy Market in Finland Volume (Gigawatt) Forecast, by Application 2020 & 2033
- Table 35: Italy Renewable Energy Market in Finland Revenue (billion) Forecast, by Application 2020 & 2033
- Table 36: Italy Renewable Energy Market in Finland Volume (Gigawatt) Forecast, by Application 2020 & 2033
- Table 37: Spain Renewable Energy Market in Finland Revenue (billion) Forecast, by Application 2020 & 2033
- Table 38: Spain Renewable Energy Market in Finland Volume (Gigawatt) Forecast, by Application 2020 & 2033
- Table 39: Russia Renewable Energy Market in Finland Revenue (billion) Forecast, by Application 2020 & 2033
- Table 40: Russia Renewable Energy Market in Finland Volume (Gigawatt) Forecast, by Application 2020 & 2033
- Table 41: Benelux Renewable Energy Market in Finland Revenue (billion) Forecast, by Application 2020 & 2033
- Table 42: Benelux Renewable Energy Market in Finland Volume (Gigawatt) Forecast, by Application 2020 & 2033
- Table 43: Nordics Renewable Energy Market in Finland Revenue (billion) Forecast, by Application 2020 & 2033
- Table 44: Nordics Renewable Energy Market in Finland Volume (Gigawatt) Forecast, by Application 2020 & 2033
- Table 45: Rest of Europe Renewable Energy Market in Finland Revenue (billion) Forecast, by Application 2020 & 2033
- Table 46: Rest of Europe Renewable Energy Market in Finland Volume (Gigawatt) Forecast, by Application 2020 & 2033
- Table 47: Global Renewable Energy Market in Finland Revenue billion Forecast, by Type 2020 & 2033
- Table 48: Global Renewable Energy Market in Finland Volume Gigawatt Forecast, by Type 2020 & 2033
- Table 49: Global Renewable Energy Market in Finland Revenue billion Forecast, by Country 2020 & 2033
- Table 50: Global Renewable Energy Market in Finland Volume Gigawatt Forecast, by Country 2020 & 2033
- Table 51: Turkey Renewable Energy Market in Finland Revenue (billion) Forecast, by Application 2020 & 2033
- Table 52: Turkey Renewable Energy Market in Finland Volume (Gigawatt) Forecast, by Application 2020 & 2033
- Table 53: Israel Renewable Energy Market in Finland Revenue (billion) Forecast, by Application 2020 & 2033
- Table 54: Israel Renewable Energy Market in Finland Volume (Gigawatt) Forecast, by Application 2020 & 2033
- Table 55: GCC Renewable Energy Market in Finland Revenue (billion) Forecast, by Application 2020 & 2033
- Table 56: GCC Renewable Energy Market in Finland Volume (Gigawatt) Forecast, by Application 2020 & 2033
- Table 57: North Africa Renewable Energy Market in Finland Revenue (billion) Forecast, by Application 2020 & 2033
- Table 58: North Africa Renewable Energy Market in Finland Volume (Gigawatt) Forecast, by Application 2020 & 2033
- Table 59: South Africa Renewable Energy Market in Finland Revenue (billion) Forecast, by Application 2020 & 2033
- Table 60: South Africa Renewable Energy Market in Finland Volume (Gigawatt) Forecast, by Application 2020 & 2033
- Table 61: Rest of Middle East & Africa Renewable Energy Market in Finland Revenue (billion) Forecast, by Application 2020 & 2033
- Table 62: Rest of Middle East & Africa Renewable Energy Market in Finland Volume (Gigawatt) Forecast, by Application 2020 & 2033
- Table 63: Global Renewable Energy Market in Finland Revenue billion Forecast, by Type 2020 & 2033
- Table 64: Global Renewable Energy Market in Finland Volume Gigawatt Forecast, by Type 2020 & 2033
- Table 65: Global Renewable Energy Market in Finland Revenue billion Forecast, by Country 2020 & 2033
- Table 66: Global Renewable Energy Market in Finland Volume Gigawatt Forecast, by Country 2020 & 2033
- Table 67: China Renewable Energy Market in Finland Revenue (billion) Forecast, by Application 2020 & 2033
- Table 68: China Renewable Energy Market in Finland Volume (Gigawatt) Forecast, by Application 2020 & 2033
- Table 69: India Renewable Energy Market in Finland Revenue (billion) Forecast, by Application 2020 & 2033
- Table 70: India Renewable Energy Market in Finland Volume (Gigawatt) Forecast, by Application 2020 & 2033
- Table 71: Japan Renewable Energy Market in Finland Revenue (billion) Forecast, by Application 2020 & 2033
- Table 72: Japan Renewable Energy Market in Finland Volume (Gigawatt) Forecast, by Application 2020 & 2033
- Table 73: South Korea Renewable Energy Market in Finland Revenue (billion) Forecast, by Application 2020 & 2033
- Table 74: South Korea Renewable Energy Market in Finland Volume (Gigawatt) Forecast, by Application 2020 & 2033
- Table 75: ASEAN Renewable Energy Market in Finland Revenue (billion) Forecast, by Application 2020 & 2033
- Table 76: ASEAN Renewable Energy Market in Finland Volume (Gigawatt) Forecast, by Application 2020 & 2033
- Table 77: Oceania Renewable Energy Market in Finland Revenue (billion) Forecast, by Application 2020 & 2033
- Table 78: Oceania Renewable Energy Market in Finland Volume (Gigawatt) Forecast, by Application 2020 & 2033
- Table 79: Rest of Asia Pacific Renewable Energy Market in Finland Revenue (billion) Forecast, by Application 2020 & 2033
- Table 80: Rest of Asia Pacific Renewable Energy Market in Finland Volume (Gigawatt) Forecast, by Application 2020 & 2033
Frequently Asked Questions
1. What is the projected Compound Annual Growth Rate (CAGR) of the Renewable Energy Market in Finland?
The projected CAGR is approximately 12.37%.
2. Which companies are prominent players in the Renewable Energy Market in Finland?
Key companies in the market include OX2 Group AB*List Not Exhaustive, Vattenfall AB, Fortum Oyj, CPC Finland Oyj, UPM Kymmene Oyj, Pohjolan Voima Oyj, ABO Wind AG, Valoe Oyj, SGS AG.
3. What are the main segments of the Renewable Energy Market in Finland?
The market segments include Type.
4. Can you provide details about the market size?
The market size is estimated to be USD 12.8 billion as of 2022.
5. What are some drivers contributing to market growth?
Increasing Infrastructure Development4.; Rising Emphasis Water and Wastewater Management.
6. What are the notable trends driving market growth?
Wind Energy to Drive the Market.
7. Are there any restraints impacting market growth?
Volatility in Raw Material Prices.
8. Can you provide examples of recent developments in the market?
N/A
9. What pricing options are available for accessing the report?
Pricing options include single-user, multi-user, and enterprise licenses priced at USD 3800, USD 4500, and USD 5800 respectively.
10. Is the market size provided in terms of value or volume?
The market size is provided in terms of value, measured in billion and volume, measured in Gigawatt.
11. Are there any specific market keywords associated with the report?
Yes, the market keyword associated with the report is "Renewable Energy Market in Finland," which aids in identifying and referencing the specific market segment covered.
12. How do I determine which pricing option suits my needs best?
The pricing options vary based on user requirements and access needs. Individual users may opt for single-user licenses, while businesses requiring broader access may choose multi-user or enterprise licenses for cost-effective access to the report.
13. Are there any additional resources or data provided in the Renewable Energy Market in Finland report?
While the report offers comprehensive insights, it's advisable to review the specific contents or supplementary materials provided to ascertain if additional resources or data are available.
14. How can I stay updated on further developments or reports in the Renewable Energy Market in Finland?
To stay informed about further developments, trends, and reports in the Renewable Energy Market in Finland, consider subscribing to industry newsletters, following relevant companies and organizations, or regularly checking reputable industry news sources and publications.
Methodology
Step 1 - Identification of Relevant Samples Size from Population Database


Step 2 - Approaches for Defining Global Market Size (Value, Volume* & Price*)

Note*: In applicable scenarios
Step 3 - Data Sources
Primary Research
- Web Analytics
- Survey Reports
- Research Institute
- Latest Research Reports
- Opinion Leaders
Secondary Research
- Annual Reports
- White Paper
- Latest Press Release
- Industry Association
- Paid Database
- Investor Presentations

Step 4 - Data Triangulation
Involves using different sources of information in order to increase the validity of a study
These sources are likely to be stakeholders in a program - participants, other researchers, program staff, other community members, and so on.
Then we put all data in single framework & apply various statistical tools to find out the dynamic on the market.
During the analysis stage, feedback from the stakeholder groups would be compared to determine areas of agreement as well as areas of divergence