
Key Insights
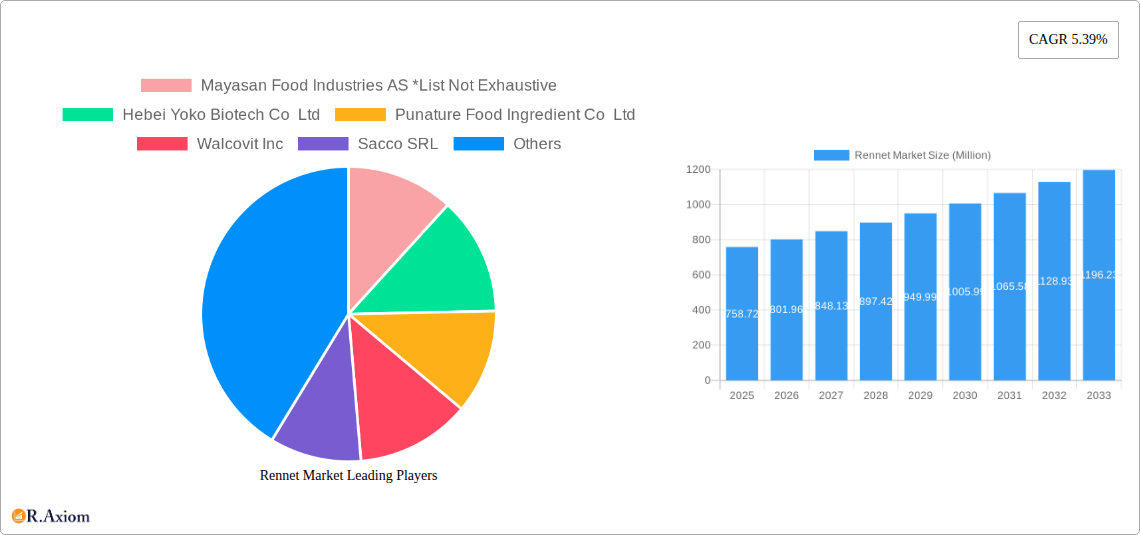
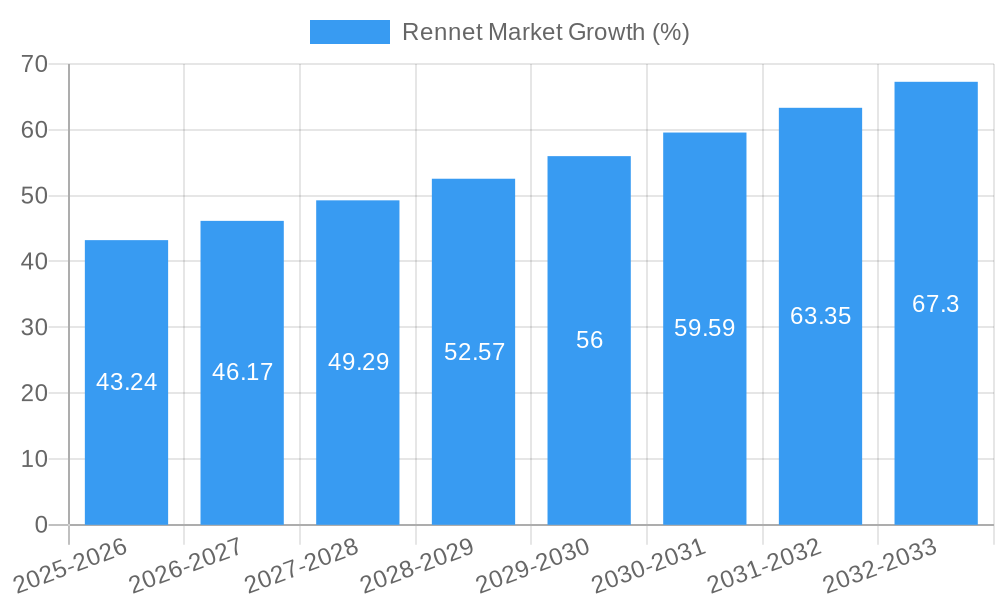
The global rennet market, valued at $758.72 million in 2025, is projected to experience robust growth, driven by a Compound Annual Growth Rate (CAGR) of 5.39% from 2025 to 2033. This expansion is fueled by several key factors. The increasing demand for cheese and other dairy products globally is a primary driver, as rennet is an essential ingredient in cheesemaking. Furthermore, the rising adoption of microbial and fermentation-produced chymosin rennet reflects a growing preference for vegetarian and halal-certified products, catering to expanding consumer segments with specific dietary needs and preferences. Technological advancements in rennet production, leading to higher quality and more efficient processes, also contribute to market growth. However, fluctuations in raw material prices and potential regulatory changes related to food additives could pose challenges to sustained market expansion. The market segmentation reveals a preference towards animal-derived rennet, followed by microbial and FPC rennet, reflecting both established traditions and the evolving consumer landscape. The liquid form of rennet dominates the market, suggesting ease of use and integration into manufacturing processes. Leading players, such as Chr. Hansen Holding A/S and DSM, leverage their established expertise and distribution networks to solidify their market positions.
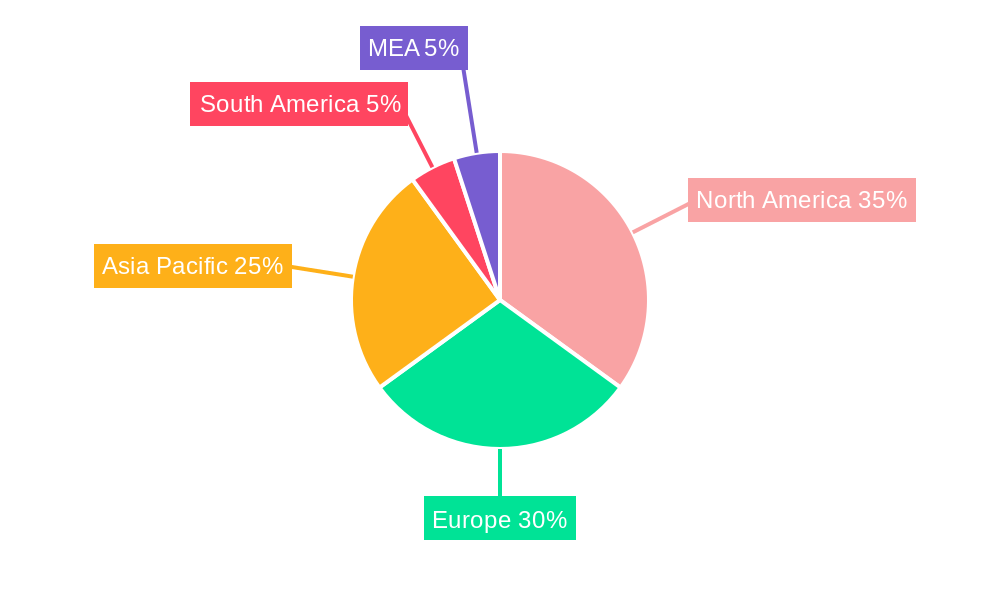
Geographic analysis indicates significant market presence across North America, Europe, and Asia Pacific. North America benefits from high cheese consumption and robust dairy industries, while Europe exhibits strong demand for various cheese types and specialized rennet varieties. The Asia Pacific region, particularly China and India, shows significant growth potential, driven by rising disposable incomes and increasing adoption of Westernized dietary habits. While South America and the Middle East and Africa show promising growth trajectories, they currently represent smaller market shares compared to established regions. The consistent demand across diverse geographic regions reflects the universal importance of rennet in cheese production, influencing overall market growth projections.
Rennet Market: A Comprehensive Report (2019-2033)
This in-depth report provides a comprehensive analysis of the global rennet market, encompassing historical data (2019-2024), current estimations (2025), and future projections (2025-2033). The study offers actionable insights for industry stakeholders, including manufacturers, distributors, and investors, seeking to navigate this dynamic market landscape. With a focus on key segments, leading players, and emerging trends, this report is an essential resource for informed decision-making. The report analyzes a market valued at xx Million in 2025, projected to reach xx Million by 2033, exhibiting a CAGR of xx% during the forecast period.
Rennet Market Market Concentration & Innovation
The global rennet market exhibits a moderately concentrated structure, with a handful of key players holding significant market share. While precise figures are proprietary, Chr. Hansen Holding A/S, DSM, and AFFCO are recognized as major players, commanding a combined xx% market share in 2025 (estimated). Market concentration is influenced by factors such as economies of scale in production, strong brand recognition, and established distribution networks.
Innovation in the rennet market is driven by several factors:
- Demand for Vegetarian/Vegan Options: The growing popularity of vegetarian and vegan diets fuels the development of microbial and vegetable rennet alternatives.
- Technological Advancements: Improvements in fermentation technologies are enhancing the efficiency and cost-effectiveness of microbial rennet production.
- Regulatory Landscape: Stricter regulations regarding food safety and labeling influence innovation in rennet production and processing.
Product substitution is primarily observed between different rennet types, with microbial and vegetable rennets competing with animal-derived rennet. The increasing demand for halal and kosher-certified products further drives innovation and diversification within the market.
Mergers and acquisitions (M&A) activities play a significant role in shaping market dynamics. For example, DSM's acquisition of Koninklijke CSK Food Enrichment CV in 2019 significantly expanded its presence in the dairy solutions sector. While precise M&A deal values vary, such transactions often involve hundreds of millions of dollars, consolidating market share and driving technological advancements.
Rennet Market Industry Trends & Insights
The global rennet market is experiencing robust growth, fueled by several key factors. The increasing global demand for cheese and other dairy products is a primary driver, directly impacting the need for rennet as a crucial ingredient in cheesemaking. The shift towards vegetarian and vegan diets is creating a surge in demand for microbial and plant-based rennet alternatives. Technological advancements in fermentation processes are driving down production costs and improving the quality of microbial rennets, making them a more competitive option. Consumer preferences are also evolving, with a growing emphasis on natural and sustainable food ingredients.
This necessitates a shift toward more ethically sourced and environmentally friendly rennet production methods, creating opportunities for innovation and market expansion. Competitive dynamics are characterized by both intense competition among established players and the emergence of new entrants, especially in the microbial and vegetable rennet segments. This dynamic landscape encourages continuous innovation and improvement in product quality, cost-efficiency, and overall sustainability.
Dominant Markets & Segments in Rennet Market
The North American region currently holds the largest market share for rennet, driven by the high consumption of cheese and dairy products. Europe follows closely, while Asia-Pacific is a rapidly growing market exhibiting substantial growth potential due to rising disposable incomes and increasing demand for dairy products.
Dominant Segments:
- Type: Microbial rennet is experiencing the fastest growth due to its increasing acceptance among consumers and manufacturers seeking alternatives to animal rennet.
- Form: Liquid rennet remains the most dominant form, primarily due to its ease of use in cheesemaking processes. However, powder and paste forms are gaining traction due to their longer shelf life and ease of storage and transportation.
Key Drivers for Dominant Regions and Segments:
- North America: High cheese consumption, established dairy industry, and favorable regulatory frameworks.
- Europe: Similar to North America, but with a stronger emphasis on sustainability and ethical sourcing.
- Asia-Pacific: Rapidly expanding dairy industry, increasing disposable incomes, and growing demand for Western-style dairy products.
- Microbial Rennet: Growing consumer preference for vegetarian/vegan options and technological advancements making it more cost-effective.
- Liquid Rennet: Ease of use in traditional cheesemaking processes.
Rennet Market Product Developments
Recent product developments include improved microbial rennet formulations with enhanced enzymatic activity and improved shelf life. These advancements increase efficiency and reduce production costs, making microbial rennet a more competitive alternative to animal rennet. There is also a focus on developing novel vegetable rennet sources with enhanced functionality and improved flavor profiles. These innovations cater to growing consumer demand for natural and sustainable food products. The market is moving towards standardized and consistent product quality, driven by stricter regulations and growing consumer expectations.
Report Scope & Segmentation Analysis
This report segments the rennet market based on type (Animal-Derived Rennet, Microbial Rennet, FPC-Fermentation Produced Chymosin Rennet, Vegetable Rennet) and form (Liquid, Powder, Paste). Each segment is analyzed in terms of its market size, growth rate, and key competitive dynamics.
- Animal-Derived Rennet: This segment is expected to experience relatively slower growth compared to other segments, mainly due to the increasing demand for vegetarian and vegan options.
- Microbial Rennet: This segment is expected to exhibit strong growth, driven by consumer demand and technological advancements.
- FPC-Fermentation Produced Chymosin Rennet: This is a rapidly growing segment within the microbial rennet category, benefiting from its high purity and consistent quality.
- Vegetable Rennet: This segment is also expected to show substantial growth, driven by the rising demand for plant-based alternatives.
- Liquid, Powder, Paste: The choice of form depends largely on application and storage preferences. Liquid rennet dominates due to its established use, while powder and paste formats offer advantages in shelf life and transportation.
Key Drivers of Rennet Market Growth
Several factors fuel the rennet market's growth: increasing global cheese consumption, expanding dairy industry, growing demand for vegetarian and vegan cheese alternatives, and technological improvements in rennet production, particularly in microbial rennet manufacturing. Regulatory changes promoting transparency and sustainable practices further shape the market, while rising disposable incomes in developing economies increase demand for dairy products.
Challenges in the Rennet Market Sector
Challenges include fluctuations in raw material prices, particularly for animal-derived rennet. Stringent regulatory compliance requirements and concerns about food safety can also increase production costs and complexity. Intense competition among existing players and the emergence of new entrants create pressure on pricing and profitability. Supply chain disruptions and geopolitical instability can impact raw material availability and overall production. Furthermore, consumer perception and acceptance of different rennet types influence market adoption rates.
Emerging Opportunities in Rennet Market
Emerging opportunities include the development of novel rennet sources, such as those derived from genetically modified organisms or precision fermentation. Expanding into emerging markets, especially in developing economies with growing dairy consumption, presents significant potential. Focus on sustainable and ethical sourcing practices will create a competitive advantage. There's scope to develop customized rennet solutions tailored to specific cheese types and applications, further enhancing market penetration. Lastly, innovations in packaging and distribution to ensure longer shelf life and efficient transportation will unlock further opportunities.
Leading Players in the Rennet Market Market
- Mayasan Food Industries AS
- Hebei Yoko Biotech Co Ltd
- Punature Food Ingredient Co Ltd
- Walcovit Inc
- Sacco SRL
- International Flavors & Fragrances Inc
- Chr. Hansen Holding A/S
- AFFCO
- Koninklijke DSM NV
- Intermak Inc
Key Developments in Rennet Market Industry
- November 2019: DSM's acquisition of Koninklijke CSK Food Enrichment CV for approximately EUR 150 Million expanded its dairy solutions portfolio and production capacity.
- January 2020: Punature Food Ingredient Co. Ltd. commenced chymosin production in its China facility, increasing local supply and potentially impacting regional pricing.
- August 2020: AFFCO's Renco doubled its rennet production capacity through a multi-million dollar investment, strengthening its position and partnership with The Cheese Connection in the US market.
Strategic Outlook for Rennet Market Market
The rennet market is poised for continued growth, driven by rising global dairy consumption and the increasing demand for vegetarian and vegan cheese alternatives. Innovations in production technologies and the development of novel rennet sources will shape the market's future. Companies focusing on sustainability, ethical sourcing, and product diversification will be well-positioned for success in this evolving landscape. Expanding into emerging markets and catering to diverse consumer preferences will be key strategies for capturing significant market share.
Rennet Market Segmentation
-
1. Type
- 1.1. Animal-Derived Rennet
- 1.2. Microbial Rennet
- 1.3. FPC-Fermentation Produced Chymosin Rennet
- 1.4. Vegetable Rennet
-
2. Form
- 2.1. Liquid
- 2.2. Powder
- 2.3. Paste
Rennet Market Segmentation By Geography
-
1. North America
- 1.1. United States
- 1.2. Canada
- 1.3. Mexico
- 1.4. Rest of North America
-
2. Europe
- 2.1. United Kingdom
- 2.2. Germany
- 2.3. Spain
- 2.4. France
- 2.5. Italy
- 2.6. Russia
- 2.7. Rest of Europe
-
3. Asia Pacific
- 3.1. China
- 3.2. Japan
- 3.3. India
- 3.4. Australia
- 3.5. Rest of Asia Pacific
-
4. Rest of the World
- 4.1. South America
- 4.2. Middle East
- 4.3. Africa
Rennet Market REPORT HIGHLIGHTS
| Aspects | Details |
|---|---|
| Study Period | 2019-2033 |
| Base Year | 2024 |
| Estimated Year | 2025 |
| Forecast Period | 2025-2033 |
| Historical Period | 2019-2024 |
| Growth Rate | CAGR of 5.39% from 2019-2033 |
| Segmentation |
|
Table of Contents
- 1. Introduction
- 1.1. Research Scope
- 1.2. Market Segmentation
- 1.3. Research Methodology
- 1.4. Definitions and Assumptions
- 2. Executive Summary
- 2.1. Introduction
- 3. Market Dynamics
- 3.1. Introduction
- 3.2. Market Drivers
- 3.2.1. Rising Health Consciousness among consumer
- 3.3. Market Restrains
- 3.3.1. High Cost of natural Ingredients
- 3.4. Market Trends
- 3.4.1. Growing Cheese Market Boosting Demand for Rennet
- 4. Market Factor Analysis
- 4.1. Porters Five Forces
- 4.2. Supply/Value Chain
- 4.3. PESTEL analysis
- 4.4. Market Entropy
- 4.5. Patent/Trademark Analysis
- 5. Global Rennet Market Analysis, Insights and Forecast, 2019-2031
- 5.1. Market Analysis, Insights and Forecast - by Type
- 5.1.1. Animal-Derived Rennet
- 5.1.2. Microbial Rennet
- 5.1.3. FPC-Fermentation Produced Chymosin Rennet
- 5.1.4. Vegetable Rennet
- 5.2. Market Analysis, Insights and Forecast - by Form
- 5.2.1. Liquid
- 5.2.2. Powder
- 5.2.3. Paste
- 5.3. Market Analysis, Insights and Forecast - by Region
- 5.3.1. North America
- 5.3.2. Europe
- 5.3.3. Asia Pacific
- 5.3.4. Rest of the World
- 5.1. Market Analysis, Insights and Forecast - by Type
- 6. North America Rennet Market Analysis, Insights and Forecast, 2019-2031
- 6.1. Market Analysis, Insights and Forecast - by Type
- 6.1.1. Animal-Derived Rennet
- 6.1.2. Microbial Rennet
- 6.1.3. FPC-Fermentation Produced Chymosin Rennet
- 6.1.4. Vegetable Rennet
- 6.2. Market Analysis, Insights and Forecast - by Form
- 6.2.1. Liquid
- 6.2.2. Powder
- 6.2.3. Paste
- 6.1. Market Analysis, Insights and Forecast - by Type
- 7. Europe Rennet Market Analysis, Insights and Forecast, 2019-2031
- 7.1. Market Analysis, Insights and Forecast - by Type
- 7.1.1. Animal-Derived Rennet
- 7.1.2. Microbial Rennet
- 7.1.3. FPC-Fermentation Produced Chymosin Rennet
- 7.1.4. Vegetable Rennet
- 7.2. Market Analysis, Insights and Forecast - by Form
- 7.2.1. Liquid
- 7.2.2. Powder
- 7.2.3. Paste
- 7.1. Market Analysis, Insights and Forecast - by Type
- 8. Asia Pacific Rennet Market Analysis, Insights and Forecast, 2019-2031
- 8.1. Market Analysis, Insights and Forecast - by Type
- 8.1.1. Animal-Derived Rennet
- 8.1.2. Microbial Rennet
- 8.1.3. FPC-Fermentation Produced Chymosin Rennet
- 8.1.4. Vegetable Rennet
- 8.2. Market Analysis, Insights and Forecast - by Form
- 8.2.1. Liquid
- 8.2.2. Powder
- 8.2.3. Paste
- 8.1. Market Analysis, Insights and Forecast - by Type
- 9. Rest of the World Rennet Market Analysis, Insights and Forecast, 2019-2031
- 9.1. Market Analysis, Insights and Forecast - by Type
- 9.1.1. Animal-Derived Rennet
- 9.1.2. Microbial Rennet
- 9.1.3. FPC-Fermentation Produced Chymosin Rennet
- 9.1.4. Vegetable Rennet
- 9.2. Market Analysis, Insights and Forecast - by Form
- 9.2.1. Liquid
- 9.2.2. Powder
- 9.2.3. Paste
- 9.1. Market Analysis, Insights and Forecast - by Type
- 10. North America Rennet Market Analysis, Insights and Forecast, 2019-2031
- 10.1. Market Analysis, Insights and Forecast - By Country/Sub-region
- 10.1.1 United States
- 10.1.2 Canada
- 10.1.3 Mexico
- 11. Europe Rennet Market Analysis, Insights and Forecast, 2019-2031
- 11.1. Market Analysis, Insights and Forecast - By Country/Sub-region
- 11.1.1 Germany
- 11.1.2 United Kingdom
- 11.1.3 France
- 11.1.4 Spain
- 11.1.5 Italy
- 11.1.6 Spain
- 11.1.7 Belgium
- 11.1.8 Netherland
- 11.1.9 Nordics
- 11.1.10 Rest of Europe
- 12. Asia Pacific Rennet Market Analysis, Insights and Forecast, 2019-2031
- 12.1. Market Analysis, Insights and Forecast - By Country/Sub-region
- 12.1.1 China
- 12.1.2 Japan
- 12.1.3 India
- 12.1.4 South Korea
- 12.1.5 Southeast Asia
- 12.1.6 Australia
- 12.1.7 Indonesia
- 12.1.8 Phillipes
- 12.1.9 Singapore
- 12.1.10 Thailandc
- 12.1.11 Rest of Asia Pacific
- 13. South America Rennet Market Analysis, Insights and Forecast, 2019-2031
- 13.1. Market Analysis, Insights and Forecast - By Country/Sub-region
- 13.1.1 Brazil
- 13.1.2 Argentina
- 13.1.3 Peru
- 13.1.4 Chile
- 13.1.5 Colombia
- 13.1.6 Ecuador
- 13.1.7 Venezuela
- 13.1.8 Rest of South America
- 14. North America Rennet Market Analysis, Insights and Forecast, 2019-2031
- 14.1. Market Analysis, Insights and Forecast - By Country/Sub-region
- 14.1.1 United States
- 14.1.2 Canada
- 14.1.3 Mexico
- 15. MEA Rennet Market Analysis, Insights and Forecast, 2019-2031
- 15.1. Market Analysis, Insights and Forecast - By Country/Sub-region
- 15.1.1 United Arab Emirates
- 15.1.2 Saudi Arabia
- 15.1.3 South Africa
- 15.1.4 Rest of Middle East and Africa
- 16. Competitive Analysis
- 16.1. Global Market Share Analysis 2024
- 16.2. Company Profiles
- 16.2.1 Mayasan Food Industries AS *List Not Exhaustive
- 16.2.1.1. Overview
- 16.2.1.2. Products
- 16.2.1.3. SWOT Analysis
- 16.2.1.4. Recent Developments
- 16.2.1.5. Financials (Based on Availability)
- 16.2.2 Hebei Yoko Biotech Co Ltd
- 16.2.2.1. Overview
- 16.2.2.2. Products
- 16.2.2.3. SWOT Analysis
- 16.2.2.4. Recent Developments
- 16.2.2.5. Financials (Based on Availability)
- 16.2.3 Punature Food Ingredient Co Ltd
- 16.2.3.1. Overview
- 16.2.3.2. Products
- 16.2.3.3. SWOT Analysis
- 16.2.3.4. Recent Developments
- 16.2.3.5. Financials (Based on Availability)
- 16.2.4 Walcovit Inc
- 16.2.4.1. Overview
- 16.2.4.2. Products
- 16.2.4.3. SWOT Analysis
- 16.2.4.4. Recent Developments
- 16.2.4.5. Financials (Based on Availability)
- 16.2.5 Sacco SRL
- 16.2.5.1. Overview
- 16.2.5.2. Products
- 16.2.5.3. SWOT Analysis
- 16.2.5.4. Recent Developments
- 16.2.5.5. Financials (Based on Availability)
- 16.2.6 International Flavors & Fragrances Inc
- 16.2.6.1. Overview
- 16.2.6.2. Products
- 16.2.6.3. SWOT Analysis
- 16.2.6.4. Recent Developments
- 16.2.6.5. Financials (Based on Availability)
- 16.2.7 Chr Hansen Holding A/S
- 16.2.7.1. Overview
- 16.2.7.2. Products
- 16.2.7.3. SWOT Analysis
- 16.2.7.4. Recent Developments
- 16.2.7.5. Financials (Based on Availability)
- 16.2.8 AFFCO
- 16.2.8.1. Overview
- 16.2.8.2. Products
- 16.2.8.3. SWOT Analysis
- 16.2.8.4. Recent Developments
- 16.2.8.5. Financials (Based on Availability)
- 16.2.9 Koninklijke DSM NV
- 16.2.9.1. Overview
- 16.2.9.2. Products
- 16.2.9.3. SWOT Analysis
- 16.2.9.4. Recent Developments
- 16.2.9.5. Financials (Based on Availability)
- 16.2.10 Intermak Inc
- 16.2.10.1. Overview
- 16.2.10.2. Products
- 16.2.10.3. SWOT Analysis
- 16.2.10.4. Recent Developments
- 16.2.10.5. Financials (Based on Availability)
- 16.2.1 Mayasan Food Industries AS *List Not Exhaustive
List of Figures
- Figure 1: Global Rennet Market Revenue Breakdown (Million, %) by Region 2024 & 2032
- Figure 2: North America Rennet Market Revenue (Million), by Country 2024 & 2032
- Figure 3: North America Rennet Market Revenue Share (%), by Country 2024 & 2032
- Figure 4: Europe Rennet Market Revenue (Million), by Country 2024 & 2032
- Figure 5: Europe Rennet Market Revenue Share (%), by Country 2024 & 2032
- Figure 6: Asia Pacific Rennet Market Revenue (Million), by Country 2024 & 2032
- Figure 7: Asia Pacific Rennet Market Revenue Share (%), by Country 2024 & 2032
- Figure 8: South America Rennet Market Revenue (Million), by Country 2024 & 2032
- Figure 9: South America Rennet Market Revenue Share (%), by Country 2024 & 2032
- Figure 10: North America Rennet Market Revenue (Million), by Country 2024 & 2032
- Figure 11: North America Rennet Market Revenue Share (%), by Country 2024 & 2032
- Figure 12: MEA Rennet Market Revenue (Million), by Country 2024 & 2032
- Figure 13: MEA Rennet Market Revenue Share (%), by Country 2024 & 2032
- Figure 14: North America Rennet Market Revenue (Million), by Type 2024 & 2032
- Figure 15: North America Rennet Market Revenue Share (%), by Type 2024 & 2032
- Figure 16: North America Rennet Market Revenue (Million), by Form 2024 & 2032
- Figure 17: North America Rennet Market Revenue Share (%), by Form 2024 & 2032
- Figure 18: North America Rennet Market Revenue (Million), by Country 2024 & 2032
- Figure 19: North America Rennet Market Revenue Share (%), by Country 2024 & 2032
- Figure 20: Europe Rennet Market Revenue (Million), by Type 2024 & 2032
- Figure 21: Europe Rennet Market Revenue Share (%), by Type 2024 & 2032
- Figure 22: Europe Rennet Market Revenue (Million), by Form 2024 & 2032
- Figure 23: Europe Rennet Market Revenue Share (%), by Form 2024 & 2032
- Figure 24: Europe Rennet Market Revenue (Million), by Country 2024 & 2032
- Figure 25: Europe Rennet Market Revenue Share (%), by Country 2024 & 2032
- Figure 26: Asia Pacific Rennet Market Revenue (Million), by Type 2024 & 2032
- Figure 27: Asia Pacific Rennet Market Revenue Share (%), by Type 2024 & 2032
- Figure 28: Asia Pacific Rennet Market Revenue (Million), by Form 2024 & 2032
- Figure 29: Asia Pacific Rennet Market Revenue Share (%), by Form 2024 & 2032
- Figure 30: Asia Pacific Rennet Market Revenue (Million), by Country 2024 & 2032
- Figure 31: Asia Pacific Rennet Market Revenue Share (%), by Country 2024 & 2032
- Figure 32: Rest of the World Rennet Market Revenue (Million), by Type 2024 & 2032
- Figure 33: Rest of the World Rennet Market Revenue Share (%), by Type 2024 & 2032
- Figure 34: Rest of the World Rennet Market Revenue (Million), by Form 2024 & 2032
- Figure 35: Rest of the World Rennet Market Revenue Share (%), by Form 2024 & 2032
- Figure 36: Rest of the World Rennet Market Revenue (Million), by Country 2024 & 2032
- Figure 37: Rest of the World Rennet Market Revenue Share (%), by Country 2024 & 2032
List of Tables
- Table 1: Global Rennet Market Revenue Million Forecast, by Region 2019 & 2032
- Table 2: Global Rennet Market Revenue Million Forecast, by Type 2019 & 2032
- Table 3: Global Rennet Market Revenue Million Forecast, by Form 2019 & 2032
- Table 4: Global Rennet Market Revenue Million Forecast, by Region 2019 & 2032
- Table 5: Global Rennet Market Revenue Million Forecast, by Country 2019 & 2032
- Table 6: United States Rennet Market Revenue (Million) Forecast, by Application 2019 & 2032
- Table 7: Canada Rennet Market Revenue (Million) Forecast, by Application 2019 & 2032
- Table 8: Mexico Rennet Market Revenue (Million) Forecast, by Application 2019 & 2032
- Table 9: Global Rennet Market Revenue Million Forecast, by Country 2019 & 2032
- Table 10: Germany Rennet Market Revenue (Million) Forecast, by Application 2019 & 2032
- Table 11: United Kingdom Rennet Market Revenue (Million) Forecast, by Application 2019 & 2032
- Table 12: France Rennet Market Revenue (Million) Forecast, by Application 2019 & 2032
- Table 13: Spain Rennet Market Revenue (Million) Forecast, by Application 2019 & 2032
- Table 14: Italy Rennet Market Revenue (Million) Forecast, by Application 2019 & 2032
- Table 15: Spain Rennet Market Revenue (Million) Forecast, by Application 2019 & 2032
- Table 16: Belgium Rennet Market Revenue (Million) Forecast, by Application 2019 & 2032
- Table 17: Netherland Rennet Market Revenue (Million) Forecast, by Application 2019 & 2032
- Table 18: Nordics Rennet Market Revenue (Million) Forecast, by Application 2019 & 2032
- Table 19: Rest of Europe Rennet Market Revenue (Million) Forecast, by Application 2019 & 2032
- Table 20: Global Rennet Market Revenue Million Forecast, by Country 2019 & 2032
- Table 21: China Rennet Market Revenue (Million) Forecast, by Application 2019 & 2032
- Table 22: Japan Rennet Market Revenue (Million) Forecast, by Application 2019 & 2032
- Table 23: India Rennet Market Revenue (Million) Forecast, by Application 2019 & 2032
- Table 24: South Korea Rennet Market Revenue (Million) Forecast, by Application 2019 & 2032
- Table 25: Southeast Asia Rennet Market Revenue (Million) Forecast, by Application 2019 & 2032
- Table 26: Australia Rennet Market Revenue (Million) Forecast, by Application 2019 & 2032
- Table 27: Indonesia Rennet Market Revenue (Million) Forecast, by Application 2019 & 2032
- Table 28: Phillipes Rennet Market Revenue (Million) Forecast, by Application 2019 & 2032
- Table 29: Singapore Rennet Market Revenue (Million) Forecast, by Application 2019 & 2032
- Table 30: Thailandc Rennet Market Revenue (Million) Forecast, by Application 2019 & 2032
- Table 31: Rest of Asia Pacific Rennet Market Revenue (Million) Forecast, by Application 2019 & 2032
- Table 32: Global Rennet Market Revenue Million Forecast, by Country 2019 & 2032
- Table 33: Brazil Rennet Market Revenue (Million) Forecast, by Application 2019 & 2032
- Table 34: Argentina Rennet Market Revenue (Million) Forecast, by Application 2019 & 2032
- Table 35: Peru Rennet Market Revenue (Million) Forecast, by Application 2019 & 2032
- Table 36: Chile Rennet Market Revenue (Million) Forecast, by Application 2019 & 2032
- Table 37: Colombia Rennet Market Revenue (Million) Forecast, by Application 2019 & 2032
- Table 38: Ecuador Rennet Market Revenue (Million) Forecast, by Application 2019 & 2032
- Table 39: Venezuela Rennet Market Revenue (Million) Forecast, by Application 2019 & 2032
- Table 40: Rest of South America Rennet Market Revenue (Million) Forecast, by Application 2019 & 2032
- Table 41: Global Rennet Market Revenue Million Forecast, by Country 2019 & 2032
- Table 42: United States Rennet Market Revenue (Million) Forecast, by Application 2019 & 2032
- Table 43: Canada Rennet Market Revenue (Million) Forecast, by Application 2019 & 2032
- Table 44: Mexico Rennet Market Revenue (Million) Forecast, by Application 2019 & 2032
- Table 45: Global Rennet Market Revenue Million Forecast, by Country 2019 & 2032
- Table 46: United Arab Emirates Rennet Market Revenue (Million) Forecast, by Application 2019 & 2032
- Table 47: Saudi Arabia Rennet Market Revenue (Million) Forecast, by Application 2019 & 2032
- Table 48: South Africa Rennet Market Revenue (Million) Forecast, by Application 2019 & 2032
- Table 49: Rest of Middle East and Africa Rennet Market Revenue (Million) Forecast, by Application 2019 & 2032
- Table 50: Global Rennet Market Revenue Million Forecast, by Type 2019 & 2032
- Table 51: Global Rennet Market Revenue Million Forecast, by Form 2019 & 2032
- Table 52: Global Rennet Market Revenue Million Forecast, by Country 2019 & 2032
- Table 53: United States Rennet Market Revenue (Million) Forecast, by Application 2019 & 2032
- Table 54: Canada Rennet Market Revenue (Million) Forecast, by Application 2019 & 2032
- Table 55: Mexico Rennet Market Revenue (Million) Forecast, by Application 2019 & 2032
- Table 56: Rest of North America Rennet Market Revenue (Million) Forecast, by Application 2019 & 2032
- Table 57: Global Rennet Market Revenue Million Forecast, by Type 2019 & 2032
- Table 58: Global Rennet Market Revenue Million Forecast, by Form 2019 & 2032
- Table 59: Global Rennet Market Revenue Million Forecast, by Country 2019 & 2032
- Table 60: United Kingdom Rennet Market Revenue (Million) Forecast, by Application 2019 & 2032
- Table 61: Germany Rennet Market Revenue (Million) Forecast, by Application 2019 & 2032
- Table 62: Spain Rennet Market Revenue (Million) Forecast, by Application 2019 & 2032
- Table 63: France Rennet Market Revenue (Million) Forecast, by Application 2019 & 2032
- Table 64: Italy Rennet Market Revenue (Million) Forecast, by Application 2019 & 2032
- Table 65: Russia Rennet Market Revenue (Million) Forecast, by Application 2019 & 2032
- Table 66: Rest of Europe Rennet Market Revenue (Million) Forecast, by Application 2019 & 2032
- Table 67: Global Rennet Market Revenue Million Forecast, by Type 2019 & 2032
- Table 68: Global Rennet Market Revenue Million Forecast, by Form 2019 & 2032
- Table 69: Global Rennet Market Revenue Million Forecast, by Country 2019 & 2032
- Table 70: China Rennet Market Revenue (Million) Forecast, by Application 2019 & 2032
- Table 71: Japan Rennet Market Revenue (Million) Forecast, by Application 2019 & 2032
- Table 72: India Rennet Market Revenue (Million) Forecast, by Application 2019 & 2032
- Table 73: Australia Rennet Market Revenue (Million) Forecast, by Application 2019 & 2032
- Table 74: Rest of Asia Pacific Rennet Market Revenue (Million) Forecast, by Application 2019 & 2032
- Table 75: Global Rennet Market Revenue Million Forecast, by Type 2019 & 2032
- Table 76: Global Rennet Market Revenue Million Forecast, by Form 2019 & 2032
- Table 77: Global Rennet Market Revenue Million Forecast, by Country 2019 & 2032
- Table 78: South America Rennet Market Revenue (Million) Forecast, by Application 2019 & 2032
- Table 79: Middle East Rennet Market Revenue (Million) Forecast, by Application 2019 & 2032
- Table 80: Africa Rennet Market Revenue (Million) Forecast, by Application 2019 & 2032
Frequently Asked Questions
1. What is the projected Compound Annual Growth Rate (CAGR) of the Rennet Market?
The projected CAGR is approximately 5.39%.
2. Which companies are prominent players in the Rennet Market?
Key companies in the market include Mayasan Food Industries AS *List Not Exhaustive, Hebei Yoko Biotech Co Ltd, Punature Food Ingredient Co Ltd, Walcovit Inc, Sacco SRL, International Flavors & Fragrances Inc, Chr Hansen Holding A/S, AFFCO, Koninklijke DSM NV, Intermak Inc.
3. What are the main segments of the Rennet Market?
The market segments include Type, Form.
4. Can you provide details about the market size?
The market size is estimated to be USD 758.72 Million as of 2022.
5. What are some drivers contributing to market growth?
Rising Health Consciousness among consumer.
6. What are the notable trends driving market growth?
Growing Cheese Market Boosting Demand for Rennet.
7. Are there any restraints impacting market growth?
High Cost of natural Ingredients.
8. Can you provide examples of recent developments in the market?
August 2020: AFFCO's Renco invested multi-millions of dollars in increasing their rennet production capacity. The company has partnered with The Cheese Connection, a distributor that supplies Renco's rennet to the United States. The expansion had doubled the company's production capacity of rennet, which in turn strengthened its relationship with The Cheese Connection.
9. What pricing options are available for accessing the report?
Pricing options include single-user, multi-user, and enterprise licenses priced at USD 4750, USD 5250, and USD 8750 respectively.
10. Is the market size provided in terms of value or volume?
The market size is provided in terms of value, measured in Million.
11. Are there any specific market keywords associated with the report?
Yes, the market keyword associated with the report is "Rennet Market," which aids in identifying and referencing the specific market segment covered.
12. How do I determine which pricing option suits my needs best?
The pricing options vary based on user requirements and access needs. Individual users may opt for single-user licenses, while businesses requiring broader access may choose multi-user or enterprise licenses for cost-effective access to the report.
13. Are there any additional resources or data provided in the Rennet Market report?
While the report offers comprehensive insights, it's advisable to review the specific contents or supplementary materials provided to ascertain if additional resources or data are available.
14. How can I stay updated on further developments or reports in the Rennet Market?
To stay informed about further developments, trends, and reports in the Rennet Market, consider subscribing to industry newsletters, following relevant companies and organizations, or regularly checking reputable industry news sources and publications.
Methodology
Step 1 - Identification of Relevant Samples Size from Population Database


Step 2 - Approaches for Defining Global Market Size (Value, Volume* & Price*)

Note*: In applicable scenarios
Step 3 - Data Sources
Primary Research
- Web Analytics
- Survey Reports
- Research Institute
- Latest Research Reports
- Opinion Leaders
Secondary Research
- Annual Reports
- White Paper
- Latest Press Release
- Industry Association
- Paid Database
- Investor Presentations

Step 4 - Data Triangulation
Involves using different sources of information in order to increase the validity of a study
These sources are likely to be stakeholders in a program - participants, other researchers, program staff, other community members, and so on.
Then we put all data in single framework & apply various statistical tools to find out the dynamic on the market.
During the analysis stage, feedback from the stakeholder groups would be compared to determine areas of agreement as well as areas of divergence


