

Key Insights
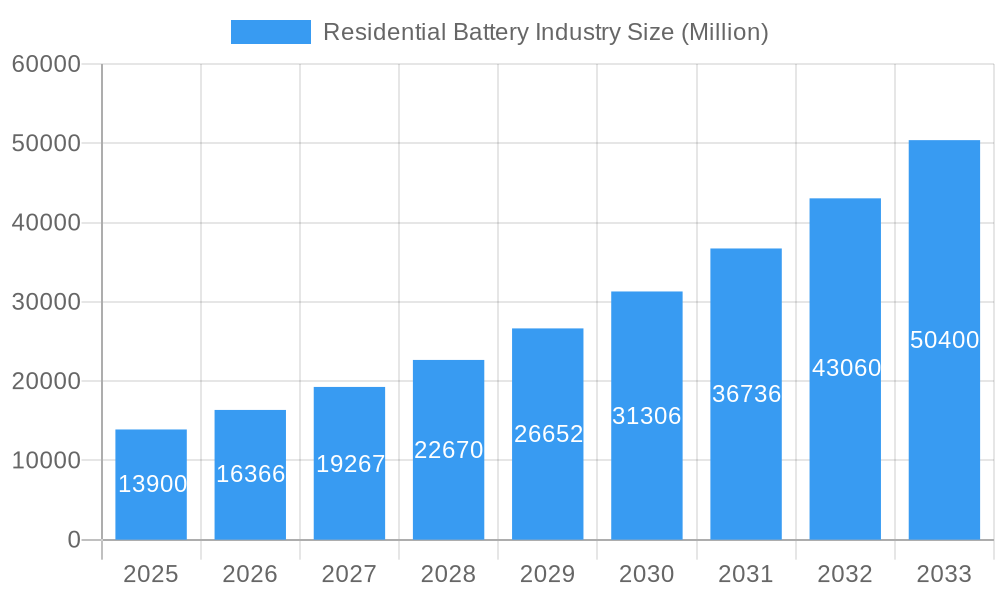
The residential battery storage market, currently valued at $17.4 billion (2025), is experiencing robust growth, projected to expand at a Compound Annual Growth Rate (CAGR) of 10.9% from 2025 to 2033. This surge is driven by increasing electricity prices, concerns about grid reliability, and the rising adoption of renewable energy sources. Consumers are seeking energy independence and cost savings, positioning residential battery storage as a compelling investment. Lithium-ion batteries dominate due to their high energy density and lifespan, though lead-acid batteries retain a share in lower-cost applications. Technological advancements in battery chemistries and power electronics further fuel market expansion. Geographically, North America, Europe, and Asia-Pacific lead adoption, supported by favorable government policies, renewable energy integration, and consumer awareness. However, high initial investment costs and limited lifespan compared to other solutions remain significant restraints.
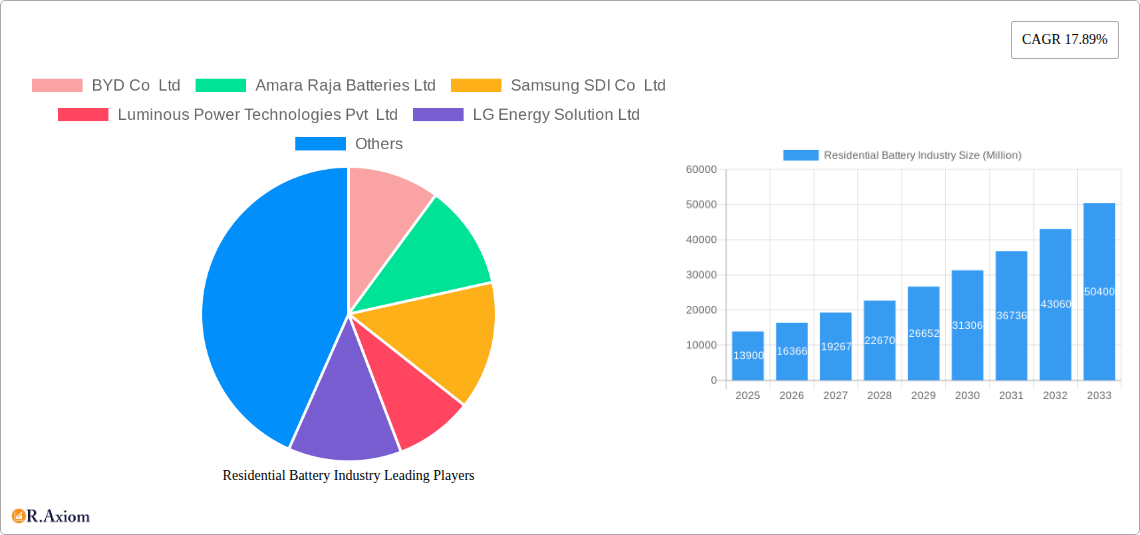
Residential Battery Industry Market Size (In Billion)
The competitive landscape features established players like BYD, Samsung SDI, and LG Energy Solution, alongside specialized providers such as Luminous Power Technologies and Tesla. These companies focus on innovation, improving battery performance, reducing costs, and enhancing integration with smart home technologies. The coming decade anticipates intensified competition due to new entrants and technological disruptions. Sustained growth depends on addressing challenges like standardized safety protocols, improving battery recycling infrastructure, and further cost reductions for broader consumer accessibility. Ongoing advancements and supportive government incentives will continue to drive market expansion, particularly in regions with favorable regulatory environments and high renewable energy penetration.
Residential Battery Industry Company Market Share
This report offers an in-depth analysis of the global residential battery industry, providing valuable insights for stakeholders. The study covers the period 2019-2033, with a focus on the forecast period 2025-2033 and a base year of 2025. Leveraging rigorous data analysis and industry expertise, it delivers actionable intelligence for strategic decision-making. Key market players analyzed include BYD Co Ltd, Amara Raja Batteries Ltd, Samsung SDI Co Ltd, Luminous Power Technologies Pvt Ltd, LG Energy Solution Ltd, FIMER SpA, Siemens AG, Tesla Inc, Delta Electronics Ltd, NEC Corporation, Energizer Holding Inc, Duracell Inc, and Panasonic Corporation. The market is segmented by battery type: Lithium-ion Battery, Lead-acid Battery, and Others.
Residential Battery Industry Market Concentration & Innovation
This section analyzes the competitive landscape, innovation drivers, and regulatory influences shaping the residential battery market. Market concentration is assessed through market share analysis of key players, revealing the dominance of specific companies. The report examines the role of technological advancements, such as improved energy density and lifespan, in driving market growth. Regulatory frameworks impacting adoption, including incentives and safety standards, are detailed. Substitution effects from alternative energy storage solutions are also evaluated. Finally, the report explores evolving end-user preferences and the impact of mergers and acquisitions (M&A) activities, including deal values and their influence on market dynamics. For example, the market share of Lithium-ion batteries is estimated at xx% in 2025, with BYD Co Ltd holding an estimated xx% market share. Significant M&A activity in the period 2019-2024 resulted in an estimated $xx Million in deal value.
Residential Battery Industry Industry Trends & Insights
This section delves into the key trends shaping the residential battery market, including market growth drivers, technological disruptions, evolving consumer preferences, and competitive dynamics. The compound annual growth rate (CAGR) for the forecast period (2025-2033) is projected at xx%, driven by factors such as increasing electricity prices, rising demand for renewable energy integration, and government incentives. Technological advancements, such as improved battery chemistries and enhanced energy management systems, are analyzed for their impact on market penetration. Consumer preferences towards sustainable and reliable energy solutions are explored, along with their influence on market segmentation. Competitive dynamics, including pricing strategies, product differentiation, and brand loyalty, are examined to understand market positioning. The market penetration of Lithium-ion batteries is projected to reach xx% by 2033.
Dominant Markets & Segments in Residential Battery Industry
This section identifies the leading geographical regions and market segments within the residential battery industry. The analysis focuses on the dominance of specific regions and countries, highlighting key drivers such as economic policies, infrastructure development, and government support for renewable energy initiatives. The report provides a detailed analysis of the leading segment (e.g., Lithium-ion Battery) and its key characteristics.
- Lithium-ion Battery Segment Dominance: Driven by higher energy density, longer lifespan, and improved safety features compared to lead-acid batteries.
- Lead-acid Battery Segment: Retains market share due to lower initial cost, although facing challenges from lithium-ion technology advancements.
- Others Types Segment: This segment includes niche technologies such as flow batteries, which are analyzed for their potential market share and growth prospects.
Dominance Analysis: The report details the factors contributing to the dominance of specific regions (e.g., North America) and segments (e.g., Lithium-ion batteries). This includes an analysis of consumer behavior, governmental policies, technological advancements, and market infrastructure.
Residential Battery Industry Product Developments
This section summarizes recent product innovations, their applications, and competitive advantages. Emphasis is placed on technological trends, such as advancements in battery chemistry, improved energy storage capacity, and enhanced safety features. The analysis assesses the market fit of these innovations and their potential impact on market competition. For instance, the introduction of solid-state batteries promises higher energy density and safety, presenting a significant opportunity for market disruption.
Report Scope & Segmentation Analysis
The report comprehensively segments the residential battery market by battery type: Lithium-ion Battery, Lead-acid Battery, and Others. Each segment is analyzed for its growth projections, market size (in Millions), and competitive dynamics. The Lithium-ion battery segment is expected to experience significant growth due to its superior performance characteristics. The Lead-acid battery segment, while mature, still holds a notable market share due to its cost-effectiveness. The "Others" segment encompasses emerging technologies with potential for future growth.
Key Drivers of Residential Battery Industry Growth
The growth of the residential battery industry is driven by several key factors. Technological advancements, such as improved battery chemistries and energy management systems, are significantly boosting market growth. Government incentives and policies promoting renewable energy integration, including tax credits and subsidies, are creating a favorable environment for market expansion. Increasing electricity prices and concerns about energy security are driving consumer demand for reliable and affordable energy storage solutions.
Challenges in the Residential Battery Industry Sector
The residential battery industry faces challenges such as stringent regulatory hurdles related to safety and environmental standards, potentially impacting market entry and expansion. Supply chain disruptions can lead to price volatility and production delays. Intense competition among established players and emerging entrants can also affect profitability and market share. These challenges, quantified wherever possible, are carefully examined in the report.
Emerging Opportunities in Residential Battery Industry
Emerging opportunities exist in developing markets with growing demand for electricity access and renewable energy adoption. Advances in battery technology, such as solid-state batteries, offer improved performance and safety features, creating new market segments. Innovative business models, such as battery-as-a-service, are expanding market accessibility.
Leading Players in the Residential Battery Industry Market
Key Developments in Residential Battery Industry Industry
- 2022-Q4: Tesla announced a significant increase in its residential battery production capacity.
- 2023-Q1: BYD Co Ltd launched a new line of residential battery systems with enhanced energy storage capabilities.
- 2024-Q2: Samsung SDI Co Ltd partnered with a major solar panel manufacturer to integrate their residential battery systems into home energy solutions. (Further developments will be detailed in the full report).
Strategic Outlook for Residential Battery Industry Market
The residential battery market is poised for continued growth, driven by increasing demand for renewable energy solutions, technological advancements, and supportive government policies. The market offers significant opportunities for innovation and expansion, particularly in emerging markets and with the adoption of new battery technologies. The long-term outlook remains positive, with significant potential for market expansion and increased adoption of residential battery storage.
Residential Battery Industry Segmentation
-
1. Type
- 1.1. Lithium-ion Battery
- 1.2. Lead-acid Battery
- 1.3. Others Types
Residential Battery Industry Segmentation By Geography
- 1. North America
- 2. Asia Pacific
- 3. Europe
- 4. South America
- 5. Middle East and Africa
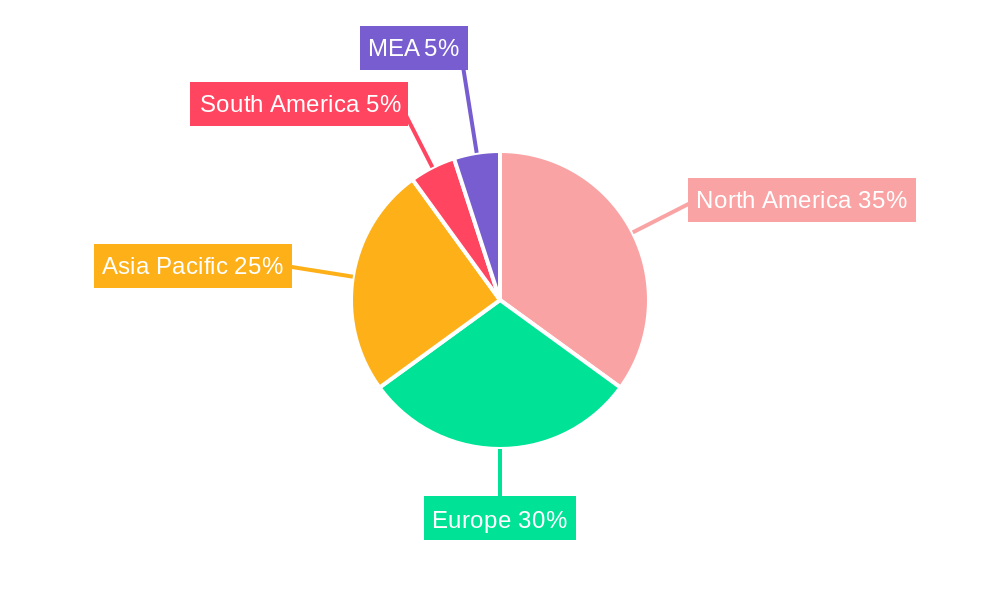
Residential Battery Industry Regional Market Share
Geographic Coverage of Residential Battery Industry
Residential Battery Industry REPORT HIGHLIGHTS
| Aspects | Details |
|---|---|
| Study Period | 2020-2034 |
| Base Year | 2025 |
| Estimated Year | 2026 |
| Forecast Period | 2026-2034 |
| Historical Period | 2020-2025 |
| Growth Rate | CAGR of 10.9% from 2020-2034 |
| Segmentation |
|
Table of Contents
- 1. Introduction
- 1.1. Research Scope
- 1.2. Market Segmentation
- 1.3. Research Objective
- 1.4. Definitions and Assumptions
- 2. Executive Summary
- 2.1. Market Snapshot
- 3. Market Dynamics
- 3.1. Market Drivers
- 3.2. Market Restrains
- 3.3. Market Trends
- 3.4. Market Opportunities
- 4. Market Factor Analysis
- 4.1. Porters Five Forces
- 4.1.1. Bargaining Power of Suppliers
- 4.1.2. Bargaining Power of Buyers
- 4.1.3. Threat of New Entrants
- 4.1.4. Threat of Substitutes
- 4.1.5. Competitive Rivalry
- 4.2. PESTEL analysis
- 4.3. BCG Analysis
- 4.3.1. Stars (High Growth, High Market Share)
- 4.3.2. Cash Cows (Low Growth, High Market Share)
- 4.3.3. Question Mark (High Growth, Low Market Share)
- 4.3.4. Dogs (Low Growth, Low Market Share)
- 4.4. Ansoff Matrix Analysis
- 4.5. Supply Chain Analysis
- 4.6. Regulatory Landscape
- 4.7. Current Market Potential and Opportunity Assessment (TAM–SAM–SOM Framework)
- 4.8. RAX Analyst Note
- 4.1. Porters Five Forces
- 5. Market Analysis, Insights and Forecast 2021-2033
- 5.1. Market Analysis, Insights and Forecast - by Type
- 5.1.1. Lithium-ion Battery
- 5.1.2. Lead-acid Battery
- 5.1.3. Others Types
- 5.2. Market Analysis, Insights and Forecast - by Region
- 5.2.1. North America
- 5.2.2. Asia Pacific
- 5.2.3. Europe
- 5.2.4. South America
- 5.2.5. Middle East and Africa
- 5.1. Market Analysis, Insights and Forecast - by Type
- 6. Global Residential Battery Industry Analysis, Insights and Forecast, 2021-2033
- 6.1. Market Analysis, Insights and Forecast - by Type
- 6.1.1. Lithium-ion Battery
- 6.1.2. Lead-acid Battery
- 6.1.3. Others Types
- 6.1. Market Analysis, Insights and Forecast - by Type
- 7. North America Residential Battery Industry Analysis, Insights and Forecast, 2020-2032
- 7.1. Market Analysis, Insights and Forecast - by Type
- 7.1.1. Lithium-ion Battery
- 7.1.2. Lead-acid Battery
- 7.1.3. Others Types
- 7.1. Market Analysis, Insights and Forecast - by Type
- 8. Asia Pacific Residential Battery Industry Analysis, Insights and Forecast, 2020-2032
- 8.1. Market Analysis, Insights and Forecast - by Type
- 8.1.1. Lithium-ion Battery
- 8.1.2. Lead-acid Battery
- 8.1.3. Others Types
- 8.1. Market Analysis, Insights and Forecast - by Type
- 9. Europe Residential Battery Industry Analysis, Insights and Forecast, 2020-2032
- 9.1. Market Analysis, Insights and Forecast - by Type
- 9.1.1. Lithium-ion Battery
- 9.1.2. Lead-acid Battery
- 9.1.3. Others Types
- 9.1. Market Analysis, Insights and Forecast - by Type
- 10. South America Residential Battery Industry Analysis, Insights and Forecast, 2020-2032
- 10.1. Market Analysis, Insights and Forecast - by Type
- 10.1.1. Lithium-ion Battery
- 10.1.2. Lead-acid Battery
- 10.1.3. Others Types
- 10.1. Market Analysis, Insights and Forecast - by Type
- 11. Middle East and Africa Residential Battery Industry Analysis, Insights and Forecast, 2020-2032
- 11.1. Market Analysis, Insights and Forecast - by Type
- 11.1.1. Lithium-ion Battery
- 11.1.2. Lead-acid Battery
- 11.1.3. Others Types
- 11.1. Market Analysis, Insights and Forecast - by Type
- 12. Competitive Analysis
- 12.1. Company Profiles
- 12.1.1 BYD Co Ltd
- 12.1.1.1. Company Overview
- 12.1.1.2. Products
- 12.1.1.3. Company Financials
- 12.1.1.4. SWOT Analysis
- 12.1.2 Amara Raja Batteries Ltd
- 12.1.2.1. Company Overview
- 12.1.2.2. Products
- 12.1.2.3. Company Financials
- 12.1.2.4. SWOT Analysis
- 12.1.3 Samsung SDI Co Ltd
- 12.1.3.1. Company Overview
- 12.1.3.2. Products
- 12.1.3.3. Company Financials
- 12.1.3.4. SWOT Analysis
- 12.1.4 Luminous Power Technologies Pvt Ltd
- 12.1.4.1. Company Overview
- 12.1.4.2. Products
- 12.1.4.3. Company Financials
- 12.1.4.4. SWOT Analysis
- 12.1.5 LG Energy Solution Ltd
- 12.1.5.1. Company Overview
- 12.1.5.2. Products
- 12.1.5.3. Company Financials
- 12.1.5.4. SWOT Analysis
- 12.1.6 FIMER SpA
- 12.1.6.1. Company Overview
- 12.1.6.2. Products
- 12.1.6.3. Company Financials
- 12.1.6.4. SWOT Analysis
- 12.1.7 Siemens AG
- 12.1.7.1. Company Overview
- 12.1.7.2. Products
- 12.1.7.3. Company Financials
- 12.1.7.4. SWOT Analysis
- 12.1.8 Tesla Inc
- 12.1.8.1. Company Overview
- 12.1.8.2. Products
- 12.1.8.3. Company Financials
- 12.1.8.4. SWOT Analysis
- 12.1.9 Delta Electronics Ltd
- 12.1.9.1. Company Overview
- 12.1.9.2. Products
- 12.1.9.3. Company Financials
- 12.1.9.4. SWOT Analysis
- 12.1.10 NEC Corporation
- 12.1.10.1. Company Overview
- 12.1.10.2. Products
- 12.1.10.3. Company Financials
- 12.1.10.4. SWOT Analysis
- 12.1.11 Energizer Holding Inc
- 12.1.11.1. Company Overview
- 12.1.11.2. Products
- 12.1.11.3. Company Financials
- 12.1.11.4. SWOT Analysis
- 12.1.12 Duracell Inc
- 12.1.12.1. Company Overview
- 12.1.12.2. Products
- 12.1.12.3. Company Financials
- 12.1.12.4. SWOT Analysis
- 12.1.13 Panasonic Corporation
- 12.1.13.1. Company Overview
- 12.1.13.2. Products
- 12.1.13.3. Company Financials
- 12.1.13.4. SWOT Analysis
- 12.1.1 BYD Co Ltd
- 12.2. Market Entropy
- 12.2.1 Company's Key Areas Served
- 12.2.2 Recent Developments
- 12.3. Company Market Share Analysis 2025
- 12.3.1 Top 5 Companies Market Share Analysis
- 12.3.2 Top 3 Companies Market Share Analysis
- 12.4. List of Potential Customers
- 13. Research Methodology
List of Figures
- Figure 1: Global Residential Battery Industry Revenue Breakdown (billion, %) by Region 2025 & 2033
- Figure 2: Global Residential Battery Industry Volume Breakdown (K Tons, %) by Region 2025 & 2033
- Figure 3: North America Residential Battery Industry Revenue (billion), by Type 2025 & 2033
- Figure 4: North America Residential Battery Industry Volume (K Tons), by Type 2025 & 2033
- Figure 5: North America Residential Battery Industry Revenue Share (%), by Type 2025 & 2033
- Figure 6: North America Residential Battery Industry Volume Share (%), by Type 2025 & 2033
- Figure 7: North America Residential Battery Industry Revenue (billion), by Country 2025 & 2033
- Figure 8: North America Residential Battery Industry Volume (K Tons), by Country 2025 & 2033
- Figure 9: North America Residential Battery Industry Revenue Share (%), by Country 2025 & 2033
- Figure 10: North America Residential Battery Industry Volume Share (%), by Country 2025 & 2033
- Figure 11: Asia Pacific Residential Battery Industry Revenue (billion), by Type 2025 & 2033
- Figure 12: Asia Pacific Residential Battery Industry Volume (K Tons), by Type 2025 & 2033
- Figure 13: Asia Pacific Residential Battery Industry Revenue Share (%), by Type 2025 & 2033
- Figure 14: Asia Pacific Residential Battery Industry Volume Share (%), by Type 2025 & 2033
- Figure 15: Asia Pacific Residential Battery Industry Revenue (billion), by Country 2025 & 2033
- Figure 16: Asia Pacific Residential Battery Industry Volume (K Tons), by Country 2025 & 2033
- Figure 17: Asia Pacific Residential Battery Industry Revenue Share (%), by Country 2025 & 2033
- Figure 18: Asia Pacific Residential Battery Industry Volume Share (%), by Country 2025 & 2033
- Figure 19: Europe Residential Battery Industry Revenue (billion), by Type 2025 & 2033
- Figure 20: Europe Residential Battery Industry Volume (K Tons), by Type 2025 & 2033
- Figure 21: Europe Residential Battery Industry Revenue Share (%), by Type 2025 & 2033
- Figure 22: Europe Residential Battery Industry Volume Share (%), by Type 2025 & 2033
- Figure 23: Europe Residential Battery Industry Revenue (billion), by Country 2025 & 2033
- Figure 24: Europe Residential Battery Industry Volume (K Tons), by Country 2025 & 2033
- Figure 25: Europe Residential Battery Industry Revenue Share (%), by Country 2025 & 2033
- Figure 26: Europe Residential Battery Industry Volume Share (%), by Country 2025 & 2033
- Figure 27: South America Residential Battery Industry Revenue (billion), by Type 2025 & 2033
- Figure 28: South America Residential Battery Industry Volume (K Tons), by Type 2025 & 2033
- Figure 29: South America Residential Battery Industry Revenue Share (%), by Type 2025 & 2033
- Figure 30: South America Residential Battery Industry Volume Share (%), by Type 2025 & 2033
- Figure 31: South America Residential Battery Industry Revenue (billion), by Country 2025 & 2033
- Figure 32: South America Residential Battery Industry Volume (K Tons), by Country 2025 & 2033
- Figure 33: South America Residential Battery Industry Revenue Share (%), by Country 2025 & 2033
- Figure 34: South America Residential Battery Industry Volume Share (%), by Country 2025 & 2033
- Figure 35: Middle East and Africa Residential Battery Industry Revenue (billion), by Type 2025 & 2033
- Figure 36: Middle East and Africa Residential Battery Industry Volume (K Tons), by Type 2025 & 2033
- Figure 37: Middle East and Africa Residential Battery Industry Revenue Share (%), by Type 2025 & 2033
- Figure 38: Middle East and Africa Residential Battery Industry Volume Share (%), by Type 2025 & 2033
- Figure 39: Middle East and Africa Residential Battery Industry Revenue (billion), by Country 2025 & 2033
- Figure 40: Middle East and Africa Residential Battery Industry Volume (K Tons), by Country 2025 & 2033
- Figure 41: Middle East and Africa Residential Battery Industry Revenue Share (%), by Country 2025 & 2033
- Figure 42: Middle East and Africa Residential Battery Industry Volume Share (%), by Country 2025 & 2033
List of Tables
- Table 1: Global Residential Battery Industry Revenue billion Forecast, by Type 2020 & 2033
- Table 2: Global Residential Battery Industry Volume K Tons Forecast, by Type 2020 & 2033
- Table 3: Global Residential Battery Industry Revenue billion Forecast, by Region 2020 & 2033
- Table 4: Global Residential Battery Industry Volume K Tons Forecast, by Region 2020 & 2033
- Table 5: Global Residential Battery Industry Revenue billion Forecast, by Type 2020 & 2033
- Table 6: Global Residential Battery Industry Volume K Tons Forecast, by Type 2020 & 2033
- Table 7: Global Residential Battery Industry Revenue billion Forecast, by Country 2020 & 2033
- Table 8: Global Residential Battery Industry Volume K Tons Forecast, by Country 2020 & 2033
- Table 9: Global Residential Battery Industry Revenue billion Forecast, by Type 2020 & 2033
- Table 10: Global Residential Battery Industry Volume K Tons Forecast, by Type 2020 & 2033
- Table 11: Global Residential Battery Industry Revenue billion Forecast, by Country 2020 & 2033
- Table 12: Global Residential Battery Industry Volume K Tons Forecast, by Country 2020 & 2033
- Table 13: Global Residential Battery Industry Revenue billion Forecast, by Type 2020 & 2033
- Table 14: Global Residential Battery Industry Volume K Tons Forecast, by Type 2020 & 2033
- Table 15: Global Residential Battery Industry Revenue billion Forecast, by Country 2020 & 2033
- Table 16: Global Residential Battery Industry Volume K Tons Forecast, by Country 2020 & 2033
- Table 17: Global Residential Battery Industry Revenue billion Forecast, by Type 2020 & 2033
- Table 18: Global Residential Battery Industry Volume K Tons Forecast, by Type 2020 & 2033
- Table 19: Global Residential Battery Industry Revenue billion Forecast, by Country 2020 & 2033
- Table 20: Global Residential Battery Industry Volume K Tons Forecast, by Country 2020 & 2033
- Table 21: Global Residential Battery Industry Revenue billion Forecast, by Type 2020 & 2033
- Table 22: Global Residential Battery Industry Volume K Tons Forecast, by Type 2020 & 2033
- Table 23: Global Residential Battery Industry Revenue billion Forecast, by Country 2020 & 2033
- Table 24: Global Residential Battery Industry Volume K Tons Forecast, by Country 2020 & 2033
Frequently Asked Questions
1. What is the projected Compound Annual Growth Rate (CAGR) of the Residential Battery Industry?
The projected CAGR is approximately 10.9%.
2. Which companies are prominent players in the Residential Battery Industry?
Key companies in the market include BYD Co Ltd, Amara Raja Batteries Ltd, Samsung SDI Co Ltd, Luminous Power Technologies Pvt Ltd, LG Energy Solution Ltd, FIMER SpA, Siemens AG, Tesla Inc, Delta Electronics Ltd, NEC Corporation, Energizer Holding Inc, Duracell Inc, Panasonic Corporation.
3. What are the main segments of the Residential Battery Industry?
The market segments include Type.
4. Can you provide details about the market size?
The market size is estimated to be USD 17.4 billion as of 2022.
5. What are some drivers contributing to market growth?
4.; Increasing Investments in Water Treatment by Developing Countries4.; Growing Demand for the Various End-Use Sectors.
6. What are the notable trends driving market growth?
Lithium-ion Battery Segment Expected to Dominate the Market.
7. Are there any restraints impacting market growth?
4.; Availability of Cheap and Alternative Pumps.
8. Can you provide examples of recent developments in the market?
N/A
9. What pricing options are available for accessing the report?
Pricing options include single-user, multi-user, and enterprise licenses priced at USD 4750, USD 5250, and USD 8750 respectively.
10. Is the market size provided in terms of value or volume?
The market size is provided in terms of value, measured in billion and volume, measured in K Tons.
11. Are there any specific market keywords associated with the report?
Yes, the market keyword associated with the report is "Residential Battery Industry," which aids in identifying and referencing the specific market segment covered.
12. How do I determine which pricing option suits my needs best?
The pricing options vary based on user requirements and access needs. Individual users may opt for single-user licenses, while businesses requiring broader access may choose multi-user or enterprise licenses for cost-effective access to the report.
13. Are there any additional resources or data provided in the Residential Battery Industry report?
While the report offers comprehensive insights, it's advisable to review the specific contents or supplementary materials provided to ascertain if additional resources or data are available.
14. How can I stay updated on further developments or reports in the Residential Battery Industry?
To stay informed about further developments, trends, and reports in the Residential Battery Industry, consider subscribing to industry newsletters, following relevant companies and organizations, or regularly checking reputable industry news sources and publications.
Methodology
Step 1 - Identification of Relevant Samples Size from Population Database


Step 2 - Approaches for Defining Global Market Size (Value, Volume* & Price*)

Note*: In applicable scenarios
Step 3 - Data Sources
Primary Research
- Web Analytics
- Survey Reports
- Research Institute
- Latest Research Reports
- Opinion Leaders
Secondary Research
- Annual Reports
- White Paper
- Latest Press Release
- Industry Association
- Paid Database
- Investor Presentations

Step 4 - Data Triangulation
Involves using different sources of information in order to increase the validity of a study
These sources are likely to be stakeholders in a program - participants, other researchers, program staff, other community members, and so on.
Then we put all data in single framework & apply various statistical tools to find out the dynamic on the market.
During the analysis stage, feedback from the stakeholder groups would be compared to determine areas of agreement as well as areas of divergence