

Key Insights
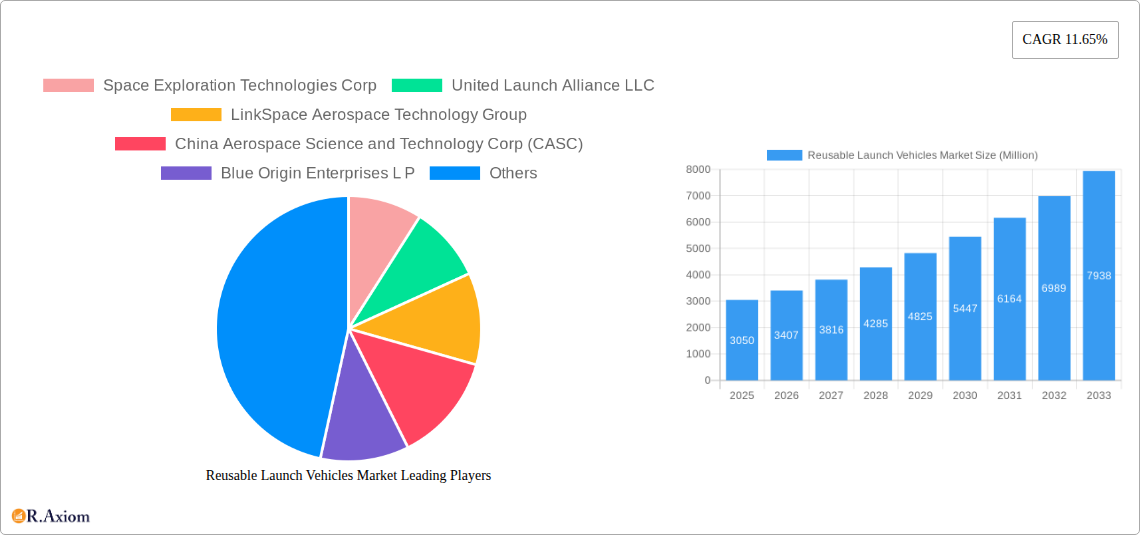
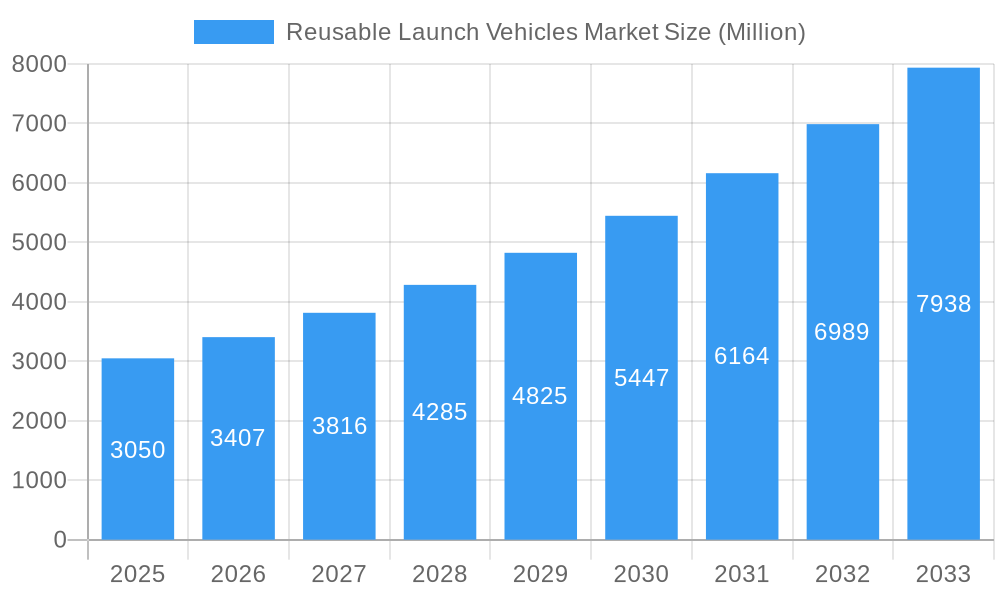
The Reusable Launch Vehicles (RLV) market is experiencing robust growth, projected to reach \$3.05 billion in 2025 and maintain a Compound Annual Growth Rate (CAGR) of 11.65% from 2025 to 2033. This expansion is driven primarily by the increasing demand for cost-effective space access, fueled by burgeoning commercial space activities, satellite constellations, and space tourism. Technological advancements in reusable rocket technologies, including improved engine designs, materials science, and autonomous landing systems, are further accelerating market growth. The market is segmented by reusability (partially and fully reusable) and configuration (single-stage and multi-stage), reflecting the diverse technological approaches being pursued. Major players like SpaceX, Blue Origin, and United Launch Alliance are leading innovation, while governmental space agencies like NASA and ISRO are also significantly contributing to the RLV landscape. The competitive landscape is characterized by both established aerospace giants and emerging new space companies, driving innovation and price competition.
Reusable Launch Vehicles Market Market Size (In Billion)
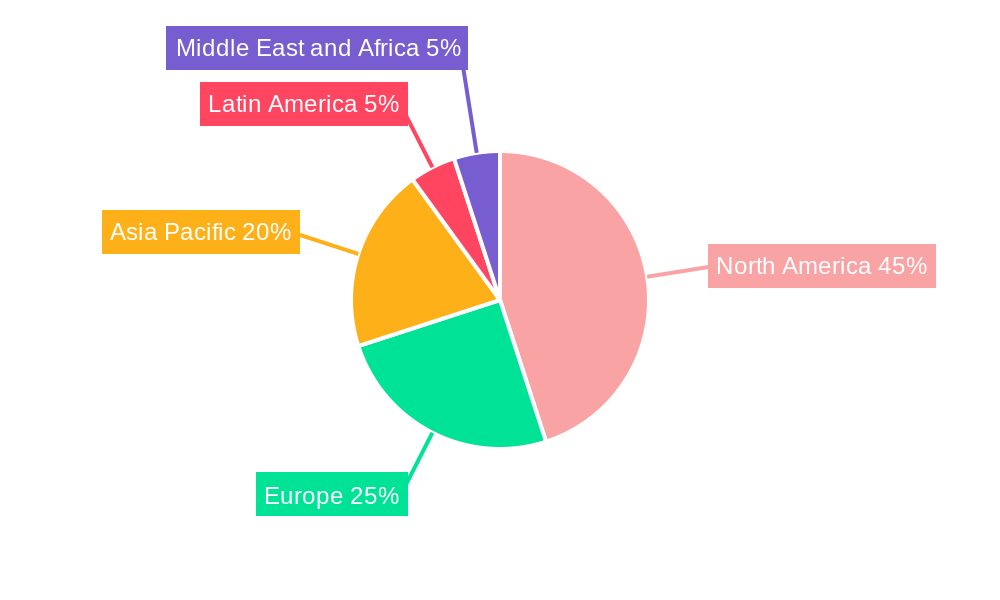
Geographic distribution reveals significant market presence across North America, Europe, and Asia-Pacific. North America, driven by significant private sector investment and government support, currently holds a substantial market share. However, Asia-Pacific is poised for rapid growth due to increasing government investment in space exploration and burgeoning domestic commercial space activities. Europe, with its established aerospace industry, maintains a significant presence, while other regions are exhibiting emerging but promising growth potential. The restraints to growth include high initial development costs, regulatory complexities, and the inherent risks associated with spaceflight, although technological advancements are steadily mitigating some of these challenges. The long-term outlook remains extremely positive, fueled by ongoing investments and the persistent drive towards more frequent and affordable space access.
Reusable Launch Vehicles Market Company Market Share
Reusable Launch Vehicles Market: A Comprehensive Analysis (2019-2033)
This comprehensive report provides a detailed analysis of the Reusable Launch Vehicles market, offering invaluable insights for industry stakeholders, investors, and strategic decision-makers. The study covers the period from 2019 to 2033, with 2025 as the base and estimated year. The report uses a robust methodology to forecast market growth from 2025 to 2033, providing crucial data on market size, segmentation, and competitive landscape. Key players analyzed include Space Exploration Technologies Corp, United Launch Alliance LLC, LinkSpace Aerospace Technology Group, China Aerospace Science and Technology Corp (CASC), Blue Origin Enterprises L P, ArianeGroup, Deutsches Zentrum für Luft- und Raumfahrt e.V. (DLR), Indian Space Research Organisation (ISRO), and National Aeronautics and Space Administration (NASA). This report is crucial for understanding the dynamics of this rapidly evolving market and making informed business decisions.
Reusable Launch Vehicles Market Concentration & Innovation
The Reusable Launch Vehicles (RLV) market exhibits a moderately concentrated landscape, dominated by a few key players. SpaceX, with its Falcon 9 and Starship programs, holds a significant market share, estimated at xx% in 2025. Other major players, including Blue Origin and United Launch Alliance, contribute to the remaining market share. However, the market is witnessing increased competition from emerging players like LinkSpace and several national space agencies.
Innovation is a pivotal driver, with advancements in reusable engine technology, materials science, and autonomous flight control systems constantly shaping the market. Stringent regulatory frameworks, particularly regarding safety and environmental impact, influence the pace of innovation. The emergence of partially reusable and fully reusable systems, along with single-stage and multi-stage configurations, presents diverse technological avenues for innovation.
M&A activity has been relatively low in recent years but is expected to increase as smaller companies seek strategic partnerships or acquisitions by larger players to accelerate development and market penetration. The total value of M&A deals in the RLV market between 2019 and 2024 was estimated at xx Million, and this figure is expected to increase significantly.
- Market Share (2025): SpaceX: xx%, Blue Origin: xx%, ULA: xx%, Others: xx%
- M&A Deal Value (2019-2024): xx Million
- Key Innovation Drivers: Reusable engine technology, advanced materials, autonomous flight control.
- Regulatory Impact: Stringent safety and environmental regulations influencing development timelines.
Reusable Launch Vehicles Market Industry Trends & Insights
The Reusable Launch Vehicles market is experiencing a period of transformative growth, fundamentally reshaped by the significant reduction in launch costs compared to conventional expendable rockets. This economic advantage is a compelling catalyst, attracting substantial investment and participation from both governmental space agencies and private commercial enterprises. The market is poised for robust expansion, with a projected Compound Annual Growth Rate (CAGR) of approximately 15-20% during the forecast period (2025-2033). Market penetration of reusable launch systems is steadily accelerating, with an anticipated penetration rate of 60-70% by 2033, signifying a paradigm shift in space access. Key drivers of this ascent include groundbreaking technological advancements, particularly in the development of more fuel-efficient and durable reusable rocket engines, alongside sophisticated automated recovery and refurbishment systems. The burgeoning demand for satellite constellation deployment, the nascent but rapidly growing space tourism sector, and the ambitious long-term goals of lunar and Martian missions are collectively amplifying the imperative for economical and sustainable launch solutions.
The competitive landscape is a dynamic arena characterized by intense rivalry. Established aerospace giants are innovating alongside agile, venture-backed startups, each striving for technological superiority and cost optimization. Consumer preferences are evolving, with a strong emphasis on higher payload capacities, minimized launch lead times, and, critically, superior cost-effectiveness per kilogram to orbit, all of which are actively shaping market trends and R&D priorities.
Dominant Markets & Segments in Reusable Launch Vehicles Market
The North American market currently holds a dominant position in the Reusable Launch Vehicles market, driven by significant investments in space exploration and the presence of major players like SpaceX and Blue Origin. However, the Asia-Pacific region is experiencing rapid growth due to rising government spending on space programs and the emergence of new space companies in countries like China and India.
- Dominant Region: North America
- Fastest Growing Region: Asia-Pacific
Segment Analysis:
- Type: The fully reusable segment is expected to exhibit faster growth than the partially reusable segment due to long-term cost advantages, although partially reusable systems currently hold a larger market share.
- Configuration: Multi-stage configurations are more prevalent currently, but single-stage-to-orbit (SSTO) systems are attracting significant research and development interest due to their potential for greater efficiency.
Key Drivers:
- North America: Strong government support, private sector investments, advanced technology.
- Asia-Pacific: Increasing government spending on space programs, emergence of new space companies.
- Europe: Established space industry infrastructure, collaborative research initiatives.
Reusable Launch Vehicles Market Product Developments
Recent product innovations in the Reusable Launch Vehicles market are primarily focused on achieving higher reusability rates, expanding payload capacities to accommodate larger and more complex missions, and enhancing overall launch system reliability and mission success rates. These advancements are largely fueled by intense competition and the diverse, evolving demands of both commercial satellite operators and government agencies. Key differentiators in this increasingly competitive marketplace include the integration of advanced composite materials for lighter and stronger structures, the design of novel and highly efficient engine architectures, and the implementation of sophisticated automated landing and recovery systems. The ultimate goal for many players is the development of truly fully reusable launch systems, which promise to revolutionize space access by drastically slashing the cost per launch, making space more accessible than ever before.
Report Scope & Segmentation Analysis
This report segments the Reusable Launch Vehicles market by type (partially reusable, fully reusable) and configuration (single-stage, multi-stage). Each segment's growth projections, market size, and competitive dynamics are comprehensively analyzed. The fully reusable segment is projected to have a higher CAGR compared to the partially reusable segment, while multi-stage configurations are expected to continue dominating the market for the near term.
Key Drivers of Reusable Launch Vehicles Market Growth
The Reusable Launch Vehicles market's growth is driven by several key factors. Cost reduction per launch is the most significant, making space access more affordable for both governments and private companies. Technological advancements in propulsion systems and materials science are paving the way for more efficient and reliable reusable rockets. Governmental support and investments in space exploration are also contributing substantially.
Challenges in the Reusable Launch Vehicles Market Sector
Despite the promising outlook, the Reusable Launch Vehicles market faces several significant hurdles. The substantial initial capital investment required for the research, development, and testing of these complex systems presents a considerable barrier to entry for many potential participants. The inherent complexity of reusable launch vehicle architectures translates into increased operational risks and necessitates ongoing, significant investments in rigorous testing, meticulous maintenance, and rapid refurbishment processes. The intense competition from both established industry leaders and innovative startups creates considerable pressure on profit margins and market share consolidation. Furthermore, navigating stringent regulatory frameworks governing space launch operations and addressing growing environmental concerns associated with space activities add further layers of complexity and demand careful consideration.
Emerging Opportunities in Reusable Launch Vehicles Market
Emerging opportunities include expanding into new markets like space tourism and on-orbit servicing. Advancements in hypersonic technologies and reusable spacecraft design open doors to new applications. Growing demand for small satellite constellations presents a significant market for smaller, more frequent launches.
Leading Players in the Reusable Launch Vehicles Market
- Space Exploration Technologies Corp
- United Launch Alliance LLC
- LinkSpace Aerospace Technology Group
- China Aerospace Science and Technology Corp (CASC)
- Blue Origin Enterprises L P
- ArianeGroup
- Deutsches Zentrum für Luft- und Raumfahrt e.V. (DLR)
- Indian Space Research Organisation (ISRO)
- National Aeronautics and Space Administration (NASA)
Key Developments in Reusable Launch Vehicles Market Industry
- 2023: SpaceX successfully launched and landed its Starship prototype, marking a significant milestone in fully reusable launch systems.
- 2022: Blue Origin completed several successful suborbital flights of its New Shepard vehicle.
- 2021: United Launch Alliance announced plans to develop a reusable launch system.
Strategic Outlook for Reusable Launch Vehicles Market
The future trajectory of the Reusable Launch Vehicles market appears exceptionally bright, driven by a confluence of factors including continuous technological breakthroughs, the sustained reduction in launch expenses, and the rapid expansion of diverse space-based applications. The market is destined to remain a highly competitive environment, fostering ongoing innovation and driving further cost efficiencies as established players and emerging companies vie for dominance. The successful development and widespread adoption of fully reusable launch systems will be pivotal in unlocking the next era of space exploration, commercialization, and utilization, fundamentally transforming access to space into a more sustainable, economical, and routine endeavor.
Reusable Launch Vehicles Market Segmentation
-
1. Type
- 1.1. Partially Reusable
- 1.2. Fully Reusable
-
2. Configuration
- 2.1. Single-Stage
- 2.2. Multi-Stage
Reusable Launch Vehicles Market Segmentation By Geography
-
1. North America
- 1.1. North America
- 1.2. Canada
-
2. Europe
- 2.1. United Kingdom
- 2.2. Germany
- 2.3. France
- 2.4. Italy
- 2.5. Russia
- 2.6. Rest of Europe
-
3. Asia Pacific
- 3.1. China
- 3.2. India
- 3.3. Japan
- 3.4. South Korea
- 3.5. Rest of Asia Pacific
-
4. Latin America
- 4.1. Brazil
- 4.2. Mexico
- 4.3. Rest of Latin America
-
5. Middle East and Africa
- 5.1. Saudi Arabia
- 5.2. United Arab Emirates
- 5.3. Israel
- 5.4. South Africa
- 5.5. Rest of Middle East and Africa
Reusable Launch Vehicles Market Regional Market Share
Geographic Coverage of Reusable Launch Vehicles Market
Reusable Launch Vehicles Market REPORT HIGHLIGHTS
| Aspects | Details |
|---|---|
| Study Period | 2020-2034 |
| Base Year | 2025 |
| Estimated Year | 2026 |
| Forecast Period | 2026-2034 |
| Historical Period | 2020-2025 |
| Growth Rate | CAGR of 11.65% from 2020-2034 |
| Segmentation |
|
Table of Contents
- 1. Introduction
- 1.1. Research Scope
- 1.2. Market Segmentation
- 1.3. Research Objective
- 1.4. Definitions and Assumptions
- 2. Executive Summary
- 2.1. Market Snapshot
- 3. Market Dynamics
- 3.1. Market Drivers
- 3.2. Market Restrains
- 3.3. Market Trends
- 3.4. Market Opportunities
- 4. Market Factor Analysis
- 4.1. Porters Five Forces
- 4.1.1. Bargaining Power of Suppliers
- 4.1.2. Bargaining Power of Buyers
- 4.1.3. Threat of New Entrants
- 4.1.4. Threat of Substitutes
- 4.1.5. Competitive Rivalry
- 4.2. PESTEL analysis
- 4.3. BCG Analysis
- 4.3.1. Stars (High Growth, High Market Share)
- 4.3.2. Cash Cows (Low Growth, High Market Share)
- 4.3.3. Question Mark (High Growth, Low Market Share)
- 4.3.4. Dogs (Low Growth, Low Market Share)
- 4.4. Ansoff Matrix Analysis
- 4.5. Supply Chain Analysis
- 4.6. Regulatory Landscape
- 4.7. Current Market Potential and Opportunity Assessment (TAM–SAM–SOM Framework)
- 4.8. RAX Analyst Note
- 4.1. Porters Five Forces
- 5. Market Analysis, Insights and Forecast 2021-2033
- 5.1. Market Analysis, Insights and Forecast - by Type
- 5.1.1. Partially Reusable
- 5.1.2. Fully Reusable
- 5.2. Market Analysis, Insights and Forecast - by Configuration
- 5.2.1. Single-Stage
- 5.2.2. Multi-Stage
- 5.3. Market Analysis, Insights and Forecast - by Region
- 5.3.1. North America
- 5.3.2. Europe
- 5.3.3. Asia Pacific
- 5.3.4. Latin America
- 5.3.5. Middle East and Africa
- 5.1. Market Analysis, Insights and Forecast - by Type
- 6. Global Reusable Launch Vehicles Market Analysis, Insights and Forecast, 2021-2033
- 6.1. Market Analysis, Insights and Forecast - by Type
- 6.1.1. Partially Reusable
- 6.1.2. Fully Reusable
- 6.2. Market Analysis, Insights and Forecast - by Configuration
- 6.2.1. Single-Stage
- 6.2.2. Multi-Stage
- 6.1. Market Analysis, Insights and Forecast - by Type
- 7. North America Reusable Launch Vehicles Market Analysis, Insights and Forecast, 2020-2032
- 7.1. Market Analysis, Insights and Forecast - by Type
- 7.1.1. Partially Reusable
- 7.1.2. Fully Reusable
- 7.2. Market Analysis, Insights and Forecast - by Configuration
- 7.2.1. Single-Stage
- 7.2.2. Multi-Stage
- 7.1. Market Analysis, Insights and Forecast - by Type
- 8. Europe Reusable Launch Vehicles Market Analysis, Insights and Forecast, 2020-2032
- 8.1. Market Analysis, Insights and Forecast - by Type
- 8.1.1. Partially Reusable
- 8.1.2. Fully Reusable
- 8.2. Market Analysis, Insights and Forecast - by Configuration
- 8.2.1. Single-Stage
- 8.2.2. Multi-Stage
- 8.1. Market Analysis, Insights and Forecast - by Type
- 9. Asia Pacific Reusable Launch Vehicles Market Analysis, Insights and Forecast, 2020-2032
- 9.1. Market Analysis, Insights and Forecast - by Type
- 9.1.1. Partially Reusable
- 9.1.2. Fully Reusable
- 9.2. Market Analysis, Insights and Forecast - by Configuration
- 9.2.1. Single-Stage
- 9.2.2. Multi-Stage
- 9.1. Market Analysis, Insights and Forecast - by Type
- 10. Latin America Reusable Launch Vehicles Market Analysis, Insights and Forecast, 2020-2032
- 10.1. Market Analysis, Insights and Forecast - by Type
- 10.1.1. Partially Reusable
- 10.1.2. Fully Reusable
- 10.2. Market Analysis, Insights and Forecast - by Configuration
- 10.2.1. Single-Stage
- 10.2.2. Multi-Stage
- 10.1. Market Analysis, Insights and Forecast - by Type
- 11. Middle East and Africa Reusable Launch Vehicles Market Analysis, Insights and Forecast, 2020-2032
- 11.1. Market Analysis, Insights and Forecast - by Type
- 11.1.1. Partially Reusable
- 11.1.2. Fully Reusable
- 11.2. Market Analysis, Insights and Forecast - by Configuration
- 11.2.1. Single-Stage
- 11.2.2. Multi-Stage
- 11.1. Market Analysis, Insights and Forecast - by Type
- 12. Competitive Analysis
- 12.1. Company Profiles
- 12.1.1 Space Exploration Technologies Corp
- 12.1.1.1. Company Overview
- 12.1.1.2. Products
- 12.1.1.3. Company Financials
- 12.1.1.4. SWOT Analysis
- 12.1.2 United Launch Alliance LLC
- 12.1.2.1. Company Overview
- 12.1.2.2. Products
- 12.1.2.3. Company Financials
- 12.1.2.4. SWOT Analysis
- 12.1.3 LinkSpace Aerospace Technology Group
- 12.1.3.1. Company Overview
- 12.1.3.2. Products
- 12.1.3.3. Company Financials
- 12.1.3.4. SWOT Analysis
- 12.1.4 China Aerospace Science and Technology Corp (CASC)
- 12.1.4.1. Company Overview
- 12.1.4.2. Products
- 12.1.4.3. Company Financials
- 12.1.4.4. SWOT Analysis
- 12.1.5 Blue Origin Enterprises L P
- 12.1.5.1. Company Overview
- 12.1.5.2. Products
- 12.1.5.3. Company Financials
- 12.1.5.4. SWOT Analysis
- 12.1.6 ArianeGroup
- 12.1.6.1. Company Overview
- 12.1.6.2. Products
- 12.1.6.3. Company Financials
- 12.1.6.4. SWOT Analysis
- 12.1.7 Deutsches Zentrum für Luft- und Raumfahrt e V (DLR
- 12.1.7.1. Company Overview
- 12.1.7.2. Products
- 12.1.7.3. Company Financials
- 12.1.7.4. SWOT Analysis
- 12.1.8 Indian Space Research Organisation (ISRO)
- 12.1.8.1. Company Overview
- 12.1.8.2. Products
- 12.1.8.3. Company Financials
- 12.1.8.4. SWOT Analysis
- 12.1.9 National Aeronautics and Space Administration (NASA)
- 12.1.9.1. Company Overview
- 12.1.9.2. Products
- 12.1.9.3. Company Financials
- 12.1.9.4. SWOT Analysis
- 12.1.1 Space Exploration Technologies Corp
- 12.2. Market Entropy
- 12.2.1 Company's Key Areas Served
- 12.2.2 Recent Developments
- 12.3. Company Market Share Analysis 2025
- 12.3.1 Top 5 Companies Market Share Analysis
- 12.3.2 Top 3 Companies Market Share Analysis
- 12.4. List of Potential Customers
- 13. Research Methodology
List of Figures
- Figure 1: Global Reusable Launch Vehicles Market Revenue Breakdown (Million, %) by Region 2025 & 2033
- Figure 2: North America Reusable Launch Vehicles Market Revenue (Million), by Type 2025 & 2033
- Figure 3: North America Reusable Launch Vehicles Market Revenue Share (%), by Type 2025 & 2033
- Figure 4: North America Reusable Launch Vehicles Market Revenue (Million), by Configuration 2025 & 2033
- Figure 5: North America Reusable Launch Vehicles Market Revenue Share (%), by Configuration 2025 & 2033
- Figure 6: North America Reusable Launch Vehicles Market Revenue (Million), by Country 2025 & 2033
- Figure 7: North America Reusable Launch Vehicles Market Revenue Share (%), by Country 2025 & 2033
- Figure 8: Europe Reusable Launch Vehicles Market Revenue (Million), by Type 2025 & 2033
- Figure 9: Europe Reusable Launch Vehicles Market Revenue Share (%), by Type 2025 & 2033
- Figure 10: Europe Reusable Launch Vehicles Market Revenue (Million), by Configuration 2025 & 2033
- Figure 11: Europe Reusable Launch Vehicles Market Revenue Share (%), by Configuration 2025 & 2033
- Figure 12: Europe Reusable Launch Vehicles Market Revenue (Million), by Country 2025 & 2033
- Figure 13: Europe Reusable Launch Vehicles Market Revenue Share (%), by Country 2025 & 2033
- Figure 14: Asia Pacific Reusable Launch Vehicles Market Revenue (Million), by Type 2025 & 2033
- Figure 15: Asia Pacific Reusable Launch Vehicles Market Revenue Share (%), by Type 2025 & 2033
- Figure 16: Asia Pacific Reusable Launch Vehicles Market Revenue (Million), by Configuration 2025 & 2033
- Figure 17: Asia Pacific Reusable Launch Vehicles Market Revenue Share (%), by Configuration 2025 & 2033
- Figure 18: Asia Pacific Reusable Launch Vehicles Market Revenue (Million), by Country 2025 & 2033
- Figure 19: Asia Pacific Reusable Launch Vehicles Market Revenue Share (%), by Country 2025 & 2033
- Figure 20: Latin America Reusable Launch Vehicles Market Revenue (Million), by Type 2025 & 2033
- Figure 21: Latin America Reusable Launch Vehicles Market Revenue Share (%), by Type 2025 & 2033
- Figure 22: Latin America Reusable Launch Vehicles Market Revenue (Million), by Configuration 2025 & 2033
- Figure 23: Latin America Reusable Launch Vehicles Market Revenue Share (%), by Configuration 2025 & 2033
- Figure 24: Latin America Reusable Launch Vehicles Market Revenue (Million), by Country 2025 & 2033
- Figure 25: Latin America Reusable Launch Vehicles Market Revenue Share (%), by Country 2025 & 2033
- Figure 26: Middle East and Africa Reusable Launch Vehicles Market Revenue (Million), by Type 2025 & 2033
- Figure 27: Middle East and Africa Reusable Launch Vehicles Market Revenue Share (%), by Type 2025 & 2033
- Figure 28: Middle East and Africa Reusable Launch Vehicles Market Revenue (Million), by Configuration 2025 & 2033
- Figure 29: Middle East and Africa Reusable Launch Vehicles Market Revenue Share (%), by Configuration 2025 & 2033
- Figure 30: Middle East and Africa Reusable Launch Vehicles Market Revenue (Million), by Country 2025 & 2033
- Figure 31: Middle East and Africa Reusable Launch Vehicles Market Revenue Share (%), by Country 2025 & 2033
List of Tables
- Table 1: Global Reusable Launch Vehicles Market Revenue Million Forecast, by Type 2020 & 2033
- Table 2: Global Reusable Launch Vehicles Market Revenue Million Forecast, by Configuration 2020 & 2033
- Table 3: Global Reusable Launch Vehicles Market Revenue Million Forecast, by Region 2020 & 2033
- Table 4: Global Reusable Launch Vehicles Market Revenue Million Forecast, by Type 2020 & 2033
- Table 5: Global Reusable Launch Vehicles Market Revenue Million Forecast, by Configuration 2020 & 2033
- Table 6: Global Reusable Launch Vehicles Market Revenue Million Forecast, by Country 2020 & 2033
- Table 7: North America Reusable Launch Vehicles Market Revenue (Million) Forecast, by Application 2020 & 2033
- Table 8: Canada Reusable Launch Vehicles Market Revenue (Million) Forecast, by Application 2020 & 2033
- Table 9: Global Reusable Launch Vehicles Market Revenue Million Forecast, by Type 2020 & 2033
- Table 10: Global Reusable Launch Vehicles Market Revenue Million Forecast, by Configuration 2020 & 2033
- Table 11: Global Reusable Launch Vehicles Market Revenue Million Forecast, by Country 2020 & 2033
- Table 12: United Kingdom Reusable Launch Vehicles Market Revenue (Million) Forecast, by Application 2020 & 2033
- Table 13: Germany Reusable Launch Vehicles Market Revenue (Million) Forecast, by Application 2020 & 2033
- Table 14: France Reusable Launch Vehicles Market Revenue (Million) Forecast, by Application 2020 & 2033
- Table 15: Italy Reusable Launch Vehicles Market Revenue (Million) Forecast, by Application 2020 & 2033
- Table 16: Russia Reusable Launch Vehicles Market Revenue (Million) Forecast, by Application 2020 & 2033
- Table 17: Rest of Europe Reusable Launch Vehicles Market Revenue (Million) Forecast, by Application 2020 & 2033
- Table 18: Global Reusable Launch Vehicles Market Revenue Million Forecast, by Type 2020 & 2033
- Table 19: Global Reusable Launch Vehicles Market Revenue Million Forecast, by Configuration 2020 & 2033
- Table 20: Global Reusable Launch Vehicles Market Revenue Million Forecast, by Country 2020 & 2033
- Table 21: China Reusable Launch Vehicles Market Revenue (Million) Forecast, by Application 2020 & 2033
- Table 22: India Reusable Launch Vehicles Market Revenue (Million) Forecast, by Application 2020 & 2033
- Table 23: Japan Reusable Launch Vehicles Market Revenue (Million) Forecast, by Application 2020 & 2033
- Table 24: South Korea Reusable Launch Vehicles Market Revenue (Million) Forecast, by Application 2020 & 2033
- Table 25: Rest of Asia Pacific Reusable Launch Vehicles Market Revenue (Million) Forecast, by Application 2020 & 2033
- Table 26: Global Reusable Launch Vehicles Market Revenue Million Forecast, by Type 2020 & 2033
- Table 27: Global Reusable Launch Vehicles Market Revenue Million Forecast, by Configuration 2020 & 2033
- Table 28: Global Reusable Launch Vehicles Market Revenue Million Forecast, by Country 2020 & 2033
- Table 29: Brazil Reusable Launch Vehicles Market Revenue (Million) Forecast, by Application 2020 & 2033
- Table 30: Mexico Reusable Launch Vehicles Market Revenue (Million) Forecast, by Application 2020 & 2033
- Table 31: Rest of Latin America Reusable Launch Vehicles Market Revenue (Million) Forecast, by Application 2020 & 2033
- Table 32: Global Reusable Launch Vehicles Market Revenue Million Forecast, by Type 2020 & 2033
- Table 33: Global Reusable Launch Vehicles Market Revenue Million Forecast, by Configuration 2020 & 2033
- Table 34: Global Reusable Launch Vehicles Market Revenue Million Forecast, by Country 2020 & 2033
- Table 35: Saudi Arabia Reusable Launch Vehicles Market Revenue (Million) Forecast, by Application 2020 & 2033
- Table 36: United Arab Emirates Reusable Launch Vehicles Market Revenue (Million) Forecast, by Application 2020 & 2033
- Table 37: Israel Reusable Launch Vehicles Market Revenue (Million) Forecast, by Application 2020 & 2033
- Table 38: South Africa Reusable Launch Vehicles Market Revenue (Million) Forecast, by Application 2020 & 2033
- Table 39: Rest of Middle East and Africa Reusable Launch Vehicles Market Revenue (Million) Forecast, by Application 2020 & 2033
Frequently Asked Questions
1. What is the projected Compound Annual Growth Rate (CAGR) of the Reusable Launch Vehicles Market?
The projected CAGR is approximately 11.65%.
2. Which companies are prominent players in the Reusable Launch Vehicles Market?
Key companies in the market include Space Exploration Technologies Corp, United Launch Alliance LLC, LinkSpace Aerospace Technology Group, China Aerospace Science and Technology Corp (CASC), Blue Origin Enterprises L P, ArianeGroup, Deutsches Zentrum für Luft- und Raumfahrt e V (DLR, Indian Space Research Organisation (ISRO), National Aeronautics and Space Administration (NASA).
3. What are the main segments of the Reusable Launch Vehicles Market?
The market segments include Type, Configuration.
4. Can you provide details about the market size?
The market size is estimated to be USD 3.05 Million as of 2022.
5. What are some drivers contributing to market growth?
N/A
6. What are the notable trends driving market growth?
Fully Reusable Launch Vehicles to hold the Largest Market Share in 2023.
7. Are there any restraints impacting market growth?
N/A
8. Can you provide examples of recent developments in the market?
N/A
9. What pricing options are available for accessing the report?
Pricing options include single-user, multi-user, and enterprise licenses priced at USD 4750, USD 5250, and USD 8750 respectively.
10. Is the market size provided in terms of value or volume?
The market size is provided in terms of value, measured in Million.
11. Are there any specific market keywords associated with the report?
Yes, the market keyword associated with the report is "Reusable Launch Vehicles Market," which aids in identifying and referencing the specific market segment covered.
12. How do I determine which pricing option suits my needs best?
The pricing options vary based on user requirements and access needs. Individual users may opt for single-user licenses, while businesses requiring broader access may choose multi-user or enterprise licenses for cost-effective access to the report.
13. Are there any additional resources or data provided in the Reusable Launch Vehicles Market report?
While the report offers comprehensive insights, it's advisable to review the specific contents or supplementary materials provided to ascertain if additional resources or data are available.
14. How can I stay updated on further developments or reports in the Reusable Launch Vehicles Market?
To stay informed about further developments, trends, and reports in the Reusable Launch Vehicles Market, consider subscribing to industry newsletters, following relevant companies and organizations, or regularly checking reputable industry news sources and publications.
Methodology
Step 1 - Identification of Relevant Samples Size from Population Database


Step 2 - Approaches for Defining Global Market Size (Value, Volume* & Price*)

Note*: In applicable scenarios
Step 3 - Data Sources
Primary Research
- Web Analytics
- Survey Reports
- Research Institute
- Latest Research Reports
- Opinion Leaders
Secondary Research
- Annual Reports
- White Paper
- Latest Press Release
- Industry Association
- Paid Database
- Investor Presentations

Step 4 - Data Triangulation
Involves using different sources of information in order to increase the validity of a study
These sources are likely to be stakeholders in a program - participants, other researchers, program staff, other community members, and so on.
Then we put all data in single framework & apply various statistical tools to find out the dynamic on the market.
During the analysis stage, feedback from the stakeholder groups would be compared to determine areas of agreement as well as areas of divergence