Rice Industry in India in Developing Economies: Trends and Growth Analysis 2025-2033

Rice Industry in India by Production Analysis (Volume), by Consumption Analysis (Value and Volume), by Import Analysis (Value and Volume), by Export Analysis (Value and Volume), by Price Trend Analysis, by Production Analysis (Volume), by Consumption Analysis (Value and Volume), by Import Analysis (Value and Volume), by Export Analysis (Value and Volume), by Price Trend Analysis, by North America (United States, Canada, Mexico), by South America (Brazil, Argentina, Rest of South America), by Europe (United Kingdom, Germany, France, Italy, Spain, Russia, Benelux, Nordics, Rest of Europe), by Middle East & Africa (Turkey, Israel, GCC, North Africa, South Africa, Rest of Middle East & Africa), by Asia Pacific (China, India, Japan, South Korea, ASEAN, Oceania, Rest of Asia Pacific) Forecast 2025-2033

Jun 28 2025
Base Year: 2024

180 Pages
Main Logo

Rice Industry in India in Developing Economies: Trends and Growth Analysis 2025-2033


Home
Industries
Agriculture
sponsor image

Tailored for you

  • In-depth Analysis Tailored to Specified Regions or Segments
  • Company Profiles Customized to User Preferences
  • Comprehensive Insights Focused on Specific Segments or Regions
  • Customized Evaluation of Competitive Landscape to Meet Your Needs
  • Tailored Customization to Address Other Specific Requirements
Ask for customization


Key Insights

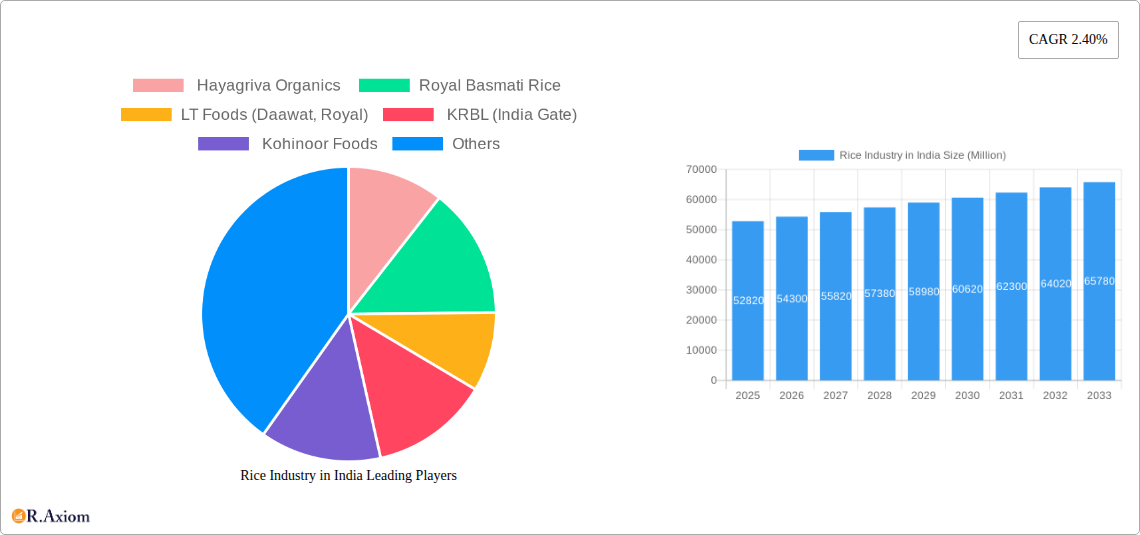
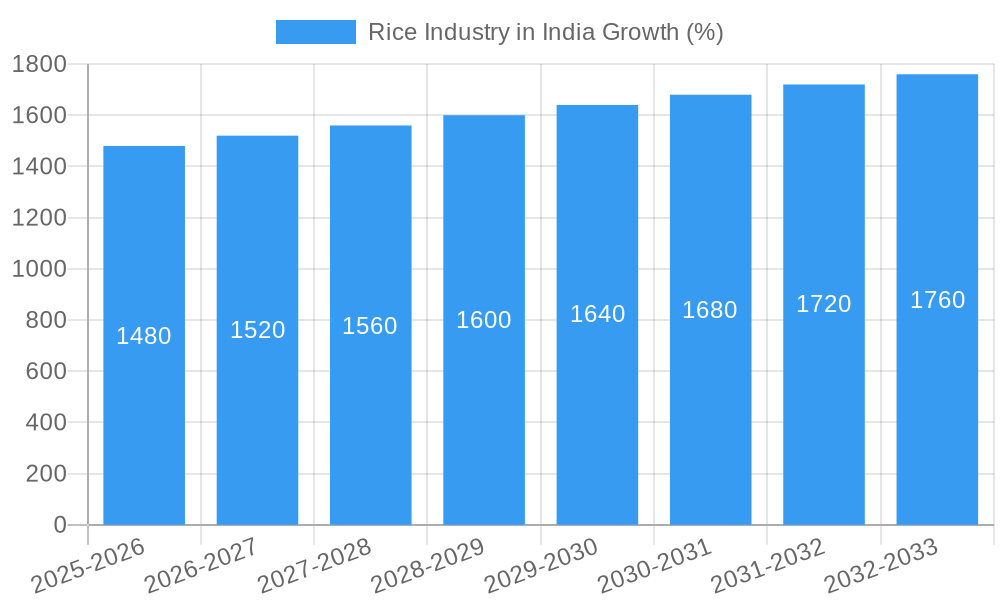
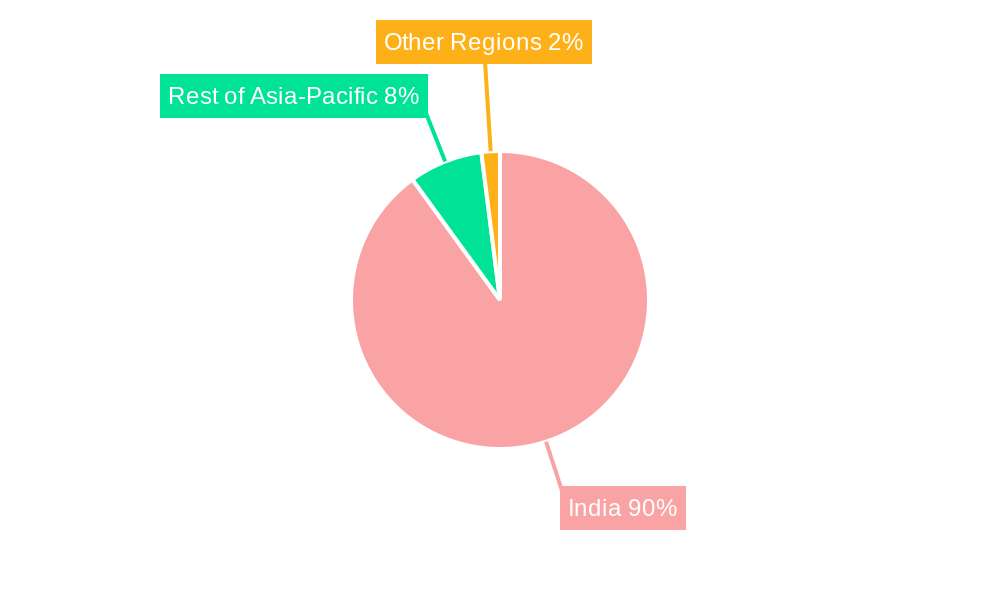
The Indian rice market, valued at $52.82 billion in 2025, is projected to experience steady growth, driven by factors such as rising population, increasing disposable incomes, and evolving dietary preferences. The market's Compound Annual Growth Rate (CAGR) of 2.40% from 2025 to 2033 indicates a gradual but consistent expansion. Key segments within this market include basmati rice, known for its aromatic qualities and high export demand; non-basmati rice, catering to a larger domestic consumption; fortified rice, gaining traction due to its nutritional benefits and government initiatives; and specialty rice varieties, appealing to consumers seeking unique flavors and textures. Major players like LT Foods (Daawat, Royal), KRBL (India Gate), Kohinoor Foods, and Hayagriva Organics compete intensely, focusing on brand building, product innovation, and expanding distribution networks. The Asia-Pacific region, particularly India, dominates the market, with significant consumption and production capabilities. Challenges include fluctuating weather patterns impacting yields, price volatility, and the increasing competition from imported rice. However, the long-term outlook remains positive, given India's significant rice production capacity and growing domestic demand.

The growth trajectory of the Indian rice market is expected to be influenced by several factors. Government policies promoting agricultural efficiency and sustainable farming practices will play a crucial role. Furthermore, the burgeoning food processing industry in India is likely to boost the demand for processed rice products. The increasing adoption of online grocery shopping and e-commerce platforms will contribute to market expansion. However, factors like climate change and its impact on rice production, along with potential trade restrictions, pose challenges to sustained growth. The focus on improving rice quality, introducing value-added products, and catering to changing consumer preferences will be vital for players seeking long-term success in this competitive market.

Rice Industry in India Research Report - Market Size, Growth & Forecast

Rice Industry in India: A Comprehensive Market Report (2019-2033)

This detailed report provides a comprehensive analysis of the Indian rice industry, covering market dynamics, competitive landscape, and future growth prospects from 2019 to 2033. The study period spans 2019-2024 (Historical Period), with 2025 as the base and estimated year, and forecasts extending to 2033 (Forecast Period). This report is invaluable for industry stakeholders, investors, and policymakers seeking actionable insights into this crucial sector.

Rice Industry in India Market Concentration & Innovation

This section analyzes the market concentration, innovation drivers, regulatory landscape, product substitutes, end-user trends, and mergers & acquisitions (M&A) in India's rice industry. India's rice market exhibits moderate concentration, with a few dominant players commanding significant market share. However, numerous smaller regional players cater to specific niche markets. The market share of top 5 players is estimated at xx%.

Innovation Drivers:

  • Technological advancements in farming techniques (e.g., precision agriculture, improved seed varieties).
  • Focus on value-added products (e.g., fortified rice, specialty rice).
  • Growing demand for organic and sustainably produced rice.

Regulatory Framework:

  • Government policies promoting agricultural development and export diversification.
  • Regulations on food safety and quality standards.
  • Environmental regulations impacting farming practices.

Product Substitutes:

  • Other grains (wheat, maize, etc.)
  • Alternative carbohydrate sources (pasta, potatoes, etc.)

End-User Trends:

  • Increasing demand for convenient and ready-to-eat rice products.
  • Growing preference for healthier and functional rice varieties.
  • Shifting consumer preferences towards organic and sustainably sourced rice.

M&A Activities: While precise M&A deal values are unavailable publicly for all transactions, significant consolidation has occurred in recent years with deals totaling an estimated xx Million USD during the historical period. This activity reflects the industry's desire for increased scale and market reach.

Rice Industry in India Industry Trends & Insights

The Indian rice industry has witnessed robust growth in recent years, driven by factors such as rising population, increasing disposable incomes, and changing dietary habits. The compound annual growth rate (CAGR) for the rice market during 2019-2024 was approximately xx%, with market penetration exceeding xx%. Key growth drivers include:

  • Rising demand for rice across various segments (household consumption, food processing, industrial uses).
  • Government initiatives aimed at improving agricultural productivity and farmers' incomes.
  • Technological advancements in rice cultivation and processing.
  • Increasing popularity of value-added rice products.
  • The emergence of e-commerce platforms has expanded market access.

However, challenges such as climate change, water scarcity, and fluctuating prices pose risks to sustainable growth. Competitive dynamics remain intense, with both large national players and smaller regional producers vying for market share. Technological disruptions, such as automation in rice farming and processing, are gradually reshaping the industry landscape. Consumer preferences are shifting towards premium and specialized rice varieties, demanding higher quality and added nutritional value.

Rice Industry in India Growth

Dominant Markets & Segments in Rice Industry in India

The Indian rice market is geographically diverse, with production and consumption varying significantly across regions. While precise figures are unavailable to definitively declare a single dominant region, Uttar Pradesh, Punjab, West Bengal, Andhra Pradesh, and Telangana are major rice-producing states. The segment breakdown is as follows:

Basmati Rice: This segment commands a premium price due to its superior aroma and flavor. Key drivers include:

  • Strong export demand, particularly from the Middle East and other Asian countries.
  • Growing consumer preference for premium rice varieties in domestic markets.

Non-Basmati Rice: This segment accounts for the majority of India's rice production and consumption. Key drivers include:

  • Large domestic consumption base.
  • Availability of various price points to cater to diverse consumer segments.

Fortified Rice: This segment has shown considerable growth due to government initiatives focused on public health and nutritional security. Key drivers include:

  • Government programs promoting fortified rice consumption.
  • Increasing consumer awareness of nutritional benefits.

Specialty Rice: This niche segment encompasses varieties like black rice, red rice, brown rice, etc., with increasing popularity driven by health consciousness and varied tastes. Key drivers include:

  • Growing interest in functional foods.
  • Expanding health-conscious consumer base.

Rice Industry in India Product Developments

Recent product innovations focus on enhancing nutritional value, improving taste and aroma, and offering greater convenience. Fortified rice varieties enriched with essential micronutrients are gaining traction. Ready-to-eat and pre-cooked rice products are capturing significant market share. Technological advancements in processing and packaging extend shelf-life and maintain quality. These developments are crucial for meeting changing consumer needs and enhancing market competitiveness.

Report Scope & Segmentation Analysis

This report segments the Indian rice market based on product type: Basmati Rice, Non-Basmati Rice, Fortified Rice, and Specialty Rice. Each segment's growth projection, market size, and competitive dynamics are analyzed in detail.

Basmati Rice: The market is characterized by a strong export orientation and significant competition among major players.

Non-Basmati Rice: This segment dominates the market in terms of volume, with various sub-categories catering to different consumer segments and price points.

Fortified Rice: The market is expected to grow rapidly, driven by government initiatives and increasing consumer awareness of nutritional benefits.

Specialty Rice: This niche market demonstrates growing consumer interest in healthier and unique rice varieties.

Key Drivers of Rice Industry in India Growth

Several factors are driving growth in India's rice industry:

  • Rising population and increasing consumption.
  • Government support through agricultural subsidies and infrastructure development.
  • Export opportunities to global markets.
  • Technological advancements in rice cultivation, processing, and packaging.

Challenges in the Rice Industry in India Sector

The industry faces challenges such as:

  • Climate change and water scarcity impacting crop yields.
  • Fluctuations in rice prices affecting profitability.
  • Competition from other grains and food products.
  • Supply chain inefficiencies resulting in post-harvest losses.

Emerging Opportunities in Rice Industry in India

Emerging opportunities include:

  • Growing demand for organic and sustainably produced rice.
  • Increased adoption of value-added rice products.
  • Expansion into new export markets.
  • Development of innovative rice-based food products.

Leading Players in the Rice Industry in India Market

  • Hayagriva Organics
  • Royal Basmati Rice
  • LT Foods (Daawat, Royal)
  • KRBL (India Gate)
  • Kohinoor Foods
  • Chaman Lal Setia Exports
  • Amira Nature Foods

Key Developments in Rice Industry in India Industry

  • June 2024: Acharya N.G. Ranga Agricultural University released new high-yielding, pest-resistant rice varieties (MTU 1271, BPT 2846, BPT 2841, and NLR 3238) for Andhra Pradesh, potentially boosting regional production.
  • September 2022: The Government of India banned broken rice exports to increase domestic availability for poultry feed and ethanol production, impacting export-oriented businesses.
  • June 2022: Vida Carbon Corp.'s agreement with Core CarbonX Solutions aims to improve rice farming practices in Telangana, potentially enhancing productivity and sustainability.

Strategic Outlook for Rice Industry in India Market

The Indian rice industry is poised for continued growth, driven by strong domestic demand, expanding export markets, and technological advancements. Opportunities exist in developing value-added products, improving supply chain efficiency, and adopting sustainable farming practices. Focus on innovation, quality, and sustainability will be key to success in this dynamic market.

Rice Industry in India Segmentation

  • 1. Production Analysis (Volume)
  • 2. Consumption Analysis (Value and Volume)
  • 3. Import Analysis (Value and Volume)
  • 4. Export Analysis (Value and Volume)
  • 5. Price Trend Analysis
  • 6. Production Analysis (Volume)
  • 7. Consumption Analysis (Value and Volume)
  • 8. Import Analysis (Value and Volume)
  • 9. Export Analysis (Value and Volume)
  • 10. Price Trend Analysis

Rice Industry in India Segmentation By Geography

  • 1. North America
    • 1.1. United States
    • 1.2. Canada
    • 1.3. Mexico
  • 2. South America
    • 2.1. Brazil
    • 2.2. Argentina
    • 2.3. Rest of South America
  • 3. Europe
    • 3.1. United Kingdom
    • 3.2. Germany
    • 3.3. France
    • 3.4. Italy
    • 3.5. Spain
    • 3.6. Russia
    • 3.7. Benelux
    • 3.8. Nordics
    • 3.9. Rest of Europe
  • 4. Middle East & Africa
    • 4.1. Turkey
    • 4.2. Israel
    • 4.3. GCC
    • 4.4. North Africa
    • 4.5. South Africa
    • 4.6. Rest of Middle East & Africa
  • 5. Asia Pacific
    • 5.1. China
    • 5.2. India
    • 5.3. Japan
    • 5.4. South Korea
    • 5.5. ASEAN
    • 5.6. Oceania
    • 5.7. Rest of Asia Pacific
Rice Industry in India Regional Share


Rice Industry in India REPORT HIGHLIGHTS

AspectsDetails
Study Period 2019-2033
Base Year 2024
Estimated Year 2025
Forecast Period2025-2033
Historical Period2019-2024
Growth RateCAGR of 2.40% from 2019-2033
Segmentation
    • By Production Analysis (Volume)
    • By Consumption Analysis (Value and Volume)
    • By Import Analysis (Value and Volume)
    • By Export Analysis (Value and Volume)
    • By Price Trend Analysis
    • By Production Analysis (Volume)
    • By Consumption Analysis (Value and Volume)
    • By Import Analysis (Value and Volume)
    • By Export Analysis (Value and Volume)
    • By Price Trend Analysis
  • By Geography
    • North America
      • United States
      • Canada
      • Mexico
    • South America
      • Brazil
      • Argentina
      • Rest of South America
    • Europe
      • United Kingdom
      • Germany
      • France
      • Italy
      • Spain
      • Russia
      • Benelux
      • Nordics
      • Rest of Europe
    • Middle East & Africa
      • Turkey
      • Israel
      • GCC
      • North Africa
      • South Africa
      • Rest of Middle East & Africa
    • Asia Pacific
      • China
      • India
      • Japan
      • South Korea
      • ASEAN
      • Oceania
      • Rest of Asia Pacific


Table of Contents

  1. 1. Introduction
    • 1.1. Research Scope
    • 1.2. Market Segmentation
    • 1.3. Research Methodology
    • 1.4. Definitions and Assumptions
  2. 2. Executive Summary
    • 2.1. Introduction
  3. 3. Market Dynamics
    • 3.1. Introduction
      • 3.2. Market Drivers
        • 3.2.1. Increasing Demand for Indian Rice; Enhancing Production Capacities; Increasing Government Initiatives
      • 3.3. Market Restrains
        • 3.3.1. Abiotic and Biotic Stresses in Rice Cultivation; High Market Entry Costs
      • 3.4. Market Trends
        • 3.4.1. Increasing Demand for Indian Rice
  4. 4. Market Factor Analysis
    • 4.1. Porters Five Forces
    • 4.2. Supply/Value Chain
    • 4.3. PESTEL analysis
    • 4.4. Market Entropy
    • 4.5. Patent/Trademark Analysis
  5. 5. Global Rice Industry in India Analysis, Insights and Forecast, 2019-2031
    • 5.1. Market Analysis, Insights and Forecast - by Production Analysis (Volume)
      • 5.2. Market Analysis, Insights and Forecast - by Consumption Analysis (Value and Volume)
        • 5.3. Market Analysis, Insights and Forecast - by Import Analysis (Value and Volume)
          • 5.4. Market Analysis, Insights and Forecast - by Export Analysis (Value and Volume)
            • 5.5. Market Analysis, Insights and Forecast - by Price Trend Analysis
              • 5.6. Market Analysis, Insights and Forecast - by Production Analysis (Volume)
                • 5.7. Market Analysis, Insights and Forecast - by Consumption Analysis (Value and Volume)
                  • 5.8. Market Analysis, Insights and Forecast - by Import Analysis (Value and Volume)
                    • 5.9. Market Analysis, Insights and Forecast - by Export Analysis (Value and Volume)
                      • 5.10. Market Analysis, Insights and Forecast - by Price Trend Analysis
                        • 5.11. Market Analysis, Insights and Forecast - by Region
                          • 5.11.1. North America
                          • 5.11.2. South America
                          • 5.11.3. Europe
                          • 5.11.4. Middle East & Africa
                          • 5.11.5. Asia Pacific
                      • 6. North America Rice Industry in India Analysis, Insights and Forecast, 2019-2031
                        • 6.1. Market Analysis, Insights and Forecast - by Production Analysis (Volume)
                          • 6.2. Market Analysis, Insights and Forecast - by Consumption Analysis (Value and Volume)
                            • 6.3. Market Analysis, Insights and Forecast - by Import Analysis (Value and Volume)
                              • 6.4. Market Analysis, Insights and Forecast - by Export Analysis (Value and Volume)
                                • 6.5. Market Analysis, Insights and Forecast - by Price Trend Analysis
                                  • 6.6. Market Analysis, Insights and Forecast - by Production Analysis (Volume)
                                    • 6.7. Market Analysis, Insights and Forecast - by Consumption Analysis (Value and Volume)
                                      • 6.8. Market Analysis, Insights and Forecast - by Import Analysis (Value and Volume)
                                        • 6.9. Market Analysis, Insights and Forecast - by Export Analysis (Value and Volume)
                                          • 6.10. Market Analysis, Insights and Forecast - by Price Trend Analysis
                                          • 7. South America Rice Industry in India Analysis, Insights and Forecast, 2019-2031
                                            • 7.1. Market Analysis, Insights and Forecast - by Production Analysis (Volume)
                                              • 7.2. Market Analysis, Insights and Forecast - by Consumption Analysis (Value and Volume)
                                                • 7.3. Market Analysis, Insights and Forecast - by Import Analysis (Value and Volume)
                                                  • 7.4. Market Analysis, Insights and Forecast - by Export Analysis (Value and Volume)
                                                    • 7.5. Market Analysis, Insights and Forecast - by Price Trend Analysis
                                                      • 7.6. Market Analysis, Insights and Forecast - by Production Analysis (Volume)
                                                        • 7.7. Market Analysis, Insights and Forecast - by Consumption Analysis (Value and Volume)
                                                          • 7.8. Market Analysis, Insights and Forecast - by Import Analysis (Value and Volume)
                                                            • 7.9. Market Analysis, Insights and Forecast - by Export Analysis (Value and Volume)
                                                              • 7.10. Market Analysis, Insights and Forecast - by Price Trend Analysis
                                                              • 8. Europe Rice Industry in India Analysis, Insights and Forecast, 2019-2031
                                                                • 8.1. Market Analysis, Insights and Forecast - by Production Analysis (Volume)
                                                                  • 8.2. Market Analysis, Insights and Forecast - by Consumption Analysis (Value and Volume)
                                                                    • 8.3. Market Analysis, Insights and Forecast - by Import Analysis (Value and Volume)
                                                                      • 8.4. Market Analysis, Insights and Forecast - by Export Analysis (Value and Volume)
                                                                        • 8.5. Market Analysis, Insights and Forecast - by Price Trend Analysis
                                                                          • 8.6. Market Analysis, Insights and Forecast - by Production Analysis (Volume)
                                                                            • 8.7. Market Analysis, Insights and Forecast - by Consumption Analysis (Value and Volume)
                                                                              • 8.8. Market Analysis, Insights and Forecast - by Import Analysis (Value and Volume)
                                                                                • 8.9. Market Analysis, Insights and Forecast - by Export Analysis (Value and Volume)
                                                                                  • 8.10. Market Analysis, Insights and Forecast - by Price Trend Analysis
                                                                                  • 9. Middle East & Africa Rice Industry in India Analysis, Insights and Forecast, 2019-2031
                                                                                    • 9.1. Market Analysis, Insights and Forecast - by Production Analysis (Volume)
                                                                                      • 9.2. Market Analysis, Insights and Forecast - by Consumption Analysis (Value and Volume)
                                                                                        • 9.3. Market Analysis, Insights and Forecast - by Import Analysis (Value and Volume)
                                                                                          • 9.4. Market Analysis, Insights and Forecast - by Export Analysis (Value and Volume)
                                                                                            • 9.5. Market Analysis, Insights and Forecast - by Price Trend Analysis
                                                                                              • 9.6. Market Analysis, Insights and Forecast - by Production Analysis (Volume)
                                                                                                • 9.7. Market Analysis, Insights and Forecast - by Consumption Analysis (Value and Volume)
                                                                                                  • 9.8. Market Analysis, Insights and Forecast - by Import Analysis (Value and Volume)
                                                                                                    • 9.9. Market Analysis, Insights and Forecast - by Export Analysis (Value and Volume)
                                                                                                      • 9.10. Market Analysis, Insights and Forecast - by Price Trend Analysis
                                                                                                      • 10. Asia Pacific Rice Industry in India Analysis, Insights and Forecast, 2019-2031
                                                                                                        • 10.1. Market Analysis, Insights and Forecast - by Production Analysis (Volume)
                                                                                                          • 10.2. Market Analysis, Insights and Forecast - by Consumption Analysis (Value and Volume)
                                                                                                            • 10.3. Market Analysis, Insights and Forecast - by Import Analysis (Value and Volume)
                                                                                                              • 10.4. Market Analysis, Insights and Forecast - by Export Analysis (Value and Volume)
                                                                                                                • 10.5. Market Analysis, Insights and Forecast - by Price Trend Analysis
                                                                                                                  • 10.6. Market Analysis, Insights and Forecast - by Production Analysis (Volume)
                                                                                                                    • 10.7. Market Analysis, Insights and Forecast - by Consumption Analysis (Value and Volume)
                                                                                                                      • 10.8. Market Analysis, Insights and Forecast - by Import Analysis (Value and Volume)
                                                                                                                        • 10.9. Market Analysis, Insights and Forecast - by Export Analysis (Value and Volume)
                                                                                                                          • 10.10. Market Analysis, Insights and Forecast - by Price Trend Analysis
                                                                                                                          • 11. China Rice Industry in India Analysis, Insights and Forecast, 2019-2031
                                                                                                                            • 12. Japan Rice Industry in India Analysis, Insights and Forecast, 2019-2031
                                                                                                                              • 13. India Rice Industry in India Analysis, Insights and Forecast, 2019-2031
                                                                                                                                • 14. South Korea Rice Industry in India Analysis, Insights and Forecast, 2019-2031
                                                                                                                                  • 15. Taiwan Rice Industry in India Analysis, Insights and Forecast, 2019-2031
                                                                                                                                    • 16. Australia Rice Industry in India Analysis, Insights and Forecast, 2019-2031
                                                                                                                                      • 17. Rest of Asia-Pacific Rice Industry in India Analysis, Insights and Forecast, 2019-2031
                                                                                                                                        • 18. Competitive Analysis
                                                                                                                                          • 18.1. Global Market Share Analysis 2024
                                                                                                                                            • 18.2. Company Profiles
                                                                                                                                              • 18.2.1 Hayagriva Organics
                                                                                                                                                • 18.2.1.1. Overview
                                                                                                                                                • 18.2.1.2. Products
                                                                                                                                                • 18.2.1.3. SWOT Analysis
                                                                                                                                                • 18.2.1.4. Recent Developments
                                                                                                                                                • 18.2.1.5. Financials (Based on Availability)
                                                                                                                                              • 18.2.2 Royal Basmati Rice
                                                                                                                                                • 18.2.2.1. Overview
                                                                                                                                                • 18.2.2.2. Products
                                                                                                                                                • 18.2.2.3. SWOT Analysis
                                                                                                                                                • 18.2.2.4. Recent Developments
                                                                                                                                                • 18.2.2.5. Financials (Based on Availability)
                                                                                                                                              • 18.2.3 LT Foods (Daawat Royal)
                                                                                                                                                • 18.2.3.1. Overview
                                                                                                                                                • 18.2.3.2. Products
                                                                                                                                                • 18.2.3.3. SWOT Analysis
                                                                                                                                                • 18.2.3.4. Recent Developments
                                                                                                                                                • 18.2.3.5. Financials (Based on Availability)
                                                                                                                                              • 18.2.4 KRBL (India Gate)
                                                                                                                                                • 18.2.4.1. Overview
                                                                                                                                                • 18.2.4.2. Products
                                                                                                                                                • 18.2.4.3. SWOT Analysis
                                                                                                                                                • 18.2.4.4. Recent Developments
                                                                                                                                                • 18.2.4.5. Financials (Based on Availability)
                                                                                                                                              • 18.2.5 Kohinoor Foods
                                                                                                                                                • 18.2.5.1. Overview
                                                                                                                                                • 18.2.5.2. Products
                                                                                                                                                • 18.2.5.3. SWOT Analysis
                                                                                                                                                • 18.2.5.4. Recent Developments
                                                                                                                                                • 18.2.5.5. Financials (Based on Availability)
                                                                                                                                              • 18.2.6 Chaman Lal Setia Exports
                                                                                                                                                • 18.2.6.1. Overview
                                                                                                                                                • 18.2.6.2. Products
                                                                                                                                                • 18.2.6.3. SWOT Analysis
                                                                                                                                                • 18.2.6.4. Recent Developments
                                                                                                                                                • 18.2.6.5. Financials (Based on Availability)
                                                                                                                                              • 18.2.7 Amira Nature Foods
                                                                                                                                                • 18.2.7.1. Overview
                                                                                                                                                • 18.2.7.2. Products
                                                                                                                                                • 18.2.7.3. SWOT Analysis
                                                                                                                                                • 18.2.7.4. Recent Developments
                                                                                                                                                • 18.2.7.5. Financials (Based on Availability)

                                                                                                                                        List of Figures

                                                                                                                                        1. Figure 1: Global Rice Industry in India Revenue Breakdown (Million, %) by Region 2024 & 2032
                                                                                                                                        2. Figure 2: Global Rice Industry in India Volume Breakdown (Kiloton, %) by Region 2024 & 2032
                                                                                                                                        3. Figure 3: Asia Pacific Rice Industry in India Revenue (Million), by Country 2024 & 2032
                                                                                                                                        4. Figure 4: Asia Pacific Rice Industry in India Volume (Kiloton), by Country 2024 & 2032
                                                                                                                                        5. Figure 5: Asia Pacific Rice Industry in India Revenue Share (%), by Country 2024 & 2032
                                                                                                                                        6. Figure 6: Asia Pacific Rice Industry in India Volume Share (%), by Country 2024 & 2032
                                                                                                                                        7. Figure 7: North America Rice Industry in India Revenue (Million), by Production Analysis (Volume) 2024 & 2032
                                                                                                                                        8. Figure 8: North America Rice Industry in India Volume (Kiloton), by Production Analysis (Volume) 2024 & 2032
                                                                                                                                        9. Figure 9: North America Rice Industry in India Revenue Share (%), by Production Analysis (Volume) 2024 & 2032
                                                                                                                                        10. Figure 10: North America Rice Industry in India Volume Share (%), by Production Analysis (Volume) 2024 & 2032
                                                                                                                                        11. Figure 11: North America Rice Industry in India Revenue (Million), by Consumption Analysis (Value and Volume) 2024 & 2032
                                                                                                                                        12. Figure 12: North America Rice Industry in India Volume (Kiloton), by Consumption Analysis (Value and Volume) 2024 & 2032
                                                                                                                                        13. Figure 13: North America Rice Industry in India Revenue Share (%), by Consumption Analysis (Value and Volume) 2024 & 2032
                                                                                                                                        14. Figure 14: North America Rice Industry in India Volume Share (%), by Consumption Analysis (Value and Volume) 2024 & 2032
                                                                                                                                        15. Figure 15: North America Rice Industry in India Revenue (Million), by Import Analysis (Value and Volume) 2024 & 2032
                                                                                                                                        16. Figure 16: North America Rice Industry in India Volume (Kiloton), by Import Analysis (Value and Volume) 2024 & 2032
                                                                                                                                        17. Figure 17: North America Rice Industry in India Revenue Share (%), by Import Analysis (Value and Volume) 2024 & 2032
                                                                                                                                        18. Figure 18: North America Rice Industry in India Volume Share (%), by Import Analysis (Value and Volume) 2024 & 2032
                                                                                                                                        19. Figure 19: North America Rice Industry in India Revenue (Million), by Export Analysis (Value and Volume) 2024 & 2032
                                                                                                                                        20. Figure 20: North America Rice Industry in India Volume (Kiloton), by Export Analysis (Value and Volume) 2024 & 2032
                                                                                                                                        21. Figure 21: North America Rice Industry in India Revenue Share (%), by Export Analysis (Value and Volume) 2024 & 2032
                                                                                                                                        22. Figure 22: North America Rice Industry in India Volume Share (%), by Export Analysis (Value and Volume) 2024 & 2032
                                                                                                                                        23. Figure 23: North America Rice Industry in India Revenue (Million), by Price Trend Analysis 2024 & 2032
                                                                                                                                        24. Figure 24: North America Rice Industry in India Volume (Kiloton), by Price Trend Analysis 2024 & 2032
                                                                                                                                        25. Figure 25: North America Rice Industry in India Revenue Share (%), by Price Trend Analysis 2024 & 2032
                                                                                                                                        26. Figure 26: North America Rice Industry in India Volume Share (%), by Price Trend Analysis 2024 & 2032
                                                                                                                                        27. Figure 27: North America Rice Industry in India Revenue (Million), by Production Analysis (Volume) 2024 & 2032
                                                                                                                                        28. Figure 28: North America Rice Industry in India Volume (Kiloton), by Production Analysis (Volume) 2024 & 2032
                                                                                                                                        29. Figure 29: North America Rice Industry in India Revenue Share (%), by Production Analysis (Volume) 2024 & 2032
                                                                                                                                        30. Figure 30: North America Rice Industry in India Volume Share (%), by Production Analysis (Volume) 2024 & 2032
                                                                                                                                        31. Figure 31: North America Rice Industry in India Revenue (Million), by Consumption Analysis (Value and Volume) 2024 & 2032
                                                                                                                                        32. Figure 32: North America Rice Industry in India Volume (Kiloton), by Consumption Analysis (Value and Volume) 2024 & 2032
                                                                                                                                        33. Figure 33: North America Rice Industry in India Revenue Share (%), by Consumption Analysis (Value and Volume) 2024 & 2032
                                                                                                                                        34. Figure 34: North America Rice Industry in India Volume Share (%), by Consumption Analysis (Value and Volume) 2024 & 2032
                                                                                                                                        35. Figure 35: North America Rice Industry in India Revenue (Million), by Import Analysis (Value and Volume) 2024 & 2032
                                                                                                                                        36. Figure 36: North America Rice Industry in India Volume (Kiloton), by Import Analysis (Value and Volume) 2024 & 2032
                                                                                                                                        37. Figure 37: North America Rice Industry in India Revenue Share (%), by Import Analysis (Value and Volume) 2024 & 2032
                                                                                                                                        38. Figure 38: North America Rice Industry in India Volume Share (%), by Import Analysis (Value and Volume) 2024 & 2032
                                                                                                                                        39. Figure 39: North America Rice Industry in India Revenue (Million), by Export Analysis (Value and Volume) 2024 & 2032
                                                                                                                                        40. Figure 40: North America Rice Industry in India Volume (Kiloton), by Export Analysis (Value and Volume) 2024 & 2032
                                                                                                                                        41. Figure 41: North America Rice Industry in India Revenue Share (%), by Export Analysis (Value and Volume) 2024 & 2032
                                                                                                                                        42. Figure 42: North America Rice Industry in India Volume Share (%), by Export Analysis (Value and Volume) 2024 & 2032
                                                                                                                                        43. Figure 43: North America Rice Industry in India Revenue (Million), by Price Trend Analysis 2024 & 2032
                                                                                                                                        44. Figure 44: North America Rice Industry in India Volume (Kiloton), by Price Trend Analysis 2024 & 2032
                                                                                                                                        45. Figure 45: North America Rice Industry in India Revenue Share (%), by Price Trend Analysis 2024 & 2032
                                                                                                                                        46. Figure 46: North America Rice Industry in India Volume Share (%), by Price Trend Analysis 2024 & 2032
                                                                                                                                        47. Figure 47: North America Rice Industry in India Revenue (Million), by Country 2024 & 2032
                                                                                                                                        48. Figure 48: North America Rice Industry in India Volume (Kiloton), by Country 2024 & 2032
                                                                                                                                        49. Figure 49: North America Rice Industry in India Revenue Share (%), by Country 2024 & 2032
                                                                                                                                        50. Figure 50: North America Rice Industry in India Volume Share (%), by Country 2024 & 2032
                                                                                                                                        51. Figure 51: South America Rice Industry in India Revenue (Million), by Production Analysis (Volume) 2024 & 2032
                                                                                                                                        52. Figure 52: South America Rice Industry in India Volume (Kiloton), by Production Analysis (Volume) 2024 & 2032
                                                                                                                                        53. Figure 53: South America Rice Industry in India Revenue Share (%), by Production Analysis (Volume) 2024 & 2032
                                                                                                                                        54. Figure 54: South America Rice Industry in India Volume Share (%), by Production Analysis (Volume) 2024 & 2032
                                                                                                                                        55. Figure 55: South America Rice Industry in India Revenue (Million), by Consumption Analysis (Value and Volume) 2024 & 2032
                                                                                                                                        56. Figure 56: South America Rice Industry in India Volume (Kiloton), by Consumption Analysis (Value and Volume) 2024 & 2032
                                                                                                                                        57. Figure 57: South America Rice Industry in India Revenue Share (%), by Consumption Analysis (Value and Volume) 2024 & 2032
                                                                                                                                        58. Figure 58: South America Rice Industry in India Volume Share (%), by Consumption Analysis (Value and Volume) 2024 & 2032
                                                                                                                                        59. Figure 59: South America Rice Industry in India Revenue (Million), by Import Analysis (Value and Volume) 2024 & 2032
                                                                                                                                        60. Figure 60: South America Rice Industry in India Volume (Kiloton), by Import Analysis (Value and Volume) 2024 & 2032
                                                                                                                                        61. Figure 61: South America Rice Industry in India Revenue Share (%), by Import Analysis (Value and Volume) 2024 & 2032
                                                                                                                                        62. Figure 62: South America Rice Industry in India Volume Share (%), by Import Analysis (Value and Volume) 2024 & 2032
                                                                                                                                        63. Figure 63: South America Rice Industry in India Revenue (Million), by Export Analysis (Value and Volume) 2024 & 2032
                                                                                                                                        64. Figure 64: South America Rice Industry in India Volume (Kiloton), by Export Analysis (Value and Volume) 2024 & 2032
                                                                                                                                        65. Figure 65: South America Rice Industry in India Revenue Share (%), by Export Analysis (Value and Volume) 2024 & 2032
                                                                                                                                        66. Figure 66: South America Rice Industry in India Volume Share (%), by Export Analysis (Value and Volume) 2024 & 2032
                                                                                                                                        67. Figure 67: South America Rice Industry in India Revenue (Million), by Price Trend Analysis 2024 & 2032
                                                                                                                                        68. Figure 68: South America Rice Industry in India Volume (Kiloton), by Price Trend Analysis 2024 & 2032
                                                                                                                                        69. Figure 69: South America Rice Industry in India Revenue Share (%), by Price Trend Analysis 2024 & 2032
                                                                                                                                        70. Figure 70: South America Rice Industry in India Volume Share (%), by Price Trend Analysis 2024 & 2032
                                                                                                                                        71. Figure 71: South America Rice Industry in India Revenue (Million), by Production Analysis (Volume) 2024 & 2032
                                                                                                                                        72. Figure 72: South America Rice Industry in India Volume (Kiloton), by Production Analysis (Volume) 2024 & 2032
                                                                                                                                        73. Figure 73: South America Rice Industry in India Revenue Share (%), by Production Analysis (Volume) 2024 & 2032
                                                                                                                                        74. Figure 74: South America Rice Industry in India Volume Share (%), by Production Analysis (Volume) 2024 & 2032
                                                                                                                                        75. Figure 75: South America Rice Industry in India Revenue (Million), by Consumption Analysis (Value and Volume) 2024 & 2032
                                                                                                                                        76. Figure 76: South America Rice Industry in India Volume (Kiloton), by Consumption Analysis (Value and Volume) 2024 & 2032
                                                                                                                                        77. Figure 77: South America Rice Industry in India Revenue Share (%), by Consumption Analysis (Value and Volume) 2024 & 2032
                                                                                                                                        78. Figure 78: South America Rice Industry in India Volume Share (%), by Consumption Analysis (Value and Volume) 2024 & 2032
                                                                                                                                        79. Figure 79: South America Rice Industry in India Revenue (Million), by Import Analysis (Value and Volume) 2024 & 2032
                                                                                                                                        80. Figure 80: South America Rice Industry in India Volume (Kiloton), by Import Analysis (Value and Volume) 2024 & 2032
                                                                                                                                        81. Figure 81: South America Rice Industry in India Revenue Share (%), by Import Analysis (Value and Volume) 2024 & 2032
                                                                                                                                        82. Figure 82: South America Rice Industry in India Volume Share (%), by Import Analysis (Value and Volume) 2024 & 2032
                                                                                                                                        83. Figure 83: South America Rice Industry in India Revenue (Million), by Export Analysis (Value and Volume) 2024 & 2032
                                                                                                                                        84. Figure 84: South America Rice Industry in India Volume (Kiloton), by Export Analysis (Value and Volume) 2024 & 2032
                                                                                                                                        85. Figure 85: South America Rice Industry in India Revenue Share (%), by Export Analysis (Value and Volume) 2024 & 2032
                                                                                                                                        86. Figure 86: South America Rice Industry in India Volume Share (%), by Export Analysis (Value and Volume) 2024 & 2032
                                                                                                                                        87. Figure 87: South America Rice Industry in India Revenue (Million), by Price Trend Analysis 2024 & 2032
                                                                                                                                        88. Figure 88: South America Rice Industry in India Volume (Kiloton), by Price Trend Analysis 2024 & 2032
                                                                                                                                        89. Figure 89: South America Rice Industry in India Revenue Share (%), by Price Trend Analysis 2024 & 2032
                                                                                                                                        90. Figure 90: South America Rice Industry in India Volume Share (%), by Price Trend Analysis 2024 & 2032
                                                                                                                                        91. Figure 91: South America Rice Industry in India Revenue (Million), by Country 2024 & 2032
                                                                                                                                        92. Figure 92: South America Rice Industry in India Volume (Kiloton), by Country 2024 & 2032
                                                                                                                                        93. Figure 93: South America Rice Industry in India Revenue Share (%), by Country 2024 & 2032
                                                                                                                                        94. Figure 94: South America Rice Industry in India Volume Share (%), by Country 2024 & 2032
                                                                                                                                        95. Figure 95: Europe Rice Industry in India Revenue (Million), by Production Analysis (Volume) 2024 & 2032
                                                                                                                                        96. Figure 96: Europe Rice Industry in India Volume (Kiloton), by Production Analysis (Volume) 2024 & 2032
                                                                                                                                        97. Figure 97: Europe Rice Industry in India Revenue Share (%), by Production Analysis (Volume) 2024 & 2032
                                                                                                                                        98. Figure 98: Europe Rice Industry in India Volume Share (%), by Production Analysis (Volume) 2024 & 2032
                                                                                                                                        99. Figure 99: Europe Rice Industry in India Revenue (Million), by Consumption Analysis (Value and Volume) 2024 & 2032
                                                                                                                                        100. Figure 100: Europe Rice Industry in India Volume (Kiloton), by Consumption Analysis (Value and Volume) 2024 & 2032
                                                                                                                                        101. Figure 101: Europe Rice Industry in India Revenue Share (%), by Consumption Analysis (Value and Volume) 2024 & 2032
                                                                                                                                        102. Figure 102: Europe Rice Industry in India Volume Share (%), by Consumption Analysis (Value and Volume) 2024 & 2032
                                                                                                                                        103. Figure 103: Europe Rice Industry in India Revenue (Million), by Import Analysis (Value and Volume) 2024 & 2032
                                                                                                                                        104. Figure 104: Europe Rice Industry in India Volume (Kiloton), by Import Analysis (Value and Volume) 2024 & 2032
                                                                                                                                        105. Figure 105: Europe Rice Industry in India Revenue Share (%), by Import Analysis (Value and Volume) 2024 & 2032
                                                                                                                                        106. Figure 106: Europe Rice Industry in India Volume Share (%), by Import Analysis (Value and Volume) 2024 & 2032
                                                                                                                                        107. Figure 107: Europe Rice Industry in India Revenue (Million), by Export Analysis (Value and Volume) 2024 & 2032
                                                                                                                                        108. Figure 108: Europe Rice Industry in India Volume (Kiloton), by Export Analysis (Value and Volume) 2024 & 2032
                                                                                                                                        109. Figure 109: Europe Rice Industry in India Revenue Share (%), by Export Analysis (Value and Volume) 2024 & 2032
                                                                                                                                        110. Figure 110: Europe Rice Industry in India Volume Share (%), by Export Analysis (Value and Volume) 2024 & 2032
                                                                                                                                        111. Figure 111: Europe Rice Industry in India Revenue (Million), by Price Trend Analysis 2024 & 2032
                                                                                                                                        112. Figure 112: Europe Rice Industry in India Volume (Kiloton), by Price Trend Analysis 2024 & 2032
                                                                                                                                        113. Figure 113: Europe Rice Industry in India Revenue Share (%), by Price Trend Analysis 2024 & 2032
                                                                                                                                        114. Figure 114: Europe Rice Industry in India Volume Share (%), by Price Trend Analysis 2024 & 2032
                                                                                                                                        115. Figure 115: Europe Rice Industry in India Revenue (Million), by Production Analysis (Volume) 2024 & 2032
                                                                                                                                        116. Figure 116: Europe Rice Industry in India Volume (Kiloton), by Production Analysis (Volume) 2024 & 2032
                                                                                                                                        117. Figure 117: Europe Rice Industry in India Revenue Share (%), by Production Analysis (Volume) 2024 & 2032
                                                                                                                                        118. Figure 118: Europe Rice Industry in India Volume Share (%), by Production Analysis (Volume) 2024 & 2032
                                                                                                                                        119. Figure 119: Europe Rice Industry in India Revenue (Million), by Consumption Analysis (Value and Volume) 2024 & 2032
                                                                                                                                        120. Figure 120: Europe Rice Industry in India Volume (Kiloton), by Consumption Analysis (Value and Volume) 2024 & 2032
                                                                                                                                        121. Figure 121: Europe Rice Industry in India Revenue Share (%), by Consumption Analysis (Value and Volume) 2024 & 2032
                                                                                                                                        122. Figure 122: Europe Rice Industry in India Volume Share (%), by Consumption Analysis (Value and Volume) 2024 & 2032
                                                                                                                                        123. Figure 123: Europe Rice Industry in India Revenue (Million), by Import Analysis (Value and Volume) 2024 & 2032
                                                                                                                                        124. Figure 124: Europe Rice Industry in India Volume (Kiloton), by Import Analysis (Value and Volume) 2024 & 2032
                                                                                                                                        125. Figure 125: Europe Rice Industry in India Revenue Share (%), by Import Analysis (Value and Volume) 2024 & 2032
                                                                                                                                        126. Figure 126: Europe Rice Industry in India Volume Share (%), by Import Analysis (Value and Volume) 2024 & 2032
                                                                                                                                        127. Figure 127: Europe Rice Industry in India Revenue (Million), by Export Analysis (Value and Volume) 2024 & 2032
                                                                                                                                        128. Figure 128: Europe Rice Industry in India Volume (Kiloton), by Export Analysis (Value and Volume) 2024 & 2032
                                                                                                                                        129. Figure 129: Europe Rice Industry in India Revenue Share (%), by Export Analysis (Value and Volume) 2024 & 2032
                                                                                                                                        130. Figure 130: Europe Rice Industry in India Volume Share (%), by Export Analysis (Value and Volume) 2024 & 2032
                                                                                                                                        131. Figure 131: Europe Rice Industry in India Revenue (Million), by Price Trend Analysis 2024 & 2032
                                                                                                                                        132. Figure 132: Europe Rice Industry in India Volume (Kiloton), by Price Trend Analysis 2024 & 2032
                                                                                                                                        133. Figure 133: Europe Rice Industry in India Revenue Share (%), by Price Trend Analysis 2024 & 2032
                                                                                                                                        134. Figure 134: Europe Rice Industry in India Volume Share (%), by Price Trend Analysis 2024 & 2032
                                                                                                                                        135. Figure 135: Europe Rice Industry in India Revenue (Million), by Country 2024 & 2032
                                                                                                                                        136. Figure 136: Europe Rice Industry in India Volume (Kiloton), by Country 2024 & 2032
                                                                                                                                        137. Figure 137: Europe Rice Industry in India Revenue Share (%), by Country 2024 & 2032
                                                                                                                                        138. Figure 138: Europe Rice Industry in India Volume Share (%), by Country 2024 & 2032
                                                                                                                                        139. Figure 139: Middle East & Africa Rice Industry in India Revenue (Million), by Production Analysis (Volume) 2024 & 2032
                                                                                                                                        140. Figure 140: Middle East & Africa Rice Industry in India Volume (Kiloton), by Production Analysis (Volume) 2024 & 2032
                                                                                                                                        141. Figure 141: Middle East & Africa Rice Industry in India Revenue Share (%), by Production Analysis (Volume) 2024 & 2032
                                                                                                                                        142. Figure 142: Middle East & Africa Rice Industry in India Volume Share (%), by Production Analysis (Volume) 2024 & 2032
                                                                                                                                        143. Figure 143: Middle East & Africa Rice Industry in India Revenue (Million), by Consumption Analysis (Value and Volume) 2024 & 2032
                                                                                                                                        144. Figure 144: Middle East & Africa Rice Industry in India Volume (Kiloton), by Consumption Analysis (Value and Volume) 2024 & 2032
                                                                                                                                        145. Figure 145: Middle East & Africa Rice Industry in India Revenue Share (%), by Consumption Analysis (Value and Volume) 2024 & 2032
                                                                                                                                        146. Figure 146: Middle East & Africa Rice Industry in India Volume Share (%), by Consumption Analysis (Value and Volume) 2024 & 2032
                                                                                                                                        147. Figure 147: Middle East & Africa Rice Industry in India Revenue (Million), by Import Analysis (Value and Volume) 2024 & 2032
                                                                                                                                        148. Figure 148: Middle East & Africa Rice Industry in India Volume (Kiloton), by Import Analysis (Value and Volume) 2024 & 2032
                                                                                                                                        149. Figure 149: Middle East & Africa Rice Industry in India Revenue Share (%), by Import Analysis (Value and Volume) 2024 & 2032
                                                                                                                                        150. Figure 150: Middle East & Africa Rice Industry in India Volume Share (%), by Import Analysis (Value and Volume) 2024 & 2032
                                                                                                                                        151. Figure 151: Middle East & Africa Rice Industry in India Revenue (Million), by Export Analysis (Value and Volume) 2024 & 2032
                                                                                                                                        152. Figure 152: Middle East & Africa Rice Industry in India Volume (Kiloton), by Export Analysis (Value and Volume) 2024 & 2032
                                                                                                                                        153. Figure 153: Middle East & Africa Rice Industry in India Revenue Share (%), by Export Analysis (Value and Volume) 2024 & 2032
                                                                                                                                        154. Figure 154: Middle East & Africa Rice Industry in India Volume Share (%), by Export Analysis (Value and Volume) 2024 & 2032
                                                                                                                                        155. Figure 155: Middle East & Africa Rice Industry in India Revenue (Million), by Price Trend Analysis 2024 & 2032
                                                                                                                                        156. Figure 156: Middle East & Africa Rice Industry in India Volume (Kiloton), by Price Trend Analysis 2024 & 2032
                                                                                                                                        157. Figure 157: Middle East & Africa Rice Industry in India Revenue Share (%), by Price Trend Analysis 2024 & 2032
                                                                                                                                        158. Figure 158: Middle East & Africa Rice Industry in India Volume Share (%), by Price Trend Analysis 2024 & 2032
                                                                                                                                        159. Figure 159: Middle East & Africa Rice Industry in India Revenue (Million), by Production Analysis (Volume) 2024 & 2032
                                                                                                                                        160. Figure 160: Middle East & Africa Rice Industry in India Volume (Kiloton), by Production Analysis (Volume) 2024 & 2032
                                                                                                                                        161. Figure 161: Middle East & Africa Rice Industry in India Revenue Share (%), by Production Analysis (Volume) 2024 & 2032
                                                                                                                                        162. Figure 162: Middle East & Africa Rice Industry in India Volume Share (%), by Production Analysis (Volume) 2024 & 2032
                                                                                                                                        163. Figure 163: Middle East & Africa Rice Industry in India Revenue (Million), by Consumption Analysis (Value and Volume) 2024 & 2032
                                                                                                                                        164. Figure 164: Middle East & Africa Rice Industry in India Volume (Kiloton), by Consumption Analysis (Value and Volume) 2024 & 2032
                                                                                                                                        165. Figure 165: Middle East & Africa Rice Industry in India Revenue Share (%), by Consumption Analysis (Value and Volume) 2024 & 2032
                                                                                                                                        166. Figure 166: Middle East & Africa Rice Industry in India Volume Share (%), by Consumption Analysis (Value and Volume) 2024 & 2032
                                                                                                                                        167. Figure 167: Middle East & Africa Rice Industry in India Revenue (Million), by Import Analysis (Value and Volume) 2024 & 2032
                                                                                                                                        168. Figure 168: Middle East & Africa Rice Industry in India Volume (Kiloton), by Import Analysis (Value and Volume) 2024 & 2032
                                                                                                                                        169. Figure 169: Middle East & Africa Rice Industry in India Revenue Share (%), by Import Analysis (Value and Volume) 2024 & 2032
                                                                                                                                        170. Figure 170: Middle East & Africa Rice Industry in India Volume Share (%), by Import Analysis (Value and Volume) 2024 & 2032
                                                                                                                                        171. Figure 171: Middle East & Africa Rice Industry in India Revenue (Million), by Export Analysis (Value and Volume) 2024 & 2032
                                                                                                                                        172. Figure 172: Middle East & Africa Rice Industry in India Volume (Kiloton), by Export Analysis (Value and Volume) 2024 & 2032
                                                                                                                                        173. Figure 173: Middle East & Africa Rice Industry in India Revenue Share (%), by Export Analysis (Value and Volume) 2024 & 2032
                                                                                                                                        174. Figure 174: Middle East & Africa Rice Industry in India Volume Share (%), by Export Analysis (Value and Volume) 2024 & 2032
                                                                                                                                        175. Figure 175: Middle East & Africa Rice Industry in India Revenue (Million), by Price Trend Analysis 2024 & 2032
                                                                                                                                        176. Figure 176: Middle East & Africa Rice Industry in India Volume (Kiloton), by Price Trend Analysis 2024 & 2032
                                                                                                                                        177. Figure 177: Middle East & Africa Rice Industry in India Revenue Share (%), by Price Trend Analysis 2024 & 2032
                                                                                                                                        178. Figure 178: Middle East & Africa Rice Industry in India Volume Share (%), by Price Trend Analysis 2024 & 2032
                                                                                                                                        179. Figure 179: Middle East & Africa Rice Industry in India Revenue (Million), by Country 2024 & 2032
                                                                                                                                        180. Figure 180: Middle East & Africa Rice Industry in India Volume (Kiloton), by Country 2024 & 2032
                                                                                                                                        181. Figure 181: Middle East & Africa Rice Industry in India Revenue Share (%), by Country 2024 & 2032
                                                                                                                                        182. Figure 182: Middle East & Africa Rice Industry in India Volume Share (%), by Country 2024 & 2032
                                                                                                                                        183. Figure 183: Asia Pacific Rice Industry in India Revenue (Million), by Production Analysis (Volume) 2024 & 2032
                                                                                                                                        184. Figure 184: Asia Pacific Rice Industry in India Volume (Kiloton), by Production Analysis (Volume) 2024 & 2032
                                                                                                                                        185. Figure 185: Asia Pacific Rice Industry in India Revenue Share (%), by Production Analysis (Volume) 2024 & 2032
                                                                                                                                        186. Figure 186: Asia Pacific Rice Industry in India Volume Share (%), by Production Analysis (Volume) 2024 & 2032
                                                                                                                                        187. Figure 187: Asia Pacific Rice Industry in India Revenue (Million), by Consumption Analysis (Value and Volume) 2024 & 2032
                                                                                                                                        188. Figure 188: Asia Pacific Rice Industry in India Volume (Kiloton), by Consumption Analysis (Value and Volume) 2024 & 2032
                                                                                                                                        189. Figure 189: Asia Pacific Rice Industry in India Revenue Share (%), by Consumption Analysis (Value and Volume) 2024 & 2032
                                                                                                                                        190. Figure 190: Asia Pacific Rice Industry in India Volume Share (%), by Consumption Analysis (Value and Volume) 2024 & 2032
                                                                                                                                        191. Figure 191: Asia Pacific Rice Industry in India Revenue (Million), by Import Analysis (Value and Volume) 2024 & 2032
                                                                                                                                        192. Figure 192: Asia Pacific Rice Industry in India Volume (Kiloton), by Import Analysis (Value and Volume) 2024 & 2032
                                                                                                                                        193. Figure 193: Asia Pacific Rice Industry in India Revenue Share (%), by Import Analysis (Value and Volume) 2024 & 2032
                                                                                                                                        194. Figure 194: Asia Pacific Rice Industry in India Volume Share (%), by Import Analysis (Value and Volume) 2024 & 2032
                                                                                                                                        195. Figure 195: Asia Pacific Rice Industry in India Revenue (Million), by Export Analysis (Value and Volume) 2024 & 2032
                                                                                                                                        196. Figure 196: Asia Pacific Rice Industry in India Volume (Kiloton), by Export Analysis (Value and Volume) 2024 & 2032
                                                                                                                                        197. Figure 197: Asia Pacific Rice Industry in India Revenue Share (%), by Export Analysis (Value and Volume) 2024 & 2032
                                                                                                                                        198. Figure 198: Asia Pacific Rice Industry in India Volume Share (%), by Export Analysis (Value and Volume) 2024 & 2032
                                                                                                                                        199. Figure 199: Asia Pacific Rice Industry in India Revenue (Million), by Price Trend Analysis 2024 & 2032
                                                                                                                                        200. Figure 200: Asia Pacific Rice Industry in India Volume (Kiloton), by Price Trend Analysis 2024 & 2032
                                                                                                                                        201. Figure 201: Asia Pacific Rice Industry in India Revenue Share (%), by Price Trend Analysis 2024 & 2032
                                                                                                                                        202. Figure 202: Asia Pacific Rice Industry in India Volume Share (%), by Price Trend Analysis 2024 & 2032
                                                                                                                                        203. Figure 203: Asia Pacific Rice Industry in India Revenue (Million), by Production Analysis (Volume) 2024 & 2032
                                                                                                                                        204. Figure 204: Asia Pacific Rice Industry in India Volume (Kiloton), by Production Analysis (Volume) 2024 & 2032
                                                                                                                                        205. Figure 205: Asia Pacific Rice Industry in India Revenue Share (%), by Production Analysis (Volume) 2024 & 2032
                                                                                                                                        206. Figure 206: Asia Pacific Rice Industry in India Volume Share (%), by Production Analysis (Volume) 2024 & 2032
                                                                                                                                        207. Figure 207: Asia Pacific Rice Industry in India Revenue (Million), by Consumption Analysis (Value and Volume) 2024 & 2032
                                                                                                                                        208. Figure 208: Asia Pacific Rice Industry in India Volume (Kiloton), by Consumption Analysis (Value and Volume) 2024 & 2032
                                                                                                                                        209. Figure 209: Asia Pacific Rice Industry in India Revenue Share (%), by Consumption Analysis (Value and Volume) 2024 & 2032
                                                                                                                                        210. Figure 210: Asia Pacific Rice Industry in India Volume Share (%), by Consumption Analysis (Value and Volume) 2024 & 2032
                                                                                                                                        211. Figure 211: Asia Pacific Rice Industry in India Revenue (Million), by Import Analysis (Value and Volume) 2024 & 2032
                                                                                                                                        212. Figure 212: Asia Pacific Rice Industry in India Volume (Kiloton), by Import Analysis (Value and Volume) 2024 & 2032
                                                                                                                                        213. Figure 213: Asia Pacific Rice Industry in India Revenue Share (%), by Import Analysis (Value and Volume) 2024 & 2032
                                                                                                                                        214. Figure 214: Asia Pacific Rice Industry in India Volume Share (%), by Import Analysis (Value and Volume) 2024 & 2032
                                                                                                                                        215. Figure 215: Asia Pacific Rice Industry in India Revenue (Million), by Export Analysis (Value and Volume) 2024 & 2032
                                                                                                                                        216. Figure 216: Asia Pacific Rice Industry in India Volume (Kiloton), by Export Analysis (Value and Volume) 2024 & 2032
                                                                                                                                        217. Figure 217: Asia Pacific Rice Industry in India Revenue Share (%), by Export Analysis (Value and Volume) 2024 & 2032
                                                                                                                                        218. Figure 218: Asia Pacific Rice Industry in India Volume Share (%), by Export Analysis (Value and Volume) 2024 & 2032
                                                                                                                                        219. Figure 219: Asia Pacific Rice Industry in India Revenue (Million), by Price Trend Analysis 2024 & 2032
                                                                                                                                        220. Figure 220: Asia Pacific Rice Industry in India Volume (Kiloton), by Price Trend Analysis 2024 & 2032
                                                                                                                                        221. Figure 221: Asia Pacific Rice Industry in India Revenue Share (%), by Price Trend Analysis 2024 & 2032
                                                                                                                                        222. Figure 222: Asia Pacific Rice Industry in India Volume Share (%), by Price Trend Analysis 2024 & 2032
                                                                                                                                        223. Figure 223: Asia Pacific Rice Industry in India Revenue (Million), by Country 2024 & 2032
                                                                                                                                        224. Figure 224: Asia Pacific Rice Industry in India Volume (Kiloton), by Country 2024 & 2032
                                                                                                                                        225. Figure 225: Asia Pacific Rice Industry in India Revenue Share (%), by Country 2024 & 2032
                                                                                                                                        226. Figure 226: Asia Pacific Rice Industry in India Volume Share (%), by Country 2024 & 2032

                                                                                                                                        List of Tables

                                                                                                                                        1. Table 1: Global Rice Industry in India Revenue Million Forecast, by Region 2019 & 2032
                                                                                                                                        2. Table 2: Global Rice Industry in India Volume Kiloton Forecast, by Region 2019 & 2032
                                                                                                                                        3. Table 3: Global Rice Industry in India Revenue Million Forecast, by Production Analysis (Volume) 2019 & 2032
                                                                                                                                        4. Table 4: Global Rice Industry in India Volume Kiloton Forecast, by Production Analysis (Volume) 2019 & 2032
                                                                                                                                        5. Table 5: Global Rice Industry in India Revenue Million Forecast, by Consumption Analysis (Value and Volume) 2019 & 2032
                                                                                                                                        6. Table 6: Global Rice Industry in India Volume Kiloton Forecast, by Consumption Analysis (Value and Volume) 2019 & 2032
                                                                                                                                        7. Table 7: Global Rice Industry in India Revenue Million Forecast, by Import Analysis (Value and Volume) 2019 & 2032
                                                                                                                                        8. Table 8: Global Rice Industry in India Volume Kiloton Forecast, by Import Analysis (Value and Volume) 2019 & 2032
                                                                                                                                        9. Table 9: Global Rice Industry in India Revenue Million Forecast, by Export Analysis (Value and Volume) 2019 & 2032
                                                                                                                                        10. Table 10: Global Rice Industry in India Volume Kiloton Forecast, by Export Analysis (Value and Volume) 2019 & 2032
                                                                                                                                        11. Table 11: Global Rice Industry in India Revenue Million Forecast, by Price Trend Analysis 2019 & 2032
                                                                                                                                        12. Table 12: Global Rice Industry in India Volume Kiloton Forecast, by Price Trend Analysis 2019 & 2032
                                                                                                                                        13. Table 13: Global Rice Industry in India Revenue Million Forecast, by Production Analysis (Volume) 2019 & 2032
                                                                                                                                        14. Table 14: Global Rice Industry in India Volume Kiloton Forecast, by Production Analysis (Volume) 2019 & 2032
                                                                                                                                        15. Table 15: Global Rice Industry in India Revenue Million Forecast, by Consumption Analysis (Value and Volume) 2019 & 2032
                                                                                                                                        16. Table 16: Global Rice Industry in India Volume Kiloton Forecast, by Consumption Analysis (Value and Volume) 2019 & 2032
                                                                                                                                        17. Table 17: Global Rice Industry in India Revenue Million Forecast, by Import Analysis (Value and Volume) 2019 & 2032
                                                                                                                                        18. Table 18: Global Rice Industry in India Volume Kiloton Forecast, by Import Analysis (Value and Volume) 2019 & 2032
                                                                                                                                        19. Table 19: Global Rice Industry in India Revenue Million Forecast, by Export Analysis (Value and Volume) 2019 & 2032
                                                                                                                                        20. Table 20: Global Rice Industry in India Volume Kiloton Forecast, by Export Analysis (Value and Volume) 2019 & 2032
                                                                                                                                        21. Table 21: Global Rice Industry in India Revenue Million Forecast, by Price Trend Analysis 2019 & 2032
                                                                                                                                        22. Table 22: Global Rice Industry in India Volume Kiloton Forecast, by Price Trend Analysis 2019 & 2032
                                                                                                                                        23. Table 23: Global Rice Industry in India Revenue Million Forecast, by Region 2019 & 2032
                                                                                                                                        24. Table 24: Global Rice Industry in India Volume Kiloton Forecast, by Region 2019 & 2032
                                                                                                                                        25. Table 25: Global Rice Industry in India Revenue Million Forecast, by Country 2019 & 2032
                                                                                                                                        26. Table 26: Global Rice Industry in India Volume Kiloton Forecast, by Country 2019 & 2032
                                                                                                                                        27. Table 27: China Rice Industry in India Revenue (Million) Forecast, by Application 2019 & 2032
                                                                                                                                        28. Table 28: China Rice Industry in India Volume (Kiloton) Forecast, by Application 2019 & 2032
                                                                                                                                        29. Table 29: Japan Rice Industry in India Revenue (Million) Forecast, by Application 2019 & 2032
                                                                                                                                        30. Table 30: Japan Rice Industry in India Volume (Kiloton) Forecast, by Application 2019 & 2032
                                                                                                                                        31. Table 31: India Rice Industry in India Revenue (Million) Forecast, by Application 2019 & 2032
                                                                                                                                        32. Table 32: India Rice Industry in India Volume (Kiloton) Forecast, by Application 2019 & 2032
                                                                                                                                        33. Table 33: South Korea Rice Industry in India Revenue (Million) Forecast, by Application 2019 & 2032
                                                                                                                                        34. Table 34: South Korea Rice Industry in India Volume (Kiloton) Forecast, by Application 2019 & 2032
                                                                                                                                        35. Table 35: Taiwan Rice Industry in India Revenue (Million) Forecast, by Application 2019 & 2032
                                                                                                                                        36. Table 36: Taiwan Rice Industry in India Volume (Kiloton) Forecast, by Application 2019 & 2032
                                                                                                                                        37. Table 37: Australia Rice Industry in India Revenue (Million) Forecast, by Application 2019 & 2032
                                                                                                                                        38. Table 38: Australia Rice Industry in India Volume (Kiloton) Forecast, by Application 2019 & 2032
                                                                                                                                        39. Table 39: Rest of Asia-Pacific Rice Industry in India Revenue (Million) Forecast, by Application 2019 & 2032
                                                                                                                                        40. Table 40: Rest of Asia-Pacific Rice Industry in India Volume (Kiloton) Forecast, by Application 2019 & 2032
                                                                                                                                        41. Table 41: Global Rice Industry in India Revenue Million Forecast, by Production Analysis (Volume) 2019 & 2032
                                                                                                                                        42. Table 42: Global Rice Industry in India Volume Kiloton Forecast, by Production Analysis (Volume) 2019 & 2032
                                                                                                                                        43. Table 43: Global Rice Industry in India Revenue Million Forecast, by Consumption Analysis (Value and Volume) 2019 & 2032
                                                                                                                                        44. Table 44: Global Rice Industry in India Volume Kiloton Forecast, by Consumption Analysis (Value and Volume) 2019 & 2032
                                                                                                                                        45. Table 45: Global Rice Industry in India Revenue Million Forecast, by Import Analysis (Value and Volume) 2019 & 2032
                                                                                                                                        46. Table 46: Global Rice Industry in India Volume Kiloton Forecast, by Import Analysis (Value and Volume) 2019 & 2032
                                                                                                                                        47. Table 47: Global Rice Industry in India Revenue Million Forecast, by Export Analysis (Value and Volume) 2019 & 2032
                                                                                                                                        48. Table 48: Global Rice Industry in India Volume Kiloton Forecast, by Export Analysis (Value and Volume) 2019 & 2032
                                                                                                                                        49. Table 49: Global Rice Industry in India Revenue Million Forecast, by Price Trend Analysis 2019 & 2032
                                                                                                                                        50. Table 50: Global Rice Industry in India Volume Kiloton Forecast, by Price Trend Analysis 2019 & 2032
                                                                                                                                        51. Table 51: Global Rice Industry in India Revenue Million Forecast, by Production Analysis (Volume) 2019 & 2032
                                                                                                                                        52. Table 52: Global Rice Industry in India Volume Kiloton Forecast, by Production Analysis (Volume) 2019 & 2032
                                                                                                                                        53. Table 53: Global Rice Industry in India Revenue Million Forecast, by Consumption Analysis (Value and Volume) 2019 & 2032
                                                                                                                                        54. Table 54: Global Rice Industry in India Volume Kiloton Forecast, by Consumption Analysis (Value and Volume) 2019 & 2032
                                                                                                                                        55. Table 55: Global Rice Industry in India Revenue Million Forecast, by Import Analysis (Value and Volume) 2019 & 2032
                                                                                                                                        56. Table 56: Global Rice Industry in India Volume Kiloton Forecast, by Import Analysis (Value and Volume) 2019 & 2032
                                                                                                                                        57. Table 57: Global Rice Industry in India Revenue Million Forecast, by Export Analysis (Value and Volume) 2019 & 2032
                                                                                                                                        58. Table 58: Global Rice Industry in India Volume Kiloton Forecast, by Export Analysis (Value and Volume) 2019 & 2032
                                                                                                                                        59. Table 59: Global Rice Industry in India Revenue Million Forecast, by Price Trend Analysis 2019 & 2032
                                                                                                                                        60. Table 60: Global Rice Industry in India Volume Kiloton Forecast, by Price Trend Analysis 2019 & 2032
                                                                                                                                        61. Table 61: Global Rice Industry in India Revenue Million Forecast, by Country 2019 & 2032
                                                                                                                                        62. Table 62: Global Rice Industry in India Volume Kiloton Forecast, by Country 2019 & 2032
                                                                                                                                        63. Table 63: United States Rice Industry in India Revenue (Million) Forecast, by Application 2019 & 2032
                                                                                                                                        64. Table 64: United States Rice Industry in India Volume (Kiloton) Forecast, by Application 2019 & 2032
                                                                                                                                        65. Table 65: Canada Rice Industry in India Revenue (Million) Forecast, by Application 2019 & 2032
                                                                                                                                        66. Table 66: Canada Rice Industry in India Volume (Kiloton) Forecast, by Application 2019 & 2032
                                                                                                                                        67. Table 67: Mexico Rice Industry in India Revenue (Million) Forecast, by Application 2019 & 2032
                                                                                                                                        68. Table 68: Mexico Rice Industry in India Volume (Kiloton) Forecast, by Application 2019 & 2032
                                                                                                                                        69. Table 69: Global Rice Industry in India Revenue Million Forecast, by Production Analysis (Volume) 2019 & 2032
                                                                                                                                        70. Table 70: Global Rice Industry in India Volume Kiloton Forecast, by Production Analysis (Volume) 2019 & 2032
                                                                                                                                        71. Table 71: Global Rice Industry in India Revenue Million Forecast, by Consumption Analysis (Value and Volume) 2019 & 2032
                                                                                                                                        72. Table 72: Global Rice Industry in India Volume Kiloton Forecast, by Consumption Analysis (Value and Volume) 2019 & 2032
                                                                                                                                        73. Table 73: Global Rice Industry in India Revenue Million Forecast, by Import Analysis (Value and Volume) 2019 & 2032
                                                                                                                                        74. Table 74: Global Rice Industry in India Volume Kiloton Forecast, by Import Analysis (Value and Volume) 2019 & 2032
                                                                                                                                        75. Table 75: Global Rice Industry in India Revenue Million Forecast, by Export Analysis (Value and Volume) 2019 & 2032
                                                                                                                                        76. Table 76: Global Rice Industry in India Volume Kiloton Forecast, by Export Analysis (Value and Volume) 2019 & 2032
                                                                                                                                        77. Table 77: Global Rice Industry in India Revenue Million Forecast, by Price Trend Analysis 2019 & 2032
                                                                                                                                        78. Table 78: Global Rice Industry in India Volume Kiloton Forecast, by Price Trend Analysis 2019 & 2032
                                                                                                                                        79. Table 79: Global Rice Industry in India Revenue Million Forecast, by Production Analysis (Volume) 2019 & 2032
                                                                                                                                        80. Table 80: Global Rice Industry in India Volume Kiloton Forecast, by Production Analysis (Volume) 2019 & 2032
                                                                                                                                        81. Table 81: Global Rice Industry in India Revenue Million Forecast, by Consumption Analysis (Value and Volume) 2019 & 2032
                                                                                                                                        82. Table 82: Global Rice Industry in India Volume Kiloton Forecast, by Consumption Analysis (Value and Volume) 2019 & 2032
                                                                                                                                        83. Table 83: Global Rice Industry in India Revenue Million Forecast, by Import Analysis (Value and Volume) 2019 & 2032
                                                                                                                                        84. Table 84: Global Rice Industry in India Volume Kiloton Forecast, by Import Analysis (Value and Volume) 2019 & 2032
                                                                                                                                        85. Table 85: Global Rice Industry in India Revenue Million Forecast, by Export Analysis (Value and Volume) 2019 & 2032
                                                                                                                                        86. Table 86: Global Rice Industry in India Volume Kiloton Forecast, by Export Analysis (Value and Volume) 2019 & 2032
                                                                                                                                        87. Table 87: Global Rice Industry in India Revenue Million Forecast, by Price Trend Analysis 2019 & 2032
                                                                                                                                        88. Table 88: Global Rice Industry in India Volume Kiloton Forecast, by Price Trend Analysis 2019 & 2032
                                                                                                                                        89. Table 89: Global Rice Industry in India Revenue Million Forecast, by Country 2019 & 2032
                                                                                                                                        90. Table 90: Global Rice Industry in India Volume Kiloton Forecast, by Country 2019 & 2032
                                                                                                                                        91. Table 91: Brazil Rice Industry in India Revenue (Million) Forecast, by Application 2019 & 2032
                                                                                                                                        92. Table 92: Brazil Rice Industry in India Volume (Kiloton) Forecast, by Application 2019 & 2032
                                                                                                                                        93. Table 93: Argentina Rice Industry in India Revenue (Million) Forecast, by Application 2019 & 2032
                                                                                                                                        94. Table 94: Argentina Rice Industry in India Volume (Kiloton) Forecast, by Application 2019 & 2032
                                                                                                                                        95. Table 95: Rest of South America Rice Industry in India Revenue (Million) Forecast, by Application 2019 & 2032
                                                                                                                                        96. Table 96: Rest of South America Rice Industry in India Volume (Kiloton) Forecast, by Application 2019 & 2032
                                                                                                                                        97. Table 97: Global Rice Industry in India Revenue Million Forecast, by Production Analysis (Volume) 2019 & 2032
                                                                                                                                        98. Table 98: Global Rice Industry in India Volume Kiloton Forecast, by Production Analysis (Volume) 2019 & 2032
                                                                                                                                        99. Table 99: Global Rice Industry in India Revenue Million Forecast, by Consumption Analysis (Value and Volume) 2019 & 2032
                                                                                                                                        100. Table 100: Global Rice Industry in India Volume Kiloton Forecast, by Consumption Analysis (Value and Volume) 2019 & 2032
                                                                                                                                        101. Table 101: Global Rice Industry in India Revenue Million Forecast, by Import Analysis (Value and Volume) 2019 & 2032
                                                                                                                                        102. Table 102: Global Rice Industry in India Volume Kiloton Forecast, by Import Analysis (Value and Volume) 2019 & 2032
                                                                                                                                        103. Table 103: Global Rice Industry in India Revenue Million Forecast, by Export Analysis (Value and Volume) 2019 & 2032
                                                                                                                                        104. Table 104: Global Rice Industry in India Volume Kiloton Forecast, by Export Analysis (Value and Volume) 2019 & 2032
                                                                                                                                        105. Table 105: Global Rice Industry in India Revenue Million Forecast, by Price Trend Analysis 2019 & 2032
                                                                                                                                        106. Table 106: Global Rice Industry in India Volume Kiloton Forecast, by Price Trend Analysis 2019 & 2032
                                                                                                                                        107. Table 107: Global Rice Industry in India Revenue Million Forecast, by Production Analysis (Volume) 2019 & 2032
                                                                                                                                        108. Table 108: Global Rice Industry in India Volume Kiloton Forecast, by Production Analysis (Volume) 2019 & 2032
                                                                                                                                        109. Table 109: Global Rice Industry in India Revenue Million Forecast, by Consumption Analysis (Value and Volume) 2019 & 2032
                                                                                                                                        110. Table 110: Global Rice Industry in India Volume Kiloton Forecast, by Consumption Analysis (Value and Volume) 2019 & 2032
                                                                                                                                        111. Table 111: Global Rice Industry in India Revenue Million Forecast, by Import Analysis (Value and Volume) 2019 & 2032
                                                                                                                                        112. Table 112: Global Rice Industry in India Volume Kiloton Forecast, by Import Analysis (Value and Volume) 2019 & 2032
                                                                                                                                        113. Table 113: Global Rice Industry in India Revenue Million Forecast, by Export Analysis (Value and Volume) 2019 & 2032
                                                                                                                                        114. Table 114: Global Rice Industry in India Volume Kiloton Forecast, by Export Analysis (Value and Volume) 2019 & 2032
                                                                                                                                        115. Table 115: Global Rice Industry in India Revenue Million Forecast, by Price Trend Analysis 2019 & 2032
                                                                                                                                        116. Table 116: Global Rice Industry in India Volume Kiloton Forecast, by Price Trend Analysis 2019 & 2032
                                                                                                                                        117. Table 117: Global Rice Industry in India Revenue Million Forecast, by Country 2019 & 2032
                                                                                                                                        118. Table 118: Global Rice Industry in India Volume Kiloton Forecast, by Country 2019 & 2032
                                                                                                                                        119. Table 119: United Kingdom Rice Industry in India Revenue (Million) Forecast, by Application 2019 & 2032
                                                                                                                                        120. Table 120: United Kingdom Rice Industry in India Volume (Kiloton) Forecast, by Application 2019 & 2032
                                                                                                                                        121. Table 121: Germany Rice Industry in India Revenue (Million) Forecast, by Application 2019 & 2032
                                                                                                                                        122. Table 122: Germany Rice Industry in India Volume (Kiloton) Forecast, by Application 2019 & 2032
                                                                                                                                        123. Table 123: France Rice Industry in India Revenue (Million) Forecast, by Application 2019 & 2032
                                                                                                                                        124. Table 124: France Rice Industry in India Volume (Kiloton) Forecast, by Application 2019 & 2032
                                                                                                                                        125. Table 125: Italy Rice Industry in India Revenue (Million) Forecast, by Application 2019 & 2032
                                                                                                                                        126. Table 126: Italy Rice Industry in India Volume (Kiloton) Forecast, by Application 2019 & 2032
                                                                                                                                        127. Table 127: Spain Rice Industry in India Revenue (Million) Forecast, by Application 2019 & 2032
                                                                                                                                        128. Table 128: Spain Rice Industry in India Volume (Kiloton) Forecast, by Application 2019 & 2032
                                                                                                                                        129. Table 129: Russia Rice Industry in India Revenue (Million) Forecast, by Application 2019 & 2032
                                                                                                                                        130. Table 130: Russia Rice Industry in India Volume (Kiloton) Forecast, by Application 2019 & 2032
                                                                                                                                        131. Table 131: Benelux Rice Industry in India Revenue (Million) Forecast, by Application 2019 & 2032
                                                                                                                                        132. Table 132: Benelux Rice Industry in India Volume (Kiloton) Forecast, by Application 2019 & 2032
                                                                                                                                        133. Table 133: Nordics Rice Industry in India Revenue (Million) Forecast, by Application 2019 & 2032
                                                                                                                                        134. Table 134: Nordics Rice Industry in India Volume (Kiloton) Forecast, by Application 2019 & 2032
                                                                                                                                        135. Table 135: Rest of Europe Rice Industry in India Revenue (Million) Forecast, by Application 2019 & 2032
                                                                                                                                        136. Table 136: Rest of Europe Rice Industry in India Volume (Kiloton) Forecast, by Application 2019 & 2032
                                                                                                                                        137. Table 137: Global Rice Industry in India Revenue Million Forecast, by Production Analysis (Volume) 2019 & 2032
                                                                                                                                        138. Table 138: Global Rice Industry in India Volume Kiloton Forecast, by Production Analysis (Volume) 2019 & 2032
                                                                                                                                        139. Table 139: Global Rice Industry in India Revenue Million Forecast, by Consumption Analysis (Value and Volume) 2019 & 2032
                                                                                                                                        140. Table 140: Global Rice Industry in India Volume Kiloton Forecast, by Consumption Analysis (Value and Volume) 2019 & 2032
                                                                                                                                        141. Table 141: Global Rice Industry in India Revenue Million Forecast, by Import Analysis (Value and Volume) 2019 & 2032
                                                                                                                                        142. Table 142: Global Rice Industry in India Volume Kiloton Forecast, by Import Analysis (Value and Volume) 2019 & 2032
                                                                                                                                        143. Table 143: Global Rice Industry in India Revenue Million Forecast, by Export Analysis (Value and Volume) 2019 & 2032
                                                                                                                                        144. Table 144: Global Rice Industry in India Volume Kiloton Forecast, by Export Analysis (Value and Volume) 2019 & 2032
                                                                                                                                        145. Table 145: Global Rice Industry in India Revenue Million Forecast, by Price Trend Analysis 2019 & 2032
                                                                                                                                        146. Table 146: Global Rice Industry in India Volume Kiloton Forecast, by Price Trend Analysis 2019 & 2032
                                                                                                                                        147. Table 147: Global Rice Industry in India Revenue Million Forecast, by Production Analysis (Volume) 2019 & 2032
                                                                                                                                        148. Table 148: Global Rice Industry in India Volume Kiloton Forecast, by Production Analysis (Volume) 2019 & 2032
                                                                                                                                        149. Table 149: Global Rice Industry in India Revenue Million Forecast, by Consumption Analysis (Value and Volume) 2019 & 2032
                                                                                                                                        150. Table 150: Global Rice Industry in India Volume Kiloton Forecast, by Consumption Analysis (Value and Volume) 2019 & 2032
                                                                                                                                        151. Table 151: Global Rice Industry in India Revenue Million Forecast, by Import Analysis (Value and Volume) 2019 & 2032
                                                                                                                                        152. Table 152: Global Rice Industry in India Volume Kiloton Forecast, by Import Analysis (Value and Volume) 2019 & 2032
                                                                                                                                        153. Table 153: Global Rice Industry in India Revenue Million Forecast, by Export Analysis (Value and Volume) 2019 & 2032
                                                                                                                                        154. Table 154: Global Rice Industry in India Volume Kiloton Forecast, by Export Analysis (Value and Volume) 2019 & 2032
                                                                                                                                        155. Table 155: Global Rice Industry in India Revenue Million Forecast, by Price Trend Analysis 2019 & 2032
                                                                                                                                        156. Table 156: Global Rice Industry in India Volume Kiloton Forecast, by Price Trend Analysis 2019 & 2032
                                                                                                                                        157. Table 157: Global Rice Industry in India Revenue Million Forecast, by Country 2019 & 2032
                                                                                                                                        158. Table 158: Global Rice Industry in India Volume Kiloton Forecast, by Country 2019 & 2032
                                                                                                                                        159. Table 159: Turkey Rice Industry in India Revenue (Million) Forecast, by Application 2019 & 2032
                                                                                                                                        160. Table 160: Turkey Rice Industry in India Volume (Kiloton) Forecast, by Application 2019 & 2032
                                                                                                                                        161. Table 161: Israel Rice Industry in India Revenue (Million) Forecast, by Application 2019 & 2032
                                                                                                                                        162. Table 162: Israel Rice Industry in India Volume (Kiloton) Forecast, by Application 2019 & 2032
                                                                                                                                        163. Table 163: GCC Rice Industry in India Revenue (Million) Forecast, by Application 2019 & 2032
                                                                                                                                        164. Table 164: GCC Rice Industry in India Volume (Kiloton) Forecast, by Application 2019 & 2032
                                                                                                                                        165. Table 165: North Africa Rice Industry in India Revenue (Million) Forecast, by Application 2019 & 2032
                                                                                                                                        166. Table 166: North Africa Rice Industry in India Volume (Kiloton) Forecast, by Application 2019 & 2032
                                                                                                                                        167. Table 167: South Africa Rice Industry in India Revenue (Million) Forecast, by Application 2019 & 2032
                                                                                                                                        168. Table 168: South Africa Rice Industry in India Volume (Kiloton) Forecast, by Application 2019 & 2032
                                                                                                                                        169. Table 169: Rest of Middle East & Africa Rice Industry in India Revenue (Million) Forecast, by Application 2019 & 2032
                                                                                                                                        170. Table 170: Rest of Middle East & Africa Rice Industry in India Volume (Kiloton) Forecast, by Application 2019 & 2032
                                                                                                                                        171. Table 171: Global Rice Industry in India Revenue Million Forecast, by Production Analysis (Volume) 2019 & 2032
                                                                                                                                        172. Table 172: Global Rice Industry in India Volume Kiloton Forecast, by Production Analysis (Volume) 2019 & 2032
                                                                                                                                        173. Table 173: Global Rice Industry in India Revenue Million Forecast, by Consumption Analysis (Value and Volume) 2019 & 2032
                                                                                                                                        174. Table 174: Global Rice Industry in India Volume Kiloton Forecast, by Consumption Analysis (Value and Volume) 2019 & 2032
                                                                                                                                        175. Table 175: Global Rice Industry in India Revenue Million Forecast, by Import Analysis (Value and Volume) 2019 & 2032
                                                                                                                                        176. Table 176: Global Rice Industry in India Volume Kiloton Forecast, by Import Analysis (Value and Volume) 2019 & 2032
                                                                                                                                        177. Table 177: Global Rice Industry in India Revenue Million Forecast, by Export Analysis (Value and Volume) 2019 & 2032
                                                                                                                                        178. Table 178: Global Rice Industry in India Volume Kiloton Forecast, by Export Analysis (Value and Volume) 2019 & 2032
                                                                                                                                        179. Table 179: Global Rice Industry in India Revenue Million Forecast, by Price Trend Analysis 2019 & 2032
                                                                                                                                        180. Table 180: Global Rice Industry in India Volume Kiloton Forecast, by Price Trend Analysis 2019 & 2032
                                                                                                                                        181. Table 181: Global Rice Industry in India Revenue Million Forecast, by Production Analysis (Volume) 2019 & 2032
                                                                                                                                        182. Table 182: Global Rice Industry in India Volume Kiloton Forecast, by Production Analysis (Volume) 2019 & 2032
                                                                                                                                        183. Table 183: Global Rice Industry in India Revenue Million Forecast, by Consumption Analysis (Value and Volume) 2019 & 2032
                                                                                                                                        184. Table 184: Global Rice Industry in India Volume Kiloton Forecast, by Consumption Analysis (Value and Volume) 2019 & 2032
                                                                                                                                        185. Table 185: Global Rice Industry in India Revenue Million Forecast, by Import Analysis (Value and Volume) 2019 & 2032
                                                                                                                                        186. Table 186: Global Rice Industry in India Volume Kiloton Forecast, by Import Analysis (Value and Volume) 2019 & 2032
                                                                                                                                        187. Table 187: Global Rice Industry in India Revenue Million Forecast, by Export Analysis (Value and Volume) 2019 & 2032
                                                                                                                                        188. Table 188: Global Rice Industry in India Volume Kiloton Forecast, by Export Analysis (Value and Volume) 2019 & 2032
                                                                                                                                        189. Table 189: Global Rice Industry in India Revenue Million Forecast, by Price Trend Analysis 2019 & 2032
                                                                                                                                        190. Table 190: Global Rice Industry in India Volume Kiloton Forecast, by Price Trend Analysis 2019 & 2032
                                                                                                                                        191. Table 191: Global Rice Industry in India Revenue Million Forecast, by Country 2019 & 2032
                                                                                                                                        192. Table 192: Global Rice Industry in India Volume Kiloton Forecast, by Country 2019 & 2032
                                                                                                                                        193. Table 193: China Rice Industry in India Revenue (Million) Forecast, by Application 2019 & 2032
                                                                                                                                        194. Table 194: China Rice Industry in India Volume (Kiloton) Forecast, by Application 2019 & 2032
                                                                                                                                        195. Table 195: India Rice Industry in India Revenue (Million) Forecast, by Application 2019 & 2032
                                                                                                                                        196. Table 196: India Rice Industry in India Volume (Kiloton) Forecast, by Application 2019 & 2032
                                                                                                                                        197. Table 197: Japan Rice Industry in India Revenue (Million) Forecast, by Application 2019 & 2032
                                                                                                                                        198. Table 198: Japan Rice Industry in India Volume (Kiloton) Forecast, by Application 2019 & 2032
                                                                                                                                        199. Table 199: South Korea Rice Industry in India Revenue (Million) Forecast, by Application 2019 & 2032
                                                                                                                                        200. Table 200: South Korea Rice Industry in India Volume (Kiloton) Forecast, by Application 2019 & 2032
                                                                                                                                        201. Table 201: ASEAN Rice Industry in India Revenue (Million) Forecast, by Application 2019 & 2032
                                                                                                                                        202. Table 202: ASEAN Rice Industry in India Volume (Kiloton) Forecast, by Application 2019 & 2032
                                                                                                                                        203. Table 203: Oceania Rice Industry in India Revenue (Million) Forecast, by Application 2019 & 2032
                                                                                                                                        204. Table 204: Oceania Rice Industry in India Volume (Kiloton) Forecast, by Application 2019 & 2032
                                                                                                                                        205. Table 205: Rest of Asia Pacific Rice Industry in India Revenue (Million) Forecast, by Application 2019 & 2032
                                                                                                                                        206. Table 206: Rest of Asia Pacific Rice Industry in India Volume (Kiloton) Forecast, by Application 2019 & 2032


                                                                                                                                        Frequently Asked Questions

                                                                                                                                        1. What is the projected Compound Annual Growth Rate (CAGR) of the Rice Industry in India?

                                                                                                                                        The projected CAGR is approximately 2.40%.

                                                                                                                                        2. Which companies are prominent players in the Rice Industry in India?

                                                                                                                                        Key companies in the market include Hayagriva Organics , Royal Basmati Rice , LT Foods (Daawat, Royal), KRBL (India Gate), Kohinoor Foods, Chaman Lal Setia Exports, Amira Nature Foods.

                                                                                                                                        3. What are the main segments of the Rice Industry in India?

                                                                                                                                        The market segments include Production Analysis (Volume), Consumption Analysis (Value and Volume), Import Analysis (Value and Volume), Export Analysis (Value and Volume), Price Trend Analysis, Production Analysis (Volume), Consumption Analysis (Value and Volume), Import Analysis (Value and Volume), Export Analysis (Value and Volume), Price Trend Analysis.

                                                                                                                                        4. Can you provide details about the market size?

                                                                                                                                        The market size is estimated to be USD 52.82 Million as of 2022.

                                                                                                                                        5. What are some drivers contributing to market growth?

                                                                                                                                        Increasing Demand for Indian Rice; Enhancing Production Capacities; Increasing Government Initiatives.

                                                                                                                                        6. What are the notable trends driving market growth?

                                                                                                                                        Increasing Demand for Indian Rice.

                                                                                                                                        7. Are there any restraints impacting market growth?

                                                                                                                                        Abiotic and Biotic Stresses in Rice Cultivation; High Market Entry Costs.

                                                                                                                                        8. Can you provide examples of recent developments in the market?

                                                                                                                                        June 2024: The Acharya N.G. Ranga Agricultural University released rice varieties suitable for Andhra Pradesh. The varieties are MTU 1271, BPT 2846, BPT 2841, and NLR 3238. The new varieties are high-yielding and resistant to various pests and diseases.

                                                                                                                                        9. What pricing options are available for accessing the report?

                                                                                                                                        Pricing options include single-user, multi-user, and enterprise licenses priced at USD 3800, USD 4500, and USD 5800 respectively.

                                                                                                                                        10. Is the market size provided in terms of value or volume?

                                                                                                                                        The market size is provided in terms of value, measured in Million and volume, measured in Kiloton.

                                                                                                                                        11. Are there any specific market keywords associated with the report?

                                                                                                                                        Yes, the market keyword associated with the report is "Rice Industry in India," which aids in identifying and referencing the specific market segment covered.

                                                                                                                                        12. How do I determine which pricing option suits my needs best?

                                                                                                                                        The pricing options vary based on user requirements and access needs. Individual users may opt for single-user licenses, while businesses requiring broader access may choose multi-user or enterprise licenses for cost-effective access to the report.

                                                                                                                                        13. Are there any additional resources or data provided in the Rice Industry in India report?

                                                                                                                                        While the report offers comprehensive insights, it's advisable to review the specific contents or supplementary materials provided to ascertain if additional resources or data are available.

                                                                                                                                        14. How can I stay updated on further developments or reports in the Rice Industry in India?

                                                                                                                                        To stay informed about further developments, trends, and reports in the Rice Industry in India, consider subscribing to industry newsletters, following relevant companies and organizations, or regularly checking reputable industry news sources and publications.


                                                                                                                                        Methodology

                                                                                                                                        Step 1 - Identification of Relevant Samples Size from Population Database

                                                                                                                                        Step Chart
                                                                                                                                        Bar Chart
                                                                                                                                        Method Chart

                                                                                                                                        Step 2 - Approaches for Defining Global Market Size (Value, Volume* & Price*)

                                                                                                                                        Approach Chart
                                                                                                                                        Top-down and bottom-up approaches are used to validate the global market size and estimate the market size for manufactures, regional segments, product, and application.

                                                                                                                                        Note*: In applicable scenarios

                                                                                                                                        Step 3 - Data Sources

                                                                                                                                        Primary Research

                                                                                                                                        • Web Analytics
                                                                                                                                        • Survey Reports
                                                                                                                                        • Research Institute
                                                                                                                                        • Latest Research Reports
                                                                                                                                        • Opinion Leaders

                                                                                                                                        Secondary Research

                                                                                                                                        • Annual Reports
                                                                                                                                        • White Paper
                                                                                                                                        • Latest Press Release
                                                                                                                                        • Industry Association
                                                                                                                                        • Paid Database
                                                                                                                                        • Investor Presentations
                                                                                                                                        Analyst Chart

                                                                                                                                        Step 4 - Data Triangulation

                                                                                                                                        Involves using different sources of information in order to increase the validity of a study

                                                                                                                                        These sources are likely to be stakeholders in a program - participants, other researchers, program staff, other community members, and so on.

                                                                                                                                        Then we put all data in single framework & apply various statistical tools to find out the dynamic on the market.

                                                                                                                                        During the analysis stage, feedback from the stakeholder groups would be compared to determine areas of agreement as well as areas of divergence

                                                                                                                                        Additionally, after gathering mixed and scattered data from a wide range of sources, data is triangulated and correlated to come up with estimated figures which are further validated through primary mediums or industry experts, opinion leaders.

                                                                                                                                        About Research Axiom

                                                                                                                                        Research Axiom delivers in-depth market research, industry analysis, and consulting for pharmaceuticals, automotive, IT, and consumer goods. Our reports provide the clarity you need to make informed decisions and drive innovation.

                                                                                                                                        Our team combines primary research, advanced analytics, and sector expertise to deliver actionable intelligence. We offer syndicated reports, custom research, and consulting services tailored to your business needs.

                                                                                                                                        At Research Axiom, we are committed to quality, transparency, and client satisfaction. Every report is rigorously validated to ensure accuracy and relevance. Our global perspective and local expertise help you understand both the big picture and the finer details of your market.

                                                                                                                                        Stay informed with Research Axiom. Subscribe to our newsletter for the latest updates and research highlights, and follow us on social media for real-time insights. Research Axiom – Turning Data into Business Advantage.

                                                                                                                                        artwork spiralartwork spiralRelated Reports
                                                                                                                                        artwork underline

                                                                                                                                        Strategic Planning for North America Agricultural Irrigation Machinery Market Industry Expansion

                                                                                                                                        Discover the booming North American agricultural irrigation machinery market. This in-depth analysis reveals a 5.10% CAGR, driven by water scarcity, precision agriculture, and smart irrigation technology. Learn about key players, market trends, and future projections for 2025-2033.

                                                                                                                                        July 2025
                                                                                                                                        Base Year: 2024
                                                                                                                                        No Of Pages: 234
                                                                                                                                        Price: $4750

                                                                                                                                        Qatar Aquaculture and Fisheries Market Analysis Uncovered: Market Drivers and Forecasts 2025-2033

                                                                                                                                        Discover the booming Qatar aquaculture and fisheries market, projected to reach \$252.74 million by 2033 with a 5% CAGR. This in-depth analysis covers market size, key players (Al-Khaleej Seafoods, Al Rayan Shrimp Trading), segments (pelagic fish, shrimp, caviar), and future growth drivers.

                                                                                                                                        July 2025
                                                                                                                                        Base Year: 2024
                                                                                                                                        No Of Pages: 150
                                                                                                                                        Price: $3800

                                                                                                                                        U.S. Maize Industry Market Trends and Strategic Roadmap

                                                                                                                                        Discover the dynamic U.S. maize industry outlook with our comprehensive market analysis. Explore key trends, regional breakdowns, and leading companies shaping this multi-billion dollar sector. Projecting steady growth through 2033, understand the factors driving expansion and the challenges ahead for maize producers and stakeholders.

                                                                                                                                        July 2025
                                                                                                                                        Base Year: 2024
                                                                                                                                        No Of Pages: 180
                                                                                                                                        Price: $3800

                                                                                                                                        Alfalfa Hay Market in Italy Future-proof Strategies: Trends, Competitor Dynamics, and Opportunities 2025-2033

                                                                                                                                        Discover the latest insights into Italy's thriving alfalfa hay market. Explore market size, CAGR, key drivers, trends, and competitive landscape analysis for 2025-2033. Learn about segment growth in bales, pellets, and cubes across animal feed applications.

                                                                                                                                        July 2025
                                                                                                                                        Base Year: 2024
                                                                                                                                        No Of Pages: 150
                                                                                                                                        Price: $3800

                                                                                                                                        India Biopesticides Industry Market Disruption: Competitor Insights and Trends 2025-2033

                                                                                                                                        The India biopesticides market is booming, projected to reach ₹237.3 Billion (USD 2847.6 million) by 2033, driven by growing demand for sustainable agriculture and stricter regulations. Learn about key market trends, leading companies, and regional growth forecasts in this comprehensive analysis.

                                                                                                                                        July 2025
                                                                                                                                        Base Year: 2024
                                                                                                                                        No Of Pages: 197
                                                                                                                                        Price: $3800

                                                                                                                                        Decoding Almond Market Consumer Preferences 2025-2033

                                                                                                                                        Discover the booming almond market! Explore its $10.12B valuation (2025), 5.55% CAGR, key drivers, trends, and regional insights. Learn about leading companies and diverse product types including almond butter, flour, and oil. Uncover future growth projections for the almond industry until 2033.

                                                                                                                                        July 2025
                                                                                                                                        Base Year: 2024
                                                                                                                                        No Of Pages: 234
                                                                                                                                        Price: $4750

                                                                                                                                        Bio Organic Fertilizer Market Insightful Market Analysis: Trends and Opportunities 2025-2033

                                                                                                                                        The global bio organic fertilizer market is booming, projected to reach [estimated 2033 value] by 2033 with a CAGR of 5.90%. Discover key market trends, drivers, restraints, and leading companies shaping this sustainable agriculture sector. Learn more about organic fertilizer types, applications, and regional market analysis.

                                                                                                                                        July 2025
                                                                                                                                        Base Year: 2024
                                                                                                                                        No Of Pages: 150
                                                                                                                                        Price: $4750

                                                                                                                                        Exploring Saudi Arabia Agriculture Market’s Market Size Dynamics 2025-2033

                                                                                                                                        Discover the booming Saudi Arabia agriculture market! Projected to reach \$28.3 billion by 2033 with a 5.2% CAGR, this report analyzes market size, key players (Carrefour, Lulu Group), regional trends, and growth drivers. Learn about opportunities and challenges in this dynamic sector.

                                                                                                                                        July 2025
                                                                                                                                        Base Year: 2024
                                                                                                                                        No Of Pages: 197
                                                                                                                                        Price: $3800

                                                                                                                                        Lentil Industry Charting Growth Trajectories 2025-2033: Strategic Insights and Forecasts

                                                                                                                                        Discover the booming lentil market! Explore key trends, regional insights, and leading companies driving growth in this $X billion industry (2025 estimate) projected to reach $X billion by 2033. Learn about the rising demand for whole, split, and dehulled lentils in dry, canned, and frozen forms. Get the complete market analysis now!

                                                                                                                                        July 2025
                                                                                                                                        Base Year: 2024
                                                                                                                                        No Of Pages: 234
                                                                                                                                        Price: $4750

                                                                                                                                        USA Agricultural Irrigation Machinery Market Soars to XXX Million, witnessing a CAGR of XX during the forecast period 2025-2033

                                                                                                                                        Discover the booming US agricultural irrigation machinery market! This in-depth analysis reveals key trends, growth drivers, and leading companies from 2025-2033. Learn about the impact of precision agriculture, water scarcity, and government initiatives on the market's future. Explore segments like drip, sprinkler, and pivot irrigation systems.

                                                                                                                                        July 2025
                                                                                                                                        Base Year: 2024
                                                                                                                                        No Of Pages: 150
                                                                                                                                        Price: $3800

                                                                                                                                        South America Biological Organic Fertilizers Industry 2025 to Grow at XX CAGR with XXX Million Market Size: Analysis and Forecasts 2033

                                                                                                                                        Discover the booming South American biological organic fertilizer market! Projected to reach [estimated 2033 value based on CAGR] by 2033, this market is driven by sustainable agriculture trends and growing demand for eco-friendly farming. Learn about key players, market segments (cereals, legumes, fruits & vegetables), and growth opportunities in Brazil, Argentina, and beyond.

                                                                                                                                        July 2025
                                                                                                                                        Base Year: 2024
                                                                                                                                        No Of Pages: 150
                                                                                                                                        Price: $4750

                                                                                                                                        Exploring Barriers in North American Olives Market Market: Trends and Analysis 2025-2033

                                                                                                                                        Discover the booming North American olives market! This comprehensive analysis reveals a $6.9B market with a 5.74% CAGR (2025-2033), driven by health trends & Mediterranean diet popularity. Explore market segmentation, key players (Napa Valley Olive Oil, Musco Family Olive Co., etc.), and future growth projections for olive oil, table olives, and more.

                                                                                                                                        July 2025
                                                                                                                                        Base Year: 2024
                                                                                                                                        No Of Pages: 180
                                                                                                                                        Price: $4750

                                                                                                                                        Analyzing Competitor Moves: Iran Agricultural Sector Analysis Growth Outlook 2025-2033

                                                                                                                                        Discover the growth opportunities and challenges within Iran's agricultural sector. This comprehensive analysis covers market size, CAGR, key drivers, trends, and regional variations across food crops, cash crops, fruits, vegetables, dairy, and fishery from 2019-2033. Gain valuable insights into this dynamic market.

                                                                                                                                        July 2025
                                                                                                                                        Base Year: 2024
                                                                                                                                        No Of Pages: 150
                                                                                                                                        Price: $3800

                                                                                                                                        South America Agricultual Films Market Market’s Drivers and Challenges: Strategic Overview 2025-2033

                                                                                                                                        Discover the booming South American agricultural films market! This in-depth analysis reveals a CAGR of 6.10% to 2033, driven by growing demand for modern farming techniques and food security. Explore key trends, leading companies (Dow, Agroflex, etc.), and regional insights for Brazil, Argentina, and beyond. Learn how this expanding market presents lucrative opportunities.

                                                                                                                                        July 2025
                                                                                                                                        Base Year: 2024
                                                                                                                                        No Of Pages: 150
                                                                                                                                        Price: $4750

                                                                                                                                        Analyzing Coffee Trade Analysis Industry: Opportunities and Growth Patterns 2025-2033

                                                                                                                                        Discover the latest insights into the booming global coffee trade market. This comprehensive analysis reveals key trends, growth drivers, and market segmentation for Arabica, Robusta, and various coffee processing methods. Explore regional market shares and leading companies like Starbucks & Nestlé. Project your business strategy with our 2025-2033 forecast.

                                                                                                                                        July 2025
                                                                                                                                        Base Year: 2024
                                                                                                                                        No Of Pages: 150
                                                                                                                                        Price: $4750

                                                                                                                                        Kiwi Fruit Market Insightful Market Analysis: Trends and Opportunities 2025-2033

                                                                                                                                        Discover the booming kiwi fruit market! This comprehensive analysis reveals a $1.89B market in 2025, projected to reach significant heights by 2033 with a 5.02% CAGR. Explore key drivers, regional trends, and leading companies shaping this dynamic industry.

                                                                                                                                        July 2025
                                                                                                                                        Base Year: 2024
                                                                                                                                        No Of Pages: 180
                                                                                                                                        Price: $4750

                                                                                                                                        Africa Chia Seeds Industry: Growth Opportunities and Competitive Landscape Overview 2025-2033

                                                                                                                                        Discover the booming Africa chia seeds market! Explore its $13.87M valuation (2025), 2.10% CAGR, key segments (organic, food & beverage, supplements), and leading companies. Learn about growth drivers, trends, and regional insights (South Africa, UAE) in this comprehensive market analysis.

                                                                                                                                        July 2025
                                                                                                                                        Base Year: 2024
                                                                                                                                        No Of Pages: 180
                                                                                                                                        Price: $4750

                                                                                                                                        China Pesticide Industry Market Report: Strategic Insights

                                                                                                                                        Discover the booming China pesticide market, projected to reach $XX million by 2025 and grow at a CAGR of 6.60% until 2033. Analyze key trends, leading companies (Bayer, Syngenta, UPL), and market segmentation (fungicides, herbicides, insecticides, etc.) impacting this dynamic sector.

                                                                                                                                        July 2025
                                                                                                                                        Base Year: 2024
                                                                                                                                        No Of Pages: 197
                                                                                                                                        Price: $3800

                                                                                                                                        Global Metal Chelates Market Future-proof Strategies: Trends, Competitor Dynamics, and Opportunities 2025-2033

                                                                                                                                        Discover the booming global metal chelates market! This comprehensive analysis reveals a CAGR of 10.20%, driven by surging demand for efficient micronutrient delivery in agriculture. Explore market size, segmentation (crop type, product type, application), key players, and regional trends for 2025-2033.

                                                                                                                                        July 2025
                                                                                                                                        Base Year: 2024
                                                                                                                                        No Of Pages: 197
                                                                                                                                        Price: $3800

                                                                                                                                        Fresh Cherries Industry CAGR Trends: Growth Outlook 2025-2033

                                                                                                                                        Discover the booming fresh cherries market! This in-depth analysis reveals key trends, drivers, and restraints, along with regional market share data and projections to 2033. Learn about leading companies and explore growth opportunities in this lucrative sector.

                                                                                                                                        July 2025
                                                                                                                                        Base Year: 2024
                                                                                                                                        No Of Pages: 180
                                                                                                                                        Price: $4750
                                                                                                                                        • Home
                                                                                                                                        • About Us
                                                                                                                                        • Industries
                                                                                                                                          • Aerospace & Defense
                                                                                                                                          • Agriculture
                                                                                                                                          • Animal Nutrition & Wellness
                                                                                                                                          • Automotive
                                                                                                                                          • Chemicals & Materials
                                                                                                                                          • Consumer Goods and Services
                                                                                                                                          • Energy & Power
                                                                                                                                          • Financial Services and Investment Intelligence
                                                                                                                                          • Food & Beverage
                                                                                                                                          • Home and Property Improvement
                                                                                                                                          • Hospitality and Tourism
                                                                                                                                          • Logistics
                                                                                                                                          • Manufacturing Products and Services
                                                                                                                                          • Packaging
                                                                                                                                          • Professional and Commercial Services
                                                                                                                                          • Real Estate and Construction
                                                                                                                                          • Retail
                                                                                                                                          • Technology, Media and Telecom
                                                                                                                                          • Healthcare
                                                                                                                                        • Services
                                                                                                                                        • Contact
                                                                                                                                        Main Logo
                                                                                                                                        • Home
                                                                                                                                        • About Us
                                                                                                                                        • Industries
                                                                                                                                          • Aerospace & Defense
                                                                                                                                          • Agriculture
                                                                                                                                          • Animal Nutrition & Wellness
                                                                                                                                          • Automotive
                                                                                                                                          • Chemicals & Materials
                                                                                                                                          • Consumer Goods and Services
                                                                                                                                          • Energy & Power
                                                                                                                                          • Financial Services and Investment Intelligence
                                                                                                                                          • Food & Beverage
                                                                                                                                          • Home and Property Improvement
                                                                                                                                          • Hospitality and Tourism
                                                                                                                                          • Logistics
                                                                                                                                          • Manufacturing Products and Services
                                                                                                                                          • Packaging
                                                                                                                                          • Professional and Commercial Services
                                                                                                                                          • Real Estate and Construction
                                                                                                                                          • Retail
                                                                                                                                          • Technology, Media and Telecom
                                                                                                                                          • Healthcare
                                                                                                                                        • Services
                                                                                                                                        • Contact
                                                                                                                                        +17162654855
                                                                                                                                        [email protected]

                                                                                                                                        +17162654855

                                                                                                                                        [email protected]

                                                                                                                                        Business Address

                                                                                                                                        Head Office

                                                                                                                                        Office no. A 5010, fifth floor, Solitaire Business Hub, Near Phoenix mall, Pune, Maharashtra 411014

                                                                                                                                        Contact Information

                                                                                                                                        Craig Francis

                                                                                                                                        Business Development Head

                                                                                                                                        +17162654855

                                                                                                                                        [email protected]

                                                                                                                                        Connect With Us

                                                                                                                                        Secure Payment Partners

                                                                                                                                        payment image
                                                                                                                                        RetailLogisticsPackagingAutomotiveHealthcareAgricultureEnergy & PowerFood & BeverageAerospace & DefenseChemicals & MaterialsHospitality and TourismAnimal Nutrition & WellnessConsumer Goods and ServicesReal Estate and ConstructionHome and Property ImprovementTechnology, Media and TelecomManufacturing Products and ServicesFinancial Services and Investment Intelligence

                                                                                                                                        © 2025 All rights reserved


                                                                                                                                        Privacy Policy
                                                                                                                                        Terms and Conditions
                                                                                                                                        FAQ