
Key Insights
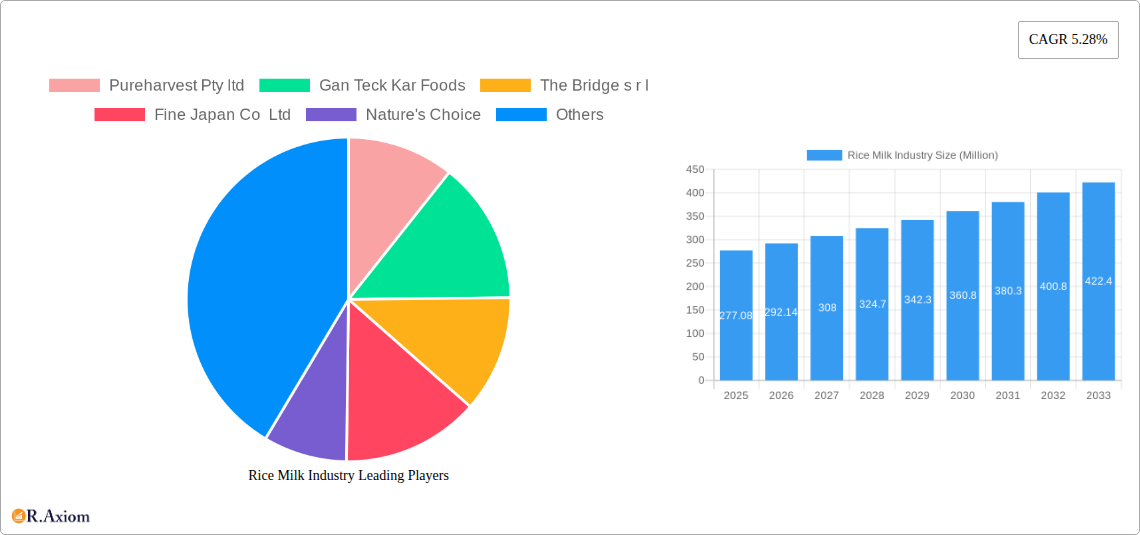
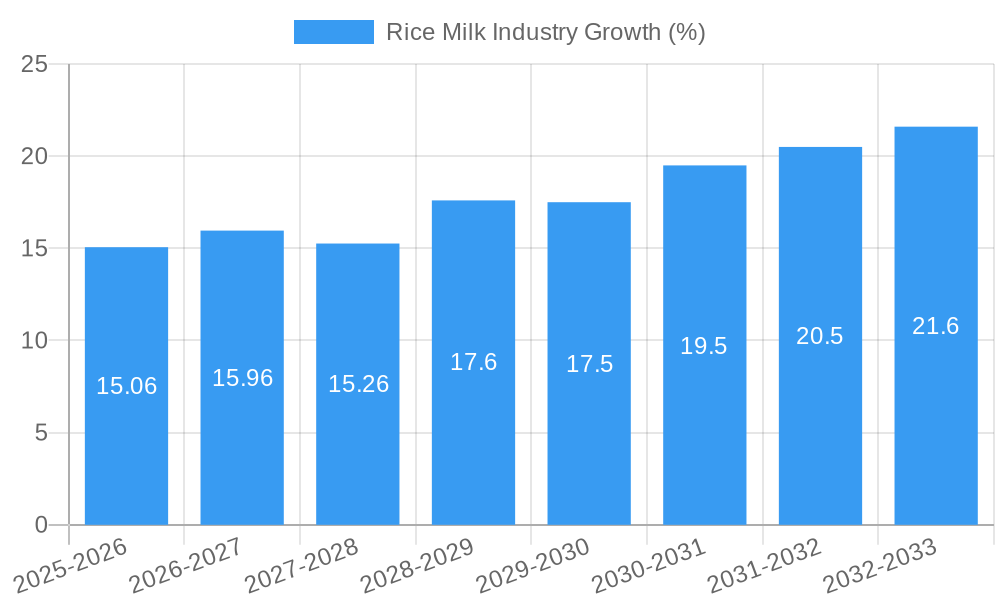
The global rice milk market, valued at $277.08 million in 2025, is projected to experience robust growth, driven by a compound annual growth rate (CAGR) of 5.28% from 2025 to 2033. This expansion is fueled by several key factors. The increasing consumer preference for plant-based alternatives to dairy milk, driven by health consciousness, lactose intolerance, and ethical concerns regarding animal agriculture, is a significant driver. Growing awareness of the nutritional benefits of rice milk, such as its low-fat content and hypoallergenic properties, further boosts demand. The market is witnessing innovation in product formats, with the introduction of flavored varieties, fortified options enriched with vitamins and minerals, and convenient ready-to-drink packages catering to diverse consumer preferences. Furthermore, the expanding distribution channels, encompassing supermarkets, convenience stores, online retailers, and specialty food stores, ensure widespread product availability, contributing to market growth. Organic rice milk is also gaining traction, reflecting the increasing demand for naturally produced and sustainably sourced food products.
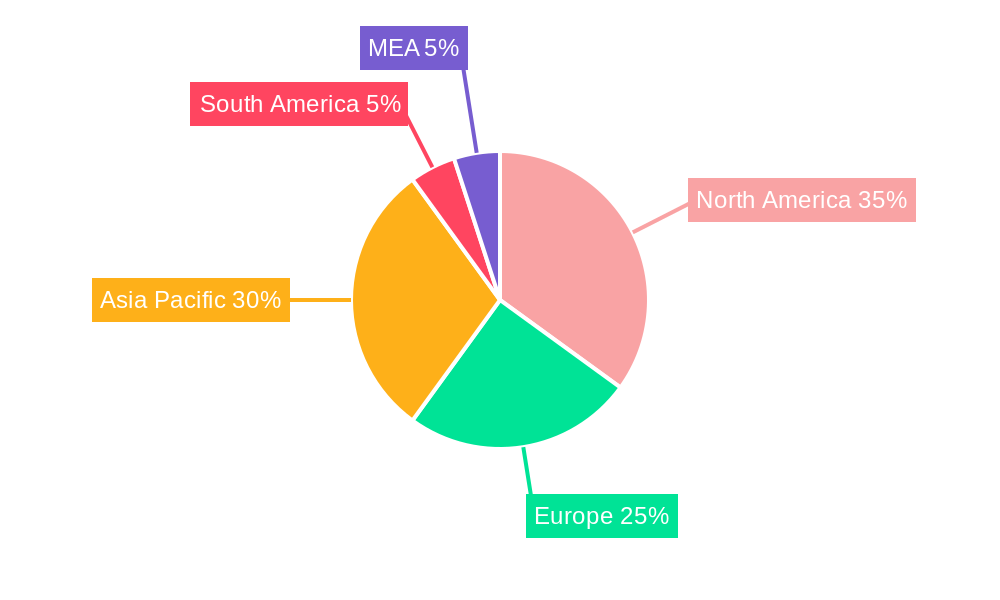
However, certain factors might restrain market growth. Fluctuations in raw material prices, particularly rice, can impact profitability and product pricing. Intense competition from other plant-based milk alternatives, such as almond milk and soy milk, poses a challenge. Consumer perception regarding the relatively lower protein content of rice milk compared to other alternatives could also influence purchase decisions. Overcoming these challenges requires manufacturers to focus on product innovation, sustainable sourcing, strategic pricing, and effective marketing strategies that emphasize the unique health benefits and versatility of rice milk. Regional differences in consumption patterns will also influence market dynamics, with North America and Asia Pacific anticipated to be key growth regions given existing consumer trends and established market presence.
Rice Milk Industry: A Comprehensive Market Report (2019-2033)
This detailed report provides a comprehensive analysis of the global rice milk industry, offering invaluable insights for stakeholders, investors, and industry professionals. The report covers the period from 2019 to 2033, with a focus on the base year 2025 and a forecast period spanning 2025-2033. The historical period analyzed is 2019-2024. The market size is estimated to be xx Million in 2025 and is expected to reach xx Million by 2033.
Rice Milk Industry Market Concentration & Innovation
This section analyzes the competitive landscape of the rice milk industry, including market concentration, innovation drivers, regulatory frameworks, product substitutes, end-user trends, and mergers & acquisitions (M&A) activities. The global rice milk market is moderately concentrated, with several key players holding significant market share. However, the market is also witnessing the emergence of numerous smaller players, particularly in the organic and specialty segments.
- Market Share: The top 5 players account for approximately xx% of the global market share in 2025. Pureharvest Pty ltd, Gan Teck Kar Foods, and Vitasoy Australia Products Pty Ltd are projected to be amongst the leading players. Exact market share figures for each company will be detailed in the full report.
- Innovation Drivers: Growing consumer demand for plant-based alternatives, increasing health consciousness, and the development of new product formulations (e.g., flavored rice milk, barista blends) are key innovation drivers.
- Regulatory Frameworks: Government regulations regarding labeling, food safety, and organic certification impact the industry. Variations in regulations across different regions influence market dynamics.
- Product Substitutes: Other plant-based milks (soy, oat, almond) represent the primary substitutes for rice milk. Competition is intense, requiring continuous product innovation to maintain market share.
- End-User Trends: Consumers are increasingly seeking convenient, healthier, and ethically sourced food options, driving demand for organic and sustainably produced rice milk.
- M&A Activities: The rice milk market has witnessed several significant M&A activities in recent years, such as the April 2021 acquisition of Hain Celestial Group's North America non-dairy beverages brands by SunOpta Inc. These activities reshape the market landscape and intensify competition. The total value of M&A deals in the rice milk industry between 2019 and 2024 is estimated at xx Million.
Rice Milk Industry Industry Trends & Insights
This section delves into the key trends and insights shaping the rice milk industry. The market is experiencing robust growth, driven by factors such as the rising adoption of plant-based diets, increasing health consciousness among consumers, and the growing popularity of veganism. Technological advancements in processing and packaging are enhancing the quality, shelf life, and convenience of rice milk products.
The CAGR for the rice milk industry is projected to be xx% during the forecast period (2025-2033), with market penetration increasing significantly in developing economies. Consumer preference is shifting towards organic and sustainably sourced rice milk, creating opportunities for producers that prioritize ethical and environmentally friendly practices. Intense competition necessitates continuous product innovation and effective marketing strategies to maintain a strong market presence.
Dominant Markets & Segments in Rice Milk Industry
This section identifies the leading regions, countries, and market segments within the rice milk industry. The Asia-Pacific region is expected to dominate the market due to high rice consumption, growing veganism, and increasing disposable incomes.
- Form: Fluid rice milk currently holds the largest market share, followed by powder rice milk.
- Source: The demand for organic rice milk is growing rapidly due to increased health consciousness among consumers. Conventional rice milk remains the dominant segment, due to its lower cost.
- Distribution Channel: Supermarket/hypermarkets are the major distribution channel for rice milk, followed by convenience stores, food specialty stores, and online retailers. The online retail segment is witnessing significant growth due to the increasing popularity of e-commerce.
Key Drivers:
- Asia-Pacific Region: High rice production, growing consumer preference for plant-based milk alternatives, increasing awareness of health and wellness.
- North America & Europe: Growing vegan and vegetarian populations, increasing health and wellness trends, and strong retail infrastructure support.
Rice Milk Industry Product Developments
Recent product innovations include the launch of flavored rice milk, barista-style blends optimized for coffee, and rice milk fortified with vitamins and minerals. These developments cater to evolving consumer preferences and enhance the product’s versatility and appeal. Technological advancements in processing techniques improve the taste, texture, and shelf life of rice milk.
Report Scope & Segmentation Analysis
This report segments the rice milk market by form (powder and fluid), source (organic and conventional), and distribution channel (supermarket/hypermarket, convenience stores, food specialty stores, online retailers, and others). Each segment's growth projections, market size, and competitive dynamics are analyzed in detail. The market size for fluid rice milk is predicted to be xx Million in 2025, while powder rice milk is projected at xx Million. Organic rice milk is expected to grow at a faster rate than conventional rice milk. The online retail channel is anticipated to witness the highest growth rate among all distribution channels.
Key Drivers of Rice Milk Industry Growth
The key drivers for rice milk industry growth include rising consumer preference for plant-based alternatives to dairy milk, increasing health consciousness, and the growing vegan and vegetarian populations globally. Technological advancements in production and processing have improved the taste, texture, and shelf life of rice milk products, further fueling market expansion. Favorable government regulations promoting plant-based food options also contribute to market growth.
Challenges in the Rice Milk Industry Sector
The rice milk industry faces challenges such as competition from other plant-based milk alternatives, fluctuations in raw material prices, and stringent regulatory requirements for food safety and labeling. Supply chain disruptions and concerns about sustainability can also impact industry growth. The total impact of these challenges is estimated to reduce the market growth by approximately xx% by 2033.
Emerging Opportunities in Rice Milk Industry
Emerging opportunities include the expansion into new markets, particularly in developing economies with growing populations and increasing disposable incomes. The development of innovative products, such as functional rice milk with added health benefits (e.g., probiotics), and the adoption of sustainable production practices, present significant growth potential. Increased consumer demand for organic and ethically sourced products offers further opportunities.
Leading Players in the Rice Milk Industry Market
- Pureharvest Pty ltd
- Gan Teck Kar Foods
- The Bridge s r l
- Fine Japan Co Ltd
- Nature's Choice
- The Hain Celestial Group Inc
- WhiteWave Foods
- Vitasoy Australia Products Pty Ltd
- Ebro Foods (Tilda)
- Linda MacCartney Foods
- SunOpta Inc
- Panos Brands LLC (Better Than Milk)
Key Developments in Rice Milk Industry Industry
- April 2021: SunOpta completed an acquisition of Hain Celestial Group's North America non-dairy beverages brands, including Dream and WestSoy, significantly altering market dynamics.
- May 2021: Linda McCartney's launched a new range of plant-based milk drinks, including organic rice milk, expanding its presence in the dairy-alternative market.
- February 2022: Ebro Foods' subsidiary, Tilda Rice, launched a plant-based sweet rice milk with a high rice content (16%), differentiating its product and increasing competition.
Strategic Outlook for Rice Milk Industry Market
The rice milk industry is poised for continued growth, driven by evolving consumer preferences and technological advancements. The market's future potential is substantial, particularly in emerging economies. Companies focusing on product innovation, sustainable sourcing, and effective marketing strategies are likely to gain a competitive advantage and capture significant market share. Expansion into new product categories, such as rice milk-based yogurt or ice cream, also presents significant opportunities for growth.
Rice Milk Industry Segmentation
-
1. Form
- 1.1. Powder rice milk
- 1.2. Fluid rice milk
-
2. Source
- 2.1. Organic
- 2.2. Conventional
-
3. Distribution Channel
- 3.1. Supermarket/Hypermarket
- 3.2. Convenience Stores
- 3.3. Food Specialty Stores
- 3.4. Online Retailers
- 3.5. Others
Rice Milk Industry Segmentation By Geography
- 1. North America
- 2. Europe
- 3. Asia Pacific
- 4. South America
- 5. Middle East and Africa
Rice Milk Industry REPORT HIGHLIGHTS
| Aspects | Details |
|---|---|
| Study Period | 2019-2033 |
| Base Year | 2024 |
| Estimated Year | 2025 |
| Forecast Period | 2025-2033 |
| Historical Period | 2019-2024 |
| Growth Rate | CAGR of 5.28% from 2019-2033 |
| Segmentation |
|
Table of Contents
- 1. Introduction
- 1.1. Research Scope
- 1.2. Market Segmentation
- 1.3. Research Methodology
- 1.4. Definitions and Assumptions
- 2. Executive Summary
- 2.1. Introduction
- 3. Market Dynamics
- 3.1. Introduction
- 3.2. Market Drivers
- 3.2.1 The prevalence of lactose intolerance and dairy allergies is leading consumers to seek non-dairy alternatives
- 3.2.2 making rice milk an attractive option for those with dietary restrictions.
- 3.3. Market Restrains
- 3.3.1 Rice milk is lower in protein compared to other plant-based milks like soy or almond milk
- 3.3.2 which may deter some consumers seeking more balanced nutrition
- 3.4. Market Trends
- 3.4.1 There is a growing trend toward fortified rice milk products that address the nutritional gaps compared to dairy milk
- 3.4.2 such as low protein content.
- 4. Market Factor Analysis
- 4.1. Porters Five Forces
- 4.2. Supply/Value Chain
- 4.3. PESTEL analysis
- 4.4. Market Entropy
- 4.5. Patent/Trademark Analysis
- 5. Global Rice Milk Industry Analysis, Insights and Forecast, 2019-2031
- 5.1. Market Analysis, Insights and Forecast - by Form
- 5.1.1. Powder rice milk
- 5.1.2. Fluid rice milk
- 5.2. Market Analysis, Insights and Forecast - by Source
- 5.2.1. Organic
- 5.2.2. Conventional
- 5.3. Market Analysis, Insights and Forecast - by Distribution Channel
- 5.3.1. Supermarket/Hypermarket
- 5.3.2. Convenience Stores
- 5.3.3. Food Specialty Stores
- 5.3.4. Online Retailers
- 5.3.5. Others
- 5.4. Market Analysis, Insights and Forecast - by Region
- 5.4.1. North America
- 5.4.2. Europe
- 5.4.3. Asia Pacific
- 5.4.4. South America
- 5.4.5. Middle East and Africa
- 5.1. Market Analysis, Insights and Forecast - by Form
- 6. North America Rice Milk Industry Analysis, Insights and Forecast, 2019-2031
- 6.1. Market Analysis, Insights and Forecast - by Form
- 6.1.1. Powder rice milk
- 6.1.2. Fluid rice milk
- 6.2. Market Analysis, Insights and Forecast - by Source
- 6.2.1. Organic
- 6.2.2. Conventional
- 6.3. Market Analysis, Insights and Forecast - by Distribution Channel
- 6.3.1. Supermarket/Hypermarket
- 6.3.2. Convenience Stores
- 6.3.3. Food Specialty Stores
- 6.3.4. Online Retailers
- 6.3.5. Others
- 6.1. Market Analysis, Insights and Forecast - by Form
- 7. Europe Rice Milk Industry Analysis, Insights and Forecast, 2019-2031
- 7.1. Market Analysis, Insights and Forecast - by Form
- 7.1.1. Powder rice milk
- 7.1.2. Fluid rice milk
- 7.2. Market Analysis, Insights and Forecast - by Source
- 7.2.1. Organic
- 7.2.2. Conventional
- 7.3. Market Analysis, Insights and Forecast - by Distribution Channel
- 7.3.1. Supermarket/Hypermarket
- 7.3.2. Convenience Stores
- 7.3.3. Food Specialty Stores
- 7.3.4. Online Retailers
- 7.3.5. Others
- 7.1. Market Analysis, Insights and Forecast - by Form
- 8. Asia Pacific Rice Milk Industry Analysis, Insights and Forecast, 2019-2031
- 8.1. Market Analysis, Insights and Forecast - by Form
- 8.1.1. Powder rice milk
- 8.1.2. Fluid rice milk
- 8.2. Market Analysis, Insights and Forecast - by Source
- 8.2.1. Organic
- 8.2.2. Conventional
- 8.3. Market Analysis, Insights and Forecast - by Distribution Channel
- 8.3.1. Supermarket/Hypermarket
- 8.3.2. Convenience Stores
- 8.3.3. Food Specialty Stores
- 8.3.4. Online Retailers
- 8.3.5. Others
- 8.1. Market Analysis, Insights and Forecast - by Form
- 9. South America Rice Milk Industry Analysis, Insights and Forecast, 2019-2031
- 9.1. Market Analysis, Insights and Forecast - by Form
- 9.1.1. Powder rice milk
- 9.1.2. Fluid rice milk
- 9.2. Market Analysis, Insights and Forecast - by Source
- 9.2.1. Organic
- 9.2.2. Conventional
- 9.3. Market Analysis, Insights and Forecast - by Distribution Channel
- 9.3.1. Supermarket/Hypermarket
- 9.3.2. Convenience Stores
- 9.3.3. Food Specialty Stores
- 9.3.4. Online Retailers
- 9.3.5. Others
- 9.1. Market Analysis, Insights and Forecast - by Form
- 10. Middle East and Africa Rice Milk Industry Analysis, Insights and Forecast, 2019-2031
- 10.1. Market Analysis, Insights and Forecast - by Form
- 10.1.1. Powder rice milk
- 10.1.2. Fluid rice milk
- 10.2. Market Analysis, Insights and Forecast - by Source
- 10.2.1. Organic
- 10.2.2. Conventional
- 10.3. Market Analysis, Insights and Forecast - by Distribution Channel
- 10.3.1. Supermarket/Hypermarket
- 10.3.2. Convenience Stores
- 10.3.3. Food Specialty Stores
- 10.3.4. Online Retailers
- 10.3.5. Others
- 10.1. Market Analysis, Insights and Forecast - by Form
- 11. North America Rice Milk Industry Analysis, Insights and Forecast, 2019-2031
- 11.1. Market Analysis, Insights and Forecast - By Country/Sub-region
- 11.1.1 United States
- 11.1.2 Canada
- 11.1.3 Mexico
- 12. Europe Rice Milk Industry Analysis, Insights and Forecast, 2019-2031
- 12.1. Market Analysis, Insights and Forecast - By Country/Sub-region
- 12.1.1 Germany
- 12.1.2 United Kingdom
- 12.1.3 France
- 12.1.4 Spain
- 12.1.5 Italy
- 12.1.6 Spain
- 12.1.7 Belgium
- 12.1.8 Netherland
- 12.1.9 Nordics
- 12.1.10 Rest of Europe
- 13. Asia Pacific Rice Milk Industry Analysis, Insights and Forecast, 2019-2031
- 13.1. Market Analysis, Insights and Forecast - By Country/Sub-region
- 13.1.1 China
- 13.1.2 Japan
- 13.1.3 India
- 13.1.4 South Korea
- 13.1.5 Southeast Asia
- 13.1.6 Australia
- 13.1.7 Indonesia
- 13.1.8 Phillipes
- 13.1.9 Singapore
- 13.1.10 Thailandc
- 13.1.11 Rest of Asia Pacific
- 14. South America Rice Milk Industry Analysis, Insights and Forecast, 2019-2031
- 14.1. Market Analysis, Insights and Forecast - By Country/Sub-region
- 14.1.1 Brazil
- 14.1.2 Argentina
- 14.1.3 Peru
- 14.1.4 Chile
- 14.1.5 Colombia
- 14.1.6 Ecuador
- 14.1.7 Venezuela
- 14.1.8 Rest of South America
- 15. North America Rice Milk Industry Analysis, Insights and Forecast, 2019-2031
- 15.1. Market Analysis, Insights and Forecast - By Country/Sub-region
- 15.1.1 United States
- 15.1.2 Canada
- 15.1.3 Mexico
- 16. MEA Rice Milk Industry Analysis, Insights and Forecast, 2019-2031
- 16.1. Market Analysis, Insights and Forecast - By Country/Sub-region
- 16.1.1 United Arab Emirates
- 16.1.2 Saudi Arabia
- 16.1.3 South Africa
- 16.1.4 Rest of Middle East and Africa
- 17. Competitive Analysis
- 17.1. Global Market Share Analysis 2024
- 17.2. Company Profiles
- 17.2.1 Pureharvest Pty ltd
- 17.2.1.1. Overview
- 17.2.1.2. Products
- 17.2.1.3. SWOT Analysis
- 17.2.1.4. Recent Developments
- 17.2.1.5. Financials (Based on Availability)
- 17.2.2 Gan Teck Kar Foods
- 17.2.2.1. Overview
- 17.2.2.2. Products
- 17.2.2.3. SWOT Analysis
- 17.2.2.4. Recent Developments
- 17.2.2.5. Financials (Based on Availability)
- 17.2.3 The Bridge s r l
- 17.2.3.1. Overview
- 17.2.3.2. Products
- 17.2.3.3. SWOT Analysis
- 17.2.3.4. Recent Developments
- 17.2.3.5. Financials (Based on Availability)
- 17.2.4 Fine Japan Co Ltd
- 17.2.4.1. Overview
- 17.2.4.2. Products
- 17.2.4.3. SWOT Analysis
- 17.2.4.4. Recent Developments
- 17.2.4.5. Financials (Based on Availability)
- 17.2.5 Nature's Choice
- 17.2.5.1. Overview
- 17.2.5.2. Products
- 17.2.5.3. SWOT Analysis
- 17.2.5.4. Recent Developments
- 17.2.5.5. Financials (Based on Availability)
- 17.2.6 The Hain Celestial Group Inc
- 17.2.6.1. Overview
- 17.2.6.2. Products
- 17.2.6.3. SWOT Analysis
- 17.2.6.4. Recent Developments
- 17.2.6.5. Financials (Based on Availability)
- 17.2.7 WhiteWave Foods
- 17.2.7.1. Overview
- 17.2.7.2. Products
- 17.2.7.3. SWOT Analysis
- 17.2.7.4. Recent Developments
- 17.2.7.5. Financials (Based on Availability)
- 17.2.8 Vitasoy Australia Products Pty Ltd
- 17.2.8.1. Overview
- 17.2.8.2. Products
- 17.2.8.3. SWOT Analysis
- 17.2.8.4. Recent Developments
- 17.2.8.5. Financials (Based on Availability)
- 17.2.9 Ebro Foods (Tilda)
- 17.2.9.1. Overview
- 17.2.9.2. Products
- 17.2.9.3. SWOT Analysis
- 17.2.9.4. Recent Developments
- 17.2.9.5. Financials (Based on Availability)
- 17.2.10 Linda MacCartney Foods
- 17.2.10.1. Overview
- 17.2.10.2. Products
- 17.2.10.3. SWOT Analysis
- 17.2.10.4. Recent Developments
- 17.2.10.5. Financials (Based on Availability)
- 17.2.11 SunOpta Inc
- 17.2.11.1. Overview
- 17.2.11.2. Products
- 17.2.11.3. SWOT Analysis
- 17.2.11.4. Recent Developments
- 17.2.11.5. Financials (Based on Availability)
- 17.2.12 Panos Brands LLC (Better Than Milk)
- 17.2.12.1. Overview
- 17.2.12.2. Products
- 17.2.12.3. SWOT Analysis
- 17.2.12.4. Recent Developments
- 17.2.12.5. Financials (Based on Availability)
- 17.2.1 Pureharvest Pty ltd
List of Figures
- Figure 1: Global Rice Milk Industry Revenue Breakdown (Million, %) by Region 2024 & 2032
- Figure 2: North America Rice Milk Industry Revenue (Million), by Country 2024 & 2032
- Figure 3: North America Rice Milk Industry Revenue Share (%), by Country 2024 & 2032
- Figure 4: Europe Rice Milk Industry Revenue (Million), by Country 2024 & 2032
- Figure 5: Europe Rice Milk Industry Revenue Share (%), by Country 2024 & 2032
- Figure 6: Asia Pacific Rice Milk Industry Revenue (Million), by Country 2024 & 2032
- Figure 7: Asia Pacific Rice Milk Industry Revenue Share (%), by Country 2024 & 2032
- Figure 8: South America Rice Milk Industry Revenue (Million), by Country 2024 & 2032
- Figure 9: South America Rice Milk Industry Revenue Share (%), by Country 2024 & 2032
- Figure 10: North America Rice Milk Industry Revenue (Million), by Country 2024 & 2032
- Figure 11: North America Rice Milk Industry Revenue Share (%), by Country 2024 & 2032
- Figure 12: MEA Rice Milk Industry Revenue (Million), by Country 2024 & 2032
- Figure 13: MEA Rice Milk Industry Revenue Share (%), by Country 2024 & 2032
- Figure 14: North America Rice Milk Industry Revenue (Million), by Form 2024 & 2032
- Figure 15: North America Rice Milk Industry Revenue Share (%), by Form 2024 & 2032
- Figure 16: North America Rice Milk Industry Revenue (Million), by Source 2024 & 2032
- Figure 17: North America Rice Milk Industry Revenue Share (%), by Source 2024 & 2032
- Figure 18: North America Rice Milk Industry Revenue (Million), by Distribution Channel 2024 & 2032
- Figure 19: North America Rice Milk Industry Revenue Share (%), by Distribution Channel 2024 & 2032
- Figure 20: North America Rice Milk Industry Revenue (Million), by Country 2024 & 2032
- Figure 21: North America Rice Milk Industry Revenue Share (%), by Country 2024 & 2032
- Figure 22: Europe Rice Milk Industry Revenue (Million), by Form 2024 & 2032
- Figure 23: Europe Rice Milk Industry Revenue Share (%), by Form 2024 & 2032
- Figure 24: Europe Rice Milk Industry Revenue (Million), by Source 2024 & 2032
- Figure 25: Europe Rice Milk Industry Revenue Share (%), by Source 2024 & 2032
- Figure 26: Europe Rice Milk Industry Revenue (Million), by Distribution Channel 2024 & 2032
- Figure 27: Europe Rice Milk Industry Revenue Share (%), by Distribution Channel 2024 & 2032
- Figure 28: Europe Rice Milk Industry Revenue (Million), by Country 2024 & 2032
- Figure 29: Europe Rice Milk Industry Revenue Share (%), by Country 2024 & 2032
- Figure 30: Asia Pacific Rice Milk Industry Revenue (Million), by Form 2024 & 2032
- Figure 31: Asia Pacific Rice Milk Industry Revenue Share (%), by Form 2024 & 2032
- Figure 32: Asia Pacific Rice Milk Industry Revenue (Million), by Source 2024 & 2032
- Figure 33: Asia Pacific Rice Milk Industry Revenue Share (%), by Source 2024 & 2032
- Figure 34: Asia Pacific Rice Milk Industry Revenue (Million), by Distribution Channel 2024 & 2032
- Figure 35: Asia Pacific Rice Milk Industry Revenue Share (%), by Distribution Channel 2024 & 2032
- Figure 36: Asia Pacific Rice Milk Industry Revenue (Million), by Country 2024 & 2032
- Figure 37: Asia Pacific Rice Milk Industry Revenue Share (%), by Country 2024 & 2032
- Figure 38: South America Rice Milk Industry Revenue (Million), by Form 2024 & 2032
- Figure 39: South America Rice Milk Industry Revenue Share (%), by Form 2024 & 2032
- Figure 40: South America Rice Milk Industry Revenue (Million), by Source 2024 & 2032
- Figure 41: South America Rice Milk Industry Revenue Share (%), by Source 2024 & 2032
- Figure 42: South America Rice Milk Industry Revenue (Million), by Distribution Channel 2024 & 2032
- Figure 43: South America Rice Milk Industry Revenue Share (%), by Distribution Channel 2024 & 2032
- Figure 44: South America Rice Milk Industry Revenue (Million), by Country 2024 & 2032
- Figure 45: South America Rice Milk Industry Revenue Share (%), by Country 2024 & 2032
- Figure 46: Middle East and Africa Rice Milk Industry Revenue (Million), by Form 2024 & 2032
- Figure 47: Middle East and Africa Rice Milk Industry Revenue Share (%), by Form 2024 & 2032
- Figure 48: Middle East and Africa Rice Milk Industry Revenue (Million), by Source 2024 & 2032
- Figure 49: Middle East and Africa Rice Milk Industry Revenue Share (%), by Source 2024 & 2032
- Figure 50: Middle East and Africa Rice Milk Industry Revenue (Million), by Distribution Channel 2024 & 2032
- Figure 51: Middle East and Africa Rice Milk Industry Revenue Share (%), by Distribution Channel 2024 & 2032
- Figure 52: Middle East and Africa Rice Milk Industry Revenue (Million), by Country 2024 & 2032
- Figure 53: Middle East and Africa Rice Milk Industry Revenue Share (%), by Country 2024 & 2032
List of Tables
- Table 1: Global Rice Milk Industry Revenue Million Forecast, by Region 2019 & 2032
- Table 2: Global Rice Milk Industry Revenue Million Forecast, by Form 2019 & 2032
- Table 3: Global Rice Milk Industry Revenue Million Forecast, by Source 2019 & 2032
- Table 4: Global Rice Milk Industry Revenue Million Forecast, by Distribution Channel 2019 & 2032
- Table 5: Global Rice Milk Industry Revenue Million Forecast, by Region 2019 & 2032
- Table 6: Global Rice Milk Industry Revenue Million Forecast, by Country 2019 & 2032
- Table 7: United States Rice Milk Industry Revenue (Million) Forecast, by Application 2019 & 2032
- Table 8: Canada Rice Milk Industry Revenue (Million) Forecast, by Application 2019 & 2032
- Table 9: Mexico Rice Milk Industry Revenue (Million) Forecast, by Application 2019 & 2032
- Table 10: Global Rice Milk Industry Revenue Million Forecast, by Country 2019 & 2032
- Table 11: Germany Rice Milk Industry Revenue (Million) Forecast, by Application 2019 & 2032
- Table 12: United Kingdom Rice Milk Industry Revenue (Million) Forecast, by Application 2019 & 2032
- Table 13: France Rice Milk Industry Revenue (Million) Forecast, by Application 2019 & 2032
- Table 14: Spain Rice Milk Industry Revenue (Million) Forecast, by Application 2019 & 2032
- Table 15: Italy Rice Milk Industry Revenue (Million) Forecast, by Application 2019 & 2032
- Table 16: Spain Rice Milk Industry Revenue (Million) Forecast, by Application 2019 & 2032
- Table 17: Belgium Rice Milk Industry Revenue (Million) Forecast, by Application 2019 & 2032
- Table 18: Netherland Rice Milk Industry Revenue (Million) Forecast, by Application 2019 & 2032
- Table 19: Nordics Rice Milk Industry Revenue (Million) Forecast, by Application 2019 & 2032
- Table 20: Rest of Europe Rice Milk Industry Revenue (Million) Forecast, by Application 2019 & 2032
- Table 21: Global Rice Milk Industry Revenue Million Forecast, by Country 2019 & 2032
- Table 22: China Rice Milk Industry Revenue (Million) Forecast, by Application 2019 & 2032
- Table 23: Japan Rice Milk Industry Revenue (Million) Forecast, by Application 2019 & 2032
- Table 24: India Rice Milk Industry Revenue (Million) Forecast, by Application 2019 & 2032
- Table 25: South Korea Rice Milk Industry Revenue (Million) Forecast, by Application 2019 & 2032
- Table 26: Southeast Asia Rice Milk Industry Revenue (Million) Forecast, by Application 2019 & 2032
- Table 27: Australia Rice Milk Industry Revenue (Million) Forecast, by Application 2019 & 2032
- Table 28: Indonesia Rice Milk Industry Revenue (Million) Forecast, by Application 2019 & 2032
- Table 29: Phillipes Rice Milk Industry Revenue (Million) Forecast, by Application 2019 & 2032
- Table 30: Singapore Rice Milk Industry Revenue (Million) Forecast, by Application 2019 & 2032
- Table 31: Thailandc Rice Milk Industry Revenue (Million) Forecast, by Application 2019 & 2032
- Table 32: Rest of Asia Pacific Rice Milk Industry Revenue (Million) Forecast, by Application 2019 & 2032
- Table 33: Global Rice Milk Industry Revenue Million Forecast, by Country 2019 & 2032
- Table 34: Brazil Rice Milk Industry Revenue (Million) Forecast, by Application 2019 & 2032
- Table 35: Argentina Rice Milk Industry Revenue (Million) Forecast, by Application 2019 & 2032
- Table 36: Peru Rice Milk Industry Revenue (Million) Forecast, by Application 2019 & 2032
- Table 37: Chile Rice Milk Industry Revenue (Million) Forecast, by Application 2019 & 2032
- Table 38: Colombia Rice Milk Industry Revenue (Million) Forecast, by Application 2019 & 2032
- Table 39: Ecuador Rice Milk Industry Revenue (Million) Forecast, by Application 2019 & 2032
- Table 40: Venezuela Rice Milk Industry Revenue (Million) Forecast, by Application 2019 & 2032
- Table 41: Rest of South America Rice Milk Industry Revenue (Million) Forecast, by Application 2019 & 2032
- Table 42: Global Rice Milk Industry Revenue Million Forecast, by Country 2019 & 2032
- Table 43: United States Rice Milk Industry Revenue (Million) Forecast, by Application 2019 & 2032
- Table 44: Canada Rice Milk Industry Revenue (Million) Forecast, by Application 2019 & 2032
- Table 45: Mexico Rice Milk Industry Revenue (Million) Forecast, by Application 2019 & 2032
- Table 46: Global Rice Milk Industry Revenue Million Forecast, by Country 2019 & 2032
- Table 47: United Arab Emirates Rice Milk Industry Revenue (Million) Forecast, by Application 2019 & 2032
- Table 48: Saudi Arabia Rice Milk Industry Revenue (Million) Forecast, by Application 2019 & 2032
- Table 49: South Africa Rice Milk Industry Revenue (Million) Forecast, by Application 2019 & 2032
- Table 50: Rest of Middle East and Africa Rice Milk Industry Revenue (Million) Forecast, by Application 2019 & 2032
- Table 51: Global Rice Milk Industry Revenue Million Forecast, by Form 2019 & 2032
- Table 52: Global Rice Milk Industry Revenue Million Forecast, by Source 2019 & 2032
- Table 53: Global Rice Milk Industry Revenue Million Forecast, by Distribution Channel 2019 & 2032
- Table 54: Global Rice Milk Industry Revenue Million Forecast, by Country 2019 & 2032
- Table 55: Global Rice Milk Industry Revenue Million Forecast, by Form 2019 & 2032
- Table 56: Global Rice Milk Industry Revenue Million Forecast, by Source 2019 & 2032
- Table 57: Global Rice Milk Industry Revenue Million Forecast, by Distribution Channel 2019 & 2032
- Table 58: Global Rice Milk Industry Revenue Million Forecast, by Country 2019 & 2032
- Table 59: Global Rice Milk Industry Revenue Million Forecast, by Form 2019 & 2032
- Table 60: Global Rice Milk Industry Revenue Million Forecast, by Source 2019 & 2032
- Table 61: Global Rice Milk Industry Revenue Million Forecast, by Distribution Channel 2019 & 2032
- Table 62: Global Rice Milk Industry Revenue Million Forecast, by Country 2019 & 2032
- Table 63: Global Rice Milk Industry Revenue Million Forecast, by Form 2019 & 2032
- Table 64: Global Rice Milk Industry Revenue Million Forecast, by Source 2019 & 2032
- Table 65: Global Rice Milk Industry Revenue Million Forecast, by Distribution Channel 2019 & 2032
- Table 66: Global Rice Milk Industry Revenue Million Forecast, by Country 2019 & 2032
- Table 67: Global Rice Milk Industry Revenue Million Forecast, by Form 2019 & 2032
- Table 68: Global Rice Milk Industry Revenue Million Forecast, by Source 2019 & 2032
- Table 69: Global Rice Milk Industry Revenue Million Forecast, by Distribution Channel 2019 & 2032
- Table 70: Global Rice Milk Industry Revenue Million Forecast, by Country 2019 & 2032
Frequently Asked Questions
1. What is the projected Compound Annual Growth Rate (CAGR) of the Rice Milk Industry?
The projected CAGR is approximately 5.28%.
2. Which companies are prominent players in the Rice Milk Industry?
Key companies in the market include Pureharvest Pty ltd, Gan Teck Kar Foods, The Bridge s r l, Fine Japan Co Ltd, Nature's Choice, The Hain Celestial Group Inc, WhiteWave Foods, Vitasoy Australia Products Pty Ltd, Ebro Foods (Tilda), Linda MacCartney Foods, SunOpta Inc, Panos Brands LLC (Better Than Milk).
3. What are the main segments of the Rice Milk Industry?
The market segments include Form, Source, Distribution Channel.
4. Can you provide details about the market size?
The market size is estimated to be USD 277.08 Million as of 2022.
5. What are some drivers contributing to market growth?
The prevalence of lactose intolerance and dairy allergies is leading consumers to seek non-dairy alternatives. making rice milk an attractive option for those with dietary restrictions..
6. What are the notable trends driving market growth?
There is a growing trend toward fortified rice milk products that address the nutritional gaps compared to dairy milk. such as low protein content..
7. Are there any restraints impacting market growth?
Rice milk is lower in protein compared to other plant-based milks like soy or almond milk. which may deter some consumers seeking more balanced nutrition.
8. Can you provide examples of recent developments in the market?
February 2022: Ebro Foods subsidiary Tilda Rice launched plant-based sweet rice milk. The rice milk is made with natural and organic ingredients with 16% rice content. The company claims that this product includes more percentage of rice than any other brand and it is free from artificial sweeteners and added sugar.
9. What pricing options are available for accessing the report?
Pricing options include single-user, multi-user, and enterprise licenses priced at USD 4750, USD 5250, and USD 8750 respectively.
10. Is the market size provided in terms of value or volume?
The market size is provided in terms of value, measured in Million.
11. Are there any specific market keywords associated with the report?
Yes, the market keyword associated with the report is "Rice Milk Industry," which aids in identifying and referencing the specific market segment covered.
12. How do I determine which pricing option suits my needs best?
The pricing options vary based on user requirements and access needs. Individual users may opt for single-user licenses, while businesses requiring broader access may choose multi-user or enterprise licenses for cost-effective access to the report.
13. Are there any additional resources or data provided in the Rice Milk Industry report?
While the report offers comprehensive insights, it's advisable to review the specific contents or supplementary materials provided to ascertain if additional resources or data are available.
14. How can I stay updated on further developments or reports in the Rice Milk Industry?
To stay informed about further developments, trends, and reports in the Rice Milk Industry, consider subscribing to industry newsletters, following relevant companies and organizations, or regularly checking reputable industry news sources and publications.
Methodology
Step 1 - Identification of Relevant Samples Size from Population Database


Step 2 - Approaches for Defining Global Market Size (Value, Volume* & Price*)

Note*: In applicable scenarios
Step 3 - Data Sources
Primary Research
- Web Analytics
- Survey Reports
- Research Institute
- Latest Research Reports
- Opinion Leaders
Secondary Research
- Annual Reports
- White Paper
- Latest Press Release
- Industry Association
- Paid Database
- Investor Presentations

Step 4 - Data Triangulation
Involves using different sources of information in order to increase the validity of a study
These sources are likely to be stakeholders in a program - participants, other researchers, program staff, other community members, and so on.
Then we put all data in single framework & apply various statistical tools to find out the dynamic on the market.
During the analysis stage, feedback from the stakeholder groups would be compared to determine areas of agreement as well as areas of divergence


