
Key Insights
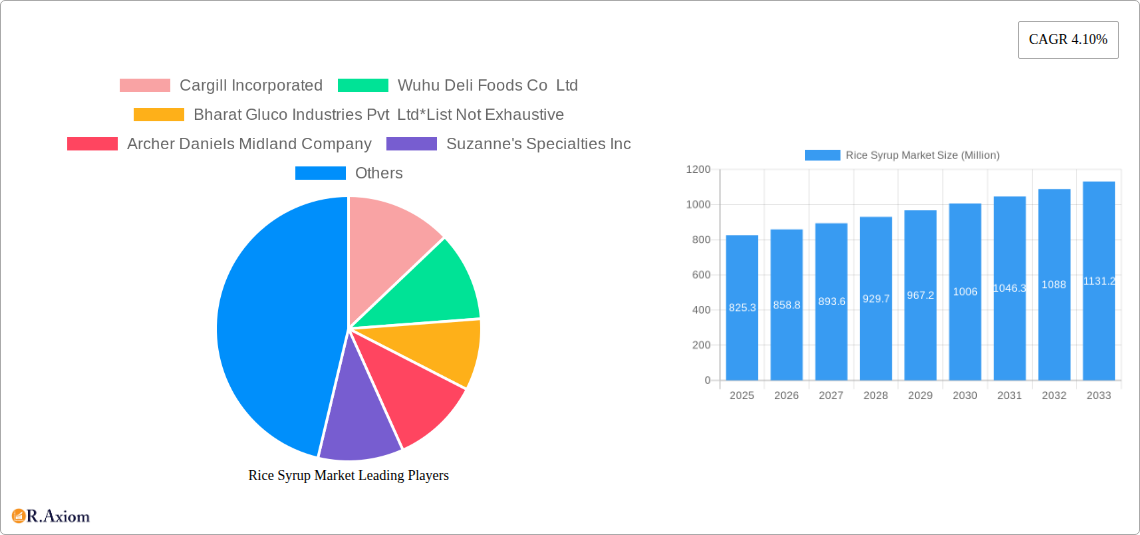
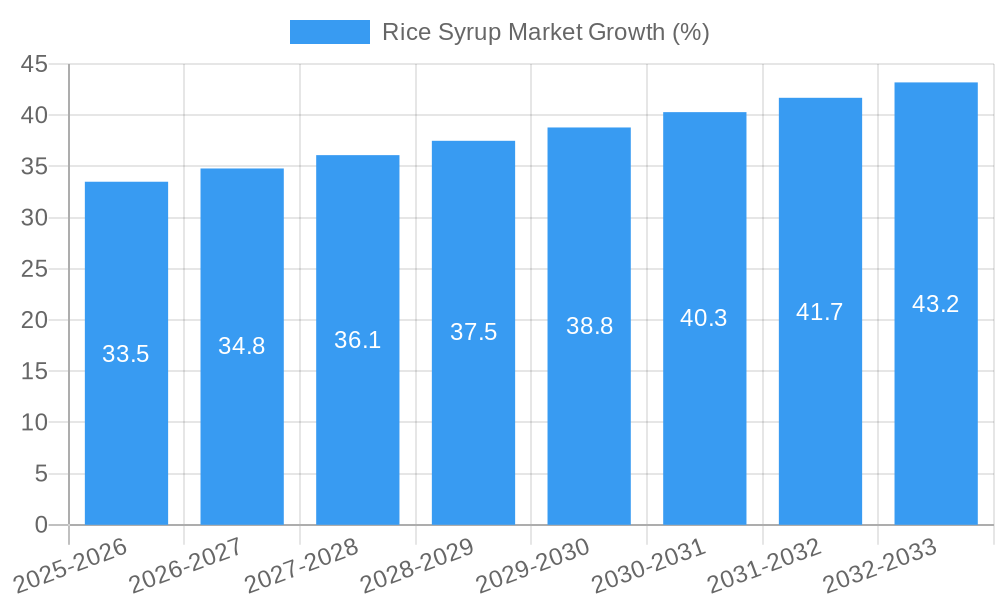
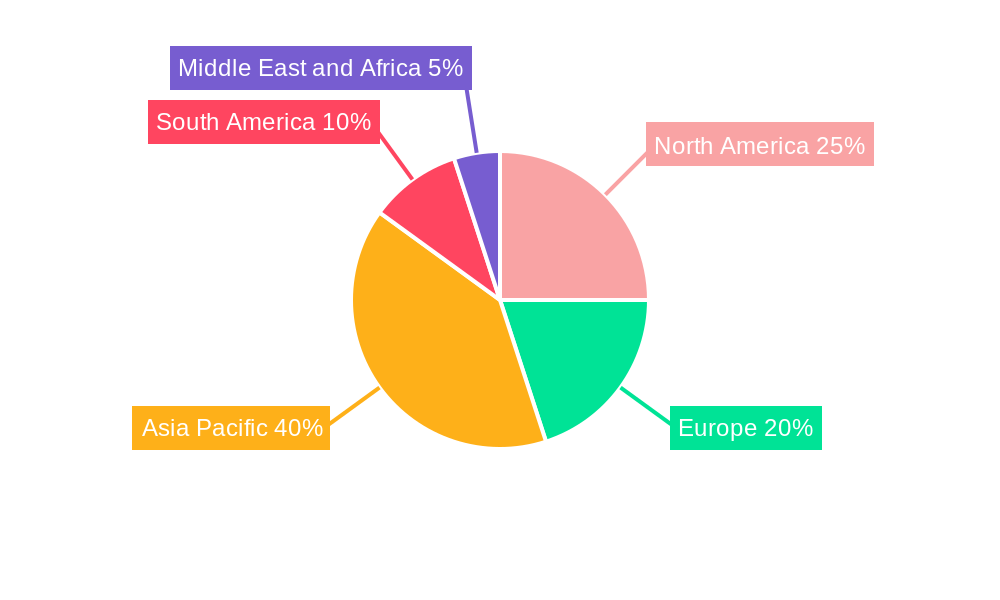
The global rice syrup market, valued at $825.3 million in 2025, is projected to experience steady growth, driven by increasing demand for natural and healthier sweeteners across diverse food and beverage applications. The Compound Annual Growth Rate (CAGR) of 4.10% from 2025 to 2033 indicates a promising outlook, fueled by several key factors. The rising popularity of organic and clean-label products is a significant driver, with consumers increasingly seeking alternatives to high-fructose corn syrup and artificial sweeteners. This preference is particularly strong in the bakery and confectionery, beverage, and dairy sectors, where rice syrup's mild sweetness and neutral flavor profile make it an attractive ingredient. Furthermore, the growing health-conscious population is adopting dietary changes that emphasize natural sugars, bolstering the demand for rice syrup. Market segmentation reveals a preference for white rice syrup over brown rice, potentially due to its lighter color and texture, which are desirable in certain food applications. However, the organic rice syrup segment is also experiencing strong growth reflecting the overall trend towards organic food consumption. The geographical distribution of the market shows significant potential in the Asia-Pacific region, driven by large populations and expanding food processing industries. North America and Europe represent established markets with strong existing demand and a willingness to adopt innovative ingredients. Competition within the market is relatively diverse, with both large multinational corporations and smaller specialized producers offering various rice syrup types and applications. Future growth will likely be influenced by advancements in processing technologies that improve efficiency and reduce costs, as well as the emergence of new applications for rice syrup in health and wellness products.
The continued growth of the rice syrup market is anticipated to be influenced by factors such as increasing consumer awareness of health and wellness, coupled with a rising preference for natural and minimally processed food products. This preference translates to a higher demand for clean-label ingredients, making rice syrup an attractive alternative to synthetic sweeteners. The expanding food and beverage industry globally, particularly within the segments of bakery & confectionery, beverages, and dairy, presents further opportunities for growth. However, price fluctuations in rice, a key raw material, might pose a challenge to market expansion. Furthermore, the market's success will depend on consistent innovation and diversification of product offerings, including the introduction of functionalized rice syrups with added health benefits. Strategic partnerships and collaborations between producers and food manufacturers can further accelerate the market’s growth by facilitating access to wider distribution networks and introducing innovative applications. The continued expansion into emerging markets in regions like Asia-Pacific will be essential for sustained market growth in the coming years.
Rice Syrup Market: A Comprehensive Analysis (2019-2033)
This comprehensive report provides an in-depth analysis of the global rice syrup market, offering invaluable insights for industry stakeholders, investors, and strategic decision-makers. The study covers the period from 2019 to 2033, with 2025 serving as the base and estimated year. The report meticulously analyzes market dynamics, segmentation, competitive landscape, and future growth prospects, providing actionable intelligence to navigate the evolving market landscape. The market size is projected to reach xx Million by 2033, exhibiting a CAGR of xx% during the forecast period (2025-2033).
Rice Syrup Market Concentration & Innovation
The rice syrup market exhibits a moderately concentrated structure, with key players like Cargill Incorporated, Archer Daniels Midland Company, and Associated British Foods PLC holding significant market share. However, the presence of several regional and smaller players indicates a competitive landscape. Market concentration is expected to remain relatively stable throughout the forecast period, though potential M&A activity could shift the dynamics. Innovation in the sector primarily focuses on developing organic, non-GMO, and functional rice syrups to cater to growing health-conscious consumer preferences. Regulatory frameworks concerning food additives and labeling influence product development and market access. The emergence of alternative sweeteners poses a challenge, but the natural and less-processed nature of rice syrup provides a competitive edge. Recent M&A activity in the food processing industry has not significantly impacted the rice syrup market directly, with deal values remaining relatively low (xx Million annually on average). However, strategic partnerships and collaborations are becoming increasingly important for enhancing product portfolios and expanding market reach. End-user trends toward healthier and more sustainable food choices are driving demand for organic and sustainably sourced rice syrup.
Rice Syrup Market Industry Trends & Insights
The global rice syrup market is experiencing robust growth, driven by increasing demand from the food and beverage industry. Rising consumer awareness of health and wellness is fueling the adoption of natural sweeteners like rice syrup, particularly in applications where high fructose corn syrup is traditionally used. Technological advancements in rice processing and syrup refinement have enhanced product quality and efficiency. Consumer preferences for clean-label ingredients and the growing popularity of functional foods are further driving market expansion. The market exhibits strong regional variations, with Asia Pacific showcasing significant growth potential. The CAGR for the market is projected at xx% during the forecast period (2025-2033), indicating substantial growth momentum. Market penetration is increasing steadily across various regions, driven by factors like rising disposable incomes and changing dietary habits. The competitive landscape is characterized by intense competition among both established players and emerging entrants. This competition primarily revolves around product differentiation, pricing strategies, and supply chain optimization.
Dominant Markets & Segments in Rice Syrup Market
Leading Region: Asia Pacific is projected to dominate the rice syrup market, driven by high rice production, large consumer base, and increasing demand from the food processing industry. Key growth drivers include:
- Rapid economic growth and rising disposable incomes.
- Expanding food and beverage sector.
- Favorable government policies supporting agriculture and food processing.
Dominant Application: The bakery and confectionery segment constitutes the largest application segment, accounting for approximately xx% of the total market. This is attributed to the functional properties of rice syrup, its ability to improve texture and shelf life, and its sweetening capabilities.
Dominant Rice Type: White rice is currently the dominant rice type used for syrup production due to its higher yield and smoother texture. However, the demand for brown rice syrup, owing to its nutritional benefits, is steadily increasing.
Dominant Category: The conventional rice syrup segment currently holds the largest market share. However, the organic rice syrup segment is experiencing faster growth due to growing consumer preference for organic and natural products.
Detailed dominance analysis reveals that the interplay of economic growth, evolving consumer preferences, and technological improvements in processing contribute to the market's regional and segmental dominance.
Rice Syrup Market Product Developments
Recent product innovations focus on enhancing the functional properties of rice syrup, including developing syrups with improved sweetness, viscosity, and browning characteristics. Companies are also focusing on introducing organic and non-GMO variants to cater to health-conscious consumers. The development of rice syrups with added functional ingredients, such as prebiotics or antioxidants, is also gaining traction. These innovations aim to strengthen competitive advantages by offering unique value propositions to end-users within the expanding market segments. Technological advancements in enzymatic processes and efficient refining techniques have improved syrup quality and consistency.
Report Scope & Segmentation Analysis
The report segments the rice syrup market by application (Bakery and Confectionery, Beverages, Dessert and Dairy, Meat, Poultry, and Seafood, Instant Formula, Other Applications), rice type (Brown Rice, White Rice), and category (Organic, Conventional). Each segment's growth projection, market size, and competitive dynamics are analyzed. For example, the bakery and confectionery segment is projected to exhibit significant growth driven by rising demand for baked goods and confectioneries with natural sweeteners. The organic rice syrup category is expected to experience the highest growth rate during the forecast period, driven by the increasing consumer preference for organic and natural food products.
Key Drivers of Rice Syrup Market Growth
The rice syrup market is fueled by several factors: the growing demand for natural and healthier sweeteners, the increasing popularity of clean-label products in the food and beverage industry, and the rising consumer awareness of the negative health implications of high-fructose corn syrup. Technological advancements in rice processing and syrup refinement are further enhancing efficiency and product quality. Favorable government regulations and supportive policies in various regions are also contributing to market expansion.
Challenges in the Rice Syrup Market Sector
The market faces challenges including price volatility in rice raw materials, potential supply chain disruptions, and competition from other natural and artificial sweeteners. Stricter regulations on food additives and labeling requirements can also create hurdles for manufacturers. Fluctuations in raw material costs negatively impact profit margins, while maintaining a consistent supply chain is crucial to meeting growing demand. Intense competition from established players and the emergence of new entrants create significant pricing pressures.
Emerging Opportunities in Rice Syrup Market
Emerging opportunities include the expansion into new markets with growing health-conscious populations, the development of functional rice syrups with added health benefits, and the focus on sustainable sourcing and production practices. Exploring niche applications within the food and beverage sector (e.g., plant-based food products) presents promising avenues for growth.
Leading Players in the Rice Syrup Market Market
- Cargill Incorporated
- Wuhu Deli Foods Co Ltd
- Bharat Gluco Industries Pvt Ltd
- Archer Daniels Midland Company
- Suzanne's Specialties Inc
- Pure Life Organic Foods Ltd
- Associated British Foods PLC
- Axiom Foods Inc
- California Natural Products Inc
- Gulshan Polyols Ltd
Key Developments in Rice Syrup Market Industry
- 2022 Q4: Cargill Incorporated launched a new line of organic rice syrup targeting the growing demand for clean-label ingredients.
- 2023 Q1: Archer Daniels Midland Company announced a strategic partnership to expand its rice syrup production capacity in Asia.
- 2023 Q3: A significant merger between two smaller rice syrup manufacturers led to a consolidation of market share in the European region. (Further details on the merger not available for this report)
Strategic Outlook for Rice Syrup Market Market
The rice syrup market is poised for continued growth, driven by sustained demand for natural sweeteners and the increasing consumer preference for health-conscious food choices. The market's future prospects are bright, particularly in regions with expanding middle classes and increasing disposable incomes. Strategic investments in research and development, focusing on product innovation and sustainable sourcing, will be crucial for maintaining a competitive edge. Expanding market reach into new geographical areas and exploring niche applications within the food and beverage sector will further unlock growth potential.
Rice Syrup Market Segmentation
-
1. Rice Type
- 1.1. Brown Rice
- 1.2. White Rice
-
2. Category
- 2.1. Organic
- 2.2. Conventional
-
3. Application
- 3.1. Bakery and Confectionery
- 3.2. Beverages
- 3.3. Dessert and Dairy
- 3.4. Meat, Poultry, and Seafood
- 3.5. Instant Formula
- 3.6. Other Applications
Rice Syrup Market Segmentation By Geography
-
1. North America
- 1.1. United States
- 1.2. Canada
- 1.3. Mexico
- 1.4. Rest of North America
-
2. Europe
- 2.1. Germany
- 2.2. United Kingdom
- 2.3. France
- 2.4. Russia
- 2.5. Spain
- 2.6. Rest of Europe
-
3. Asia Pacific
- 3.1. China
- 3.2. Japan
- 3.3. India
- 3.4. Australia
- 3.5. Rest of Asia Pacific
-
4. South America
- 4.1. Brazil
- 4.2. Argentina
- 4.3. Rest of South America
-
5. Middle East and Africa
- 5.1. Saudi Arabia
- 5.2. South Africa
- 5.3. Rest of Middle East and Africa
Rice Syrup Market REPORT HIGHLIGHTS
| Aspects | Details |
|---|---|
| Study Period | 2019-2033 |
| Base Year | 2024 |
| Estimated Year | 2025 |
| Forecast Period | 2025-2033 |
| Historical Period | 2019-2024 |
| Growth Rate | CAGR of 4.10% from 2019-2033 |
| Segmentation |
|
Table of Contents
- 1. Introduction
- 1.1. Research Scope
- 1.2. Market Segmentation
- 1.3. Research Methodology
- 1.4. Definitions and Assumptions
- 2. Executive Summary
- 2.1. Introduction
- 3. Market Dynamics
- 3.1. Introduction
- 3.2. Market Drivers
- 3.2.1. Increasing Demand For Convenience & Processed Food
- 3.3. Market Restrains
- 3.3.1. Increased Consumer Awareness On Side-Effects Of Chemical Additives
- 3.4. Market Trends
- 3.4.1. Rising Demand for Natural Sweetener
- 4. Market Factor Analysis
- 4.1. Porters Five Forces
- 4.2. Supply/Value Chain
- 4.3. PESTEL analysis
- 4.4. Market Entropy
- 4.5. Patent/Trademark Analysis
- 5. Global Rice Syrup Market Analysis, Insights and Forecast, 2019-2031
- 5.1. Market Analysis, Insights and Forecast - by Rice Type
- 5.1.1. Brown Rice
- 5.1.2. White Rice
- 5.2. Market Analysis, Insights and Forecast - by Category
- 5.2.1. Organic
- 5.2.2. Conventional
- 5.3. Market Analysis, Insights and Forecast - by Application
- 5.3.1. Bakery and Confectionery
- 5.3.2. Beverages
- 5.3.3. Dessert and Dairy
- 5.3.4. Meat, Poultry, and Seafood
- 5.3.5. Instant Formula
- 5.3.6. Other Applications
- 5.4. Market Analysis, Insights and Forecast - by Region
- 5.4.1. North America
- 5.4.2. Europe
- 5.4.3. Asia Pacific
- 5.4.4. South America
- 5.4.5. Middle East and Africa
- 5.1. Market Analysis, Insights and Forecast - by Rice Type
- 6. North America Rice Syrup Market Analysis, Insights and Forecast, 2019-2031
- 6.1. Market Analysis, Insights and Forecast - by Rice Type
- 6.1.1. Brown Rice
- 6.1.2. White Rice
- 6.2. Market Analysis, Insights and Forecast - by Category
- 6.2.1. Organic
- 6.2.2. Conventional
- 6.3. Market Analysis, Insights and Forecast - by Application
- 6.3.1. Bakery and Confectionery
- 6.3.2. Beverages
- 6.3.3. Dessert and Dairy
- 6.3.4. Meat, Poultry, and Seafood
- 6.3.5. Instant Formula
- 6.3.6. Other Applications
- 6.1. Market Analysis, Insights and Forecast - by Rice Type
- 7. Europe Rice Syrup Market Analysis, Insights and Forecast, 2019-2031
- 7.1. Market Analysis, Insights and Forecast - by Rice Type
- 7.1.1. Brown Rice
- 7.1.2. White Rice
- 7.2. Market Analysis, Insights and Forecast - by Category
- 7.2.1. Organic
- 7.2.2. Conventional
- 7.3. Market Analysis, Insights and Forecast - by Application
- 7.3.1. Bakery and Confectionery
- 7.3.2. Beverages
- 7.3.3. Dessert and Dairy
- 7.3.4. Meat, Poultry, and Seafood
- 7.3.5. Instant Formula
- 7.3.6. Other Applications
- 7.1. Market Analysis, Insights and Forecast - by Rice Type
- 8. Asia Pacific Rice Syrup Market Analysis, Insights and Forecast, 2019-2031
- 8.1. Market Analysis, Insights and Forecast - by Rice Type
- 8.1.1. Brown Rice
- 8.1.2. White Rice
- 8.2. Market Analysis, Insights and Forecast - by Category
- 8.2.1. Organic
- 8.2.2. Conventional
- 8.3. Market Analysis, Insights and Forecast - by Application
- 8.3.1. Bakery and Confectionery
- 8.3.2. Beverages
- 8.3.3. Dessert and Dairy
- 8.3.4. Meat, Poultry, and Seafood
- 8.3.5. Instant Formula
- 8.3.6. Other Applications
- 8.1. Market Analysis, Insights and Forecast - by Rice Type
- 9. South America Rice Syrup Market Analysis, Insights and Forecast, 2019-2031
- 9.1. Market Analysis, Insights and Forecast - by Rice Type
- 9.1.1. Brown Rice
- 9.1.2. White Rice
- 9.2. Market Analysis, Insights and Forecast - by Category
- 9.2.1. Organic
- 9.2.2. Conventional
- 9.3. Market Analysis, Insights and Forecast - by Application
- 9.3.1. Bakery and Confectionery
- 9.3.2. Beverages
- 9.3.3. Dessert and Dairy
- 9.3.4. Meat, Poultry, and Seafood
- 9.3.5. Instant Formula
- 9.3.6. Other Applications
- 9.1. Market Analysis, Insights and Forecast - by Rice Type
- 10. Middle East and Africa Rice Syrup Market Analysis, Insights and Forecast, 2019-2031
- 10.1. Market Analysis, Insights and Forecast - by Rice Type
- 10.1.1. Brown Rice
- 10.1.2. White Rice
- 10.2. Market Analysis, Insights and Forecast - by Category
- 10.2.1. Organic
- 10.2.2. Conventional
- 10.3. Market Analysis, Insights and Forecast - by Application
- 10.3.1. Bakery and Confectionery
- 10.3.2. Beverages
- 10.3.3. Dessert and Dairy
- 10.3.4. Meat, Poultry, and Seafood
- 10.3.5. Instant Formula
- 10.3.6. Other Applications
- 10.1. Market Analysis, Insights and Forecast - by Rice Type
- 11. North America Rice Syrup Market Analysis, Insights and Forecast, 2019-2031
- 11.1. Market Analysis, Insights and Forecast - By Country/Sub-region
- 11.1.1 United States
- 11.1.2 Canada
- 11.1.3 Mexico
- 11.1.4 Rest of North America
- 12. Europe Rice Syrup Market Analysis, Insights and Forecast, 2019-2031
- 12.1. Market Analysis, Insights and Forecast - By Country/Sub-region
- 12.1.1 Germany
- 12.1.2 United Kingdom
- 12.1.3 France
- 12.1.4 Russia
- 12.1.5 Spain
- 12.1.6 Rest of Europe
- 13. Asia Pacific Rice Syrup Market Analysis, Insights and Forecast, 2019-2031
- 13.1. Market Analysis, Insights and Forecast - By Country/Sub-region
- 13.1.1 China
- 13.1.2 Japan
- 13.1.3 India
- 13.1.4 Australia
- 13.1.5 Rest of Asia Pacific
- 14. South America Rice Syrup Market Analysis, Insights and Forecast, 2019-2031
- 14.1. Market Analysis, Insights and Forecast - By Country/Sub-region
- 14.1.1 Brazil
- 14.1.2 Argentina
- 14.1.3 Rest of South America
- 15. Middle East and Africa Rice Syrup Market Analysis, Insights and Forecast, 2019-2031
- 15.1. Market Analysis, Insights and Forecast - By Country/Sub-region
- 15.1.1 Saudi Arabia
- 15.1.2 South Africa
- 15.1.3 Rest of Middle East and Africa
- 16. Competitive Analysis
- 16.1. Global Market Share Analysis 2024
- 16.2. Company Profiles
- 16.2.1 Cargill Incorporated
- 16.2.1.1. Overview
- 16.2.1.2. Products
- 16.2.1.3. SWOT Analysis
- 16.2.1.4. Recent Developments
- 16.2.1.5. Financials (Based on Availability)
- 16.2.2 Wuhu Deli Foods Co Ltd
- 16.2.2.1. Overview
- 16.2.2.2. Products
- 16.2.2.3. SWOT Analysis
- 16.2.2.4. Recent Developments
- 16.2.2.5. Financials (Based on Availability)
- 16.2.3 Bharat Gluco Industries Pvt Ltd*List Not Exhaustive
- 16.2.3.1. Overview
- 16.2.3.2. Products
- 16.2.3.3. SWOT Analysis
- 16.2.3.4. Recent Developments
- 16.2.3.5. Financials (Based on Availability)
- 16.2.4 Archer Daniels Midland Company
- 16.2.4.1. Overview
- 16.2.4.2. Products
- 16.2.4.3. SWOT Analysis
- 16.2.4.4. Recent Developments
- 16.2.4.5. Financials (Based on Availability)
- 16.2.5 Suzanne's Specialties Inc
- 16.2.5.1. Overview
- 16.2.5.2. Products
- 16.2.5.3. SWOT Analysis
- 16.2.5.4. Recent Developments
- 16.2.5.5. Financials (Based on Availability)
- 16.2.6 Pure Life Organic Foods Ltd
- 16.2.6.1. Overview
- 16.2.6.2. Products
- 16.2.6.3. SWOT Analysis
- 16.2.6.4. Recent Developments
- 16.2.6.5. Financials (Based on Availability)
- 16.2.7 Associated British Foods PLC
- 16.2.7.1. Overview
- 16.2.7.2. Products
- 16.2.7.3. SWOT Analysis
- 16.2.7.4. Recent Developments
- 16.2.7.5. Financials (Based on Availability)
- 16.2.8 Axiom Foods Inc
- 16.2.8.1. Overview
- 16.2.8.2. Products
- 16.2.8.3. SWOT Analysis
- 16.2.8.4. Recent Developments
- 16.2.8.5. Financials (Based on Availability)
- 16.2.9 California Natural Products Inc
- 16.2.9.1. Overview
- 16.2.9.2. Products
- 16.2.9.3. SWOT Analysis
- 16.2.9.4. Recent Developments
- 16.2.9.5. Financials (Based on Availability)
- 16.2.10 Gulshan Polyols Ltd
- 16.2.10.1. Overview
- 16.2.10.2. Products
- 16.2.10.3. SWOT Analysis
- 16.2.10.4. Recent Developments
- 16.2.10.5. Financials (Based on Availability)
- 16.2.1 Cargill Incorporated
List of Figures
- Figure 1: Global Rice Syrup Market Revenue Breakdown (Million, %) by Region 2024 & 2032
- Figure 2: Global Rice Syrup Market Volume Breakdown (Liters, %) by Region 2024 & 2032
- Figure 3: North America Rice Syrup Market Revenue (Million), by Country 2024 & 2032
- Figure 4: North America Rice Syrup Market Volume (Liters), by Country 2024 & 2032
- Figure 5: North America Rice Syrup Market Revenue Share (%), by Country 2024 & 2032
- Figure 6: North America Rice Syrup Market Volume Share (%), by Country 2024 & 2032
- Figure 7: Europe Rice Syrup Market Revenue (Million), by Country 2024 & 2032
- Figure 8: Europe Rice Syrup Market Volume (Liters), by Country 2024 & 2032
- Figure 9: Europe Rice Syrup Market Revenue Share (%), by Country 2024 & 2032
- Figure 10: Europe Rice Syrup Market Volume Share (%), by Country 2024 & 2032
- Figure 11: Asia Pacific Rice Syrup Market Revenue (Million), by Country 2024 & 2032
- Figure 12: Asia Pacific Rice Syrup Market Volume (Liters), by Country 2024 & 2032
- Figure 13: Asia Pacific Rice Syrup Market Revenue Share (%), by Country 2024 & 2032
- Figure 14: Asia Pacific Rice Syrup Market Volume Share (%), by Country 2024 & 2032
- Figure 15: South America Rice Syrup Market Revenue (Million), by Country 2024 & 2032
- Figure 16: South America Rice Syrup Market Volume (Liters), by Country 2024 & 2032
- Figure 17: South America Rice Syrup Market Revenue Share (%), by Country 2024 & 2032
- Figure 18: South America Rice Syrup Market Volume Share (%), by Country 2024 & 2032
- Figure 19: Middle East and Africa Rice Syrup Market Revenue (Million), by Country 2024 & 2032
- Figure 20: Middle East and Africa Rice Syrup Market Volume (Liters), by Country 2024 & 2032
- Figure 21: Middle East and Africa Rice Syrup Market Revenue Share (%), by Country 2024 & 2032
- Figure 22: Middle East and Africa Rice Syrup Market Volume Share (%), by Country 2024 & 2032
- Figure 23: North America Rice Syrup Market Revenue (Million), by Rice Type 2024 & 2032
- Figure 24: North America Rice Syrup Market Volume (Liters), by Rice Type 2024 & 2032
- Figure 25: North America Rice Syrup Market Revenue Share (%), by Rice Type 2024 & 2032
- Figure 26: North America Rice Syrup Market Volume Share (%), by Rice Type 2024 & 2032
- Figure 27: North America Rice Syrup Market Revenue (Million), by Category 2024 & 2032
- Figure 28: North America Rice Syrup Market Volume (Liters), by Category 2024 & 2032
- Figure 29: North America Rice Syrup Market Revenue Share (%), by Category 2024 & 2032
- Figure 30: North America Rice Syrup Market Volume Share (%), by Category 2024 & 2032
- Figure 31: North America Rice Syrup Market Revenue (Million), by Application 2024 & 2032
- Figure 32: North America Rice Syrup Market Volume (Liters), by Application 2024 & 2032
- Figure 33: North America Rice Syrup Market Revenue Share (%), by Application 2024 & 2032
- Figure 34: North America Rice Syrup Market Volume Share (%), by Application 2024 & 2032
- Figure 35: North America Rice Syrup Market Revenue (Million), by Country 2024 & 2032
- Figure 36: North America Rice Syrup Market Volume (Liters), by Country 2024 & 2032
- Figure 37: North America Rice Syrup Market Revenue Share (%), by Country 2024 & 2032
- Figure 38: North America Rice Syrup Market Volume Share (%), by Country 2024 & 2032
- Figure 39: Europe Rice Syrup Market Revenue (Million), by Rice Type 2024 & 2032
- Figure 40: Europe Rice Syrup Market Volume (Liters), by Rice Type 2024 & 2032
- Figure 41: Europe Rice Syrup Market Revenue Share (%), by Rice Type 2024 & 2032
- Figure 42: Europe Rice Syrup Market Volume Share (%), by Rice Type 2024 & 2032
- Figure 43: Europe Rice Syrup Market Revenue (Million), by Category 2024 & 2032
- Figure 44: Europe Rice Syrup Market Volume (Liters), by Category 2024 & 2032
- Figure 45: Europe Rice Syrup Market Revenue Share (%), by Category 2024 & 2032
- Figure 46: Europe Rice Syrup Market Volume Share (%), by Category 2024 & 2032
- Figure 47: Europe Rice Syrup Market Revenue (Million), by Application 2024 & 2032
- Figure 48: Europe Rice Syrup Market Volume (Liters), by Application 2024 & 2032
- Figure 49: Europe Rice Syrup Market Revenue Share (%), by Application 2024 & 2032
- Figure 50: Europe Rice Syrup Market Volume Share (%), by Application 2024 & 2032
- Figure 51: Europe Rice Syrup Market Revenue (Million), by Country 2024 & 2032
- Figure 52: Europe Rice Syrup Market Volume (Liters), by Country 2024 & 2032
- Figure 53: Europe Rice Syrup Market Revenue Share (%), by Country 2024 & 2032
- Figure 54: Europe Rice Syrup Market Volume Share (%), by Country 2024 & 2032
- Figure 55: Asia Pacific Rice Syrup Market Revenue (Million), by Rice Type 2024 & 2032
- Figure 56: Asia Pacific Rice Syrup Market Volume (Liters), by Rice Type 2024 & 2032
- Figure 57: Asia Pacific Rice Syrup Market Revenue Share (%), by Rice Type 2024 & 2032
- Figure 58: Asia Pacific Rice Syrup Market Volume Share (%), by Rice Type 2024 & 2032
- Figure 59: Asia Pacific Rice Syrup Market Revenue (Million), by Category 2024 & 2032
- Figure 60: Asia Pacific Rice Syrup Market Volume (Liters), by Category 2024 & 2032
- Figure 61: Asia Pacific Rice Syrup Market Revenue Share (%), by Category 2024 & 2032
- Figure 62: Asia Pacific Rice Syrup Market Volume Share (%), by Category 2024 & 2032
- Figure 63: Asia Pacific Rice Syrup Market Revenue (Million), by Application 2024 & 2032
- Figure 64: Asia Pacific Rice Syrup Market Volume (Liters), by Application 2024 & 2032
- Figure 65: Asia Pacific Rice Syrup Market Revenue Share (%), by Application 2024 & 2032
- Figure 66: Asia Pacific Rice Syrup Market Volume Share (%), by Application 2024 & 2032
- Figure 67: Asia Pacific Rice Syrup Market Revenue (Million), by Country 2024 & 2032
- Figure 68: Asia Pacific Rice Syrup Market Volume (Liters), by Country 2024 & 2032
- Figure 69: Asia Pacific Rice Syrup Market Revenue Share (%), by Country 2024 & 2032
- Figure 70: Asia Pacific Rice Syrup Market Volume Share (%), by Country 2024 & 2032
- Figure 71: South America Rice Syrup Market Revenue (Million), by Rice Type 2024 & 2032
- Figure 72: South America Rice Syrup Market Volume (Liters), by Rice Type 2024 & 2032
- Figure 73: South America Rice Syrup Market Revenue Share (%), by Rice Type 2024 & 2032
- Figure 74: South America Rice Syrup Market Volume Share (%), by Rice Type 2024 & 2032
- Figure 75: South America Rice Syrup Market Revenue (Million), by Category 2024 & 2032
- Figure 76: South America Rice Syrup Market Volume (Liters), by Category 2024 & 2032
- Figure 77: South America Rice Syrup Market Revenue Share (%), by Category 2024 & 2032
- Figure 78: South America Rice Syrup Market Volume Share (%), by Category 2024 & 2032
- Figure 79: South America Rice Syrup Market Revenue (Million), by Application 2024 & 2032
- Figure 80: South America Rice Syrup Market Volume (Liters), by Application 2024 & 2032
- Figure 81: South America Rice Syrup Market Revenue Share (%), by Application 2024 & 2032
- Figure 82: South America Rice Syrup Market Volume Share (%), by Application 2024 & 2032
- Figure 83: South America Rice Syrup Market Revenue (Million), by Country 2024 & 2032
- Figure 84: South America Rice Syrup Market Volume (Liters), by Country 2024 & 2032
- Figure 85: South America Rice Syrup Market Revenue Share (%), by Country 2024 & 2032
- Figure 86: South America Rice Syrup Market Volume Share (%), by Country 2024 & 2032
- Figure 87: Middle East and Africa Rice Syrup Market Revenue (Million), by Rice Type 2024 & 2032
- Figure 88: Middle East and Africa Rice Syrup Market Volume (Liters), by Rice Type 2024 & 2032
- Figure 89: Middle East and Africa Rice Syrup Market Revenue Share (%), by Rice Type 2024 & 2032
- Figure 90: Middle East and Africa Rice Syrup Market Volume Share (%), by Rice Type 2024 & 2032
- Figure 91: Middle East and Africa Rice Syrup Market Revenue (Million), by Category 2024 & 2032
- Figure 92: Middle East and Africa Rice Syrup Market Volume (Liters), by Category 2024 & 2032
- Figure 93: Middle East and Africa Rice Syrup Market Revenue Share (%), by Category 2024 & 2032
- Figure 94: Middle East and Africa Rice Syrup Market Volume Share (%), by Category 2024 & 2032
- Figure 95: Middle East and Africa Rice Syrup Market Revenue (Million), by Application 2024 & 2032
- Figure 96: Middle East and Africa Rice Syrup Market Volume (Liters), by Application 2024 & 2032
- Figure 97: Middle East and Africa Rice Syrup Market Revenue Share (%), by Application 2024 & 2032
- Figure 98: Middle East and Africa Rice Syrup Market Volume Share (%), by Application 2024 & 2032
- Figure 99: Middle East and Africa Rice Syrup Market Revenue (Million), by Country 2024 & 2032
- Figure 100: Middle East and Africa Rice Syrup Market Volume (Liters), by Country 2024 & 2032
- Figure 101: Middle East and Africa Rice Syrup Market Revenue Share (%), by Country 2024 & 2032
- Figure 102: Middle East and Africa Rice Syrup Market Volume Share (%), by Country 2024 & 2032
List of Tables
- Table 1: Global Rice Syrup Market Revenue Million Forecast, by Region 2019 & 2032
- Table 2: Global Rice Syrup Market Volume Liters Forecast, by Region 2019 & 2032
- Table 3: Global Rice Syrup Market Revenue Million Forecast, by Rice Type 2019 & 2032
- Table 4: Global Rice Syrup Market Volume Liters Forecast, by Rice Type 2019 & 2032
- Table 5: Global Rice Syrup Market Revenue Million Forecast, by Category 2019 & 2032
- Table 6: Global Rice Syrup Market Volume Liters Forecast, by Category 2019 & 2032
- Table 7: Global Rice Syrup Market Revenue Million Forecast, by Application 2019 & 2032
- Table 8: Global Rice Syrup Market Volume Liters Forecast, by Application 2019 & 2032
- Table 9: Global Rice Syrup Market Revenue Million Forecast, by Region 2019 & 2032
- Table 10: Global Rice Syrup Market Volume Liters Forecast, by Region 2019 & 2032
- Table 11: Global Rice Syrup Market Revenue Million Forecast, by Country 2019 & 2032
- Table 12: Global Rice Syrup Market Volume Liters Forecast, by Country 2019 & 2032
- Table 13: United States Rice Syrup Market Revenue (Million) Forecast, by Application 2019 & 2032
- Table 14: United States Rice Syrup Market Volume (Liters) Forecast, by Application 2019 & 2032
- Table 15: Canada Rice Syrup Market Revenue (Million) Forecast, by Application 2019 & 2032
- Table 16: Canada Rice Syrup Market Volume (Liters) Forecast, by Application 2019 & 2032
- Table 17: Mexico Rice Syrup Market Revenue (Million) Forecast, by Application 2019 & 2032
- Table 18: Mexico Rice Syrup Market Volume (Liters) Forecast, by Application 2019 & 2032
- Table 19: Rest of North America Rice Syrup Market Revenue (Million) Forecast, by Application 2019 & 2032
- Table 20: Rest of North America Rice Syrup Market Volume (Liters) Forecast, by Application 2019 & 2032
- Table 21: Global Rice Syrup Market Revenue Million Forecast, by Country 2019 & 2032
- Table 22: Global Rice Syrup Market Volume Liters Forecast, by Country 2019 & 2032
- Table 23: Germany Rice Syrup Market Revenue (Million) Forecast, by Application 2019 & 2032
- Table 24: Germany Rice Syrup Market Volume (Liters) Forecast, by Application 2019 & 2032
- Table 25: United Kingdom Rice Syrup Market Revenue (Million) Forecast, by Application 2019 & 2032
- Table 26: United Kingdom Rice Syrup Market Volume (Liters) Forecast, by Application 2019 & 2032
- Table 27: France Rice Syrup Market Revenue (Million) Forecast, by Application 2019 & 2032
- Table 28: France Rice Syrup Market Volume (Liters) Forecast, by Application 2019 & 2032
- Table 29: Russia Rice Syrup Market Revenue (Million) Forecast, by Application 2019 & 2032
- Table 30: Russia Rice Syrup Market Volume (Liters) Forecast, by Application 2019 & 2032
- Table 31: Spain Rice Syrup Market Revenue (Million) Forecast, by Application 2019 & 2032
- Table 32: Spain Rice Syrup Market Volume (Liters) Forecast, by Application 2019 & 2032
- Table 33: Rest of Europe Rice Syrup Market Revenue (Million) Forecast, by Application 2019 & 2032
- Table 34: Rest of Europe Rice Syrup Market Volume (Liters) Forecast, by Application 2019 & 2032
- Table 35: Global Rice Syrup Market Revenue Million Forecast, by Country 2019 & 2032
- Table 36: Global Rice Syrup Market Volume Liters Forecast, by Country 2019 & 2032
- Table 37: China Rice Syrup Market Revenue (Million) Forecast, by Application 2019 & 2032
- Table 38: China Rice Syrup Market Volume (Liters) Forecast, by Application 2019 & 2032
- Table 39: Japan Rice Syrup Market Revenue (Million) Forecast, by Application 2019 & 2032
- Table 40: Japan Rice Syrup Market Volume (Liters) Forecast, by Application 2019 & 2032
- Table 41: India Rice Syrup Market Revenue (Million) Forecast, by Application 2019 & 2032
- Table 42: India Rice Syrup Market Volume (Liters) Forecast, by Application 2019 & 2032
- Table 43: Australia Rice Syrup Market Revenue (Million) Forecast, by Application 2019 & 2032
- Table 44: Australia Rice Syrup Market Volume (Liters) Forecast, by Application 2019 & 2032
- Table 45: Rest of Asia Pacific Rice Syrup Market Revenue (Million) Forecast, by Application 2019 & 2032
- Table 46: Rest of Asia Pacific Rice Syrup Market Volume (Liters) Forecast, by Application 2019 & 2032
- Table 47: Global Rice Syrup Market Revenue Million Forecast, by Country 2019 & 2032
- Table 48: Global Rice Syrup Market Volume Liters Forecast, by Country 2019 & 2032
- Table 49: Brazil Rice Syrup Market Revenue (Million) Forecast, by Application 2019 & 2032
- Table 50: Brazil Rice Syrup Market Volume (Liters) Forecast, by Application 2019 & 2032
- Table 51: Argentina Rice Syrup Market Revenue (Million) Forecast, by Application 2019 & 2032
- Table 52: Argentina Rice Syrup Market Volume (Liters) Forecast, by Application 2019 & 2032
- Table 53: Rest of South America Rice Syrup Market Revenue (Million) Forecast, by Application 2019 & 2032
- Table 54: Rest of South America Rice Syrup Market Volume (Liters) Forecast, by Application 2019 & 2032
- Table 55: Global Rice Syrup Market Revenue Million Forecast, by Country 2019 & 2032
- Table 56: Global Rice Syrup Market Volume Liters Forecast, by Country 2019 & 2032
- Table 57: Saudi Arabia Rice Syrup Market Revenue (Million) Forecast, by Application 2019 & 2032
- Table 58: Saudi Arabia Rice Syrup Market Volume (Liters) Forecast, by Application 2019 & 2032
- Table 59: South Africa Rice Syrup Market Revenue (Million) Forecast, by Application 2019 & 2032
- Table 60: South Africa Rice Syrup Market Volume (Liters) Forecast, by Application 2019 & 2032
- Table 61: Rest of Middle East and Africa Rice Syrup Market Revenue (Million) Forecast, by Application 2019 & 2032
- Table 62: Rest of Middle East and Africa Rice Syrup Market Volume (Liters) Forecast, by Application 2019 & 2032
- Table 63: Global Rice Syrup Market Revenue Million Forecast, by Rice Type 2019 & 2032
- Table 64: Global Rice Syrup Market Volume Liters Forecast, by Rice Type 2019 & 2032
- Table 65: Global Rice Syrup Market Revenue Million Forecast, by Category 2019 & 2032
- Table 66: Global Rice Syrup Market Volume Liters Forecast, by Category 2019 & 2032
- Table 67: Global Rice Syrup Market Revenue Million Forecast, by Application 2019 & 2032
- Table 68: Global Rice Syrup Market Volume Liters Forecast, by Application 2019 & 2032
- Table 69: Global Rice Syrup Market Revenue Million Forecast, by Country 2019 & 2032
- Table 70: Global Rice Syrup Market Volume Liters Forecast, by Country 2019 & 2032
- Table 71: United States Rice Syrup Market Revenue (Million) Forecast, by Application 2019 & 2032
- Table 72: United States Rice Syrup Market Volume (Liters) Forecast, by Application 2019 & 2032
- Table 73: Canada Rice Syrup Market Revenue (Million) Forecast, by Application 2019 & 2032
- Table 74: Canada Rice Syrup Market Volume (Liters) Forecast, by Application 2019 & 2032
- Table 75: Mexico Rice Syrup Market Revenue (Million) Forecast, by Application 2019 & 2032
- Table 76: Mexico Rice Syrup Market Volume (Liters) Forecast, by Application 2019 & 2032
- Table 77: Rest of North America Rice Syrup Market Revenue (Million) Forecast, by Application 2019 & 2032
- Table 78: Rest of North America Rice Syrup Market Volume (Liters) Forecast, by Application 2019 & 2032
- Table 79: Global Rice Syrup Market Revenue Million Forecast, by Rice Type 2019 & 2032
- Table 80: Global Rice Syrup Market Volume Liters Forecast, by Rice Type 2019 & 2032
- Table 81: Global Rice Syrup Market Revenue Million Forecast, by Category 2019 & 2032
- Table 82: Global Rice Syrup Market Volume Liters Forecast, by Category 2019 & 2032
- Table 83: Global Rice Syrup Market Revenue Million Forecast, by Application 2019 & 2032
- Table 84: Global Rice Syrup Market Volume Liters Forecast, by Application 2019 & 2032
- Table 85: Global Rice Syrup Market Revenue Million Forecast, by Country 2019 & 2032
- Table 86: Global Rice Syrup Market Volume Liters Forecast, by Country 2019 & 2032
- Table 87: Germany Rice Syrup Market Revenue (Million) Forecast, by Application 2019 & 2032
- Table 88: Germany Rice Syrup Market Volume (Liters) Forecast, by Application 2019 & 2032
- Table 89: United Kingdom Rice Syrup Market Revenue (Million) Forecast, by Application 2019 & 2032
- Table 90: United Kingdom Rice Syrup Market Volume (Liters) Forecast, by Application 2019 & 2032
- Table 91: France Rice Syrup Market Revenue (Million) Forecast, by Application 2019 & 2032
- Table 92: France Rice Syrup Market Volume (Liters) Forecast, by Application 2019 & 2032
- Table 93: Russia Rice Syrup Market Revenue (Million) Forecast, by Application 2019 & 2032
- Table 94: Russia Rice Syrup Market Volume (Liters) Forecast, by Application 2019 & 2032
- Table 95: Spain Rice Syrup Market Revenue (Million) Forecast, by Application 2019 & 2032
- Table 96: Spain Rice Syrup Market Volume (Liters) Forecast, by Application 2019 & 2032
- Table 97: Rest of Europe Rice Syrup Market Revenue (Million) Forecast, by Application 2019 & 2032
- Table 98: Rest of Europe Rice Syrup Market Volume (Liters) Forecast, by Application 2019 & 2032
- Table 99: Global Rice Syrup Market Revenue Million Forecast, by Rice Type 2019 & 2032
- Table 100: Global Rice Syrup Market Volume Liters Forecast, by Rice Type 2019 & 2032
- Table 101: Global Rice Syrup Market Revenue Million Forecast, by Category 2019 & 2032
- Table 102: Global Rice Syrup Market Volume Liters Forecast, by Category 2019 & 2032
- Table 103: Global Rice Syrup Market Revenue Million Forecast, by Application 2019 & 2032
- Table 104: Global Rice Syrup Market Volume Liters Forecast, by Application 2019 & 2032
- Table 105: Global Rice Syrup Market Revenue Million Forecast, by Country 2019 & 2032
- Table 106: Global Rice Syrup Market Volume Liters Forecast, by Country 2019 & 2032
- Table 107: China Rice Syrup Market Revenue (Million) Forecast, by Application 2019 & 2032
- Table 108: China Rice Syrup Market Volume (Liters) Forecast, by Application 2019 & 2032
- Table 109: Japan Rice Syrup Market Revenue (Million) Forecast, by Application 2019 & 2032
- Table 110: Japan Rice Syrup Market Volume (Liters) Forecast, by Application 2019 & 2032
- Table 111: India Rice Syrup Market Revenue (Million) Forecast, by Application 2019 & 2032
- Table 112: India Rice Syrup Market Volume (Liters) Forecast, by Application 2019 & 2032
- Table 113: Australia Rice Syrup Market Revenue (Million) Forecast, by Application 2019 & 2032
- Table 114: Australia Rice Syrup Market Volume (Liters) Forecast, by Application 2019 & 2032
- Table 115: Rest of Asia Pacific Rice Syrup Market Revenue (Million) Forecast, by Application 2019 & 2032
- Table 116: Rest of Asia Pacific Rice Syrup Market Volume (Liters) Forecast, by Application 2019 & 2032
- Table 117: Global Rice Syrup Market Revenue Million Forecast, by Rice Type 2019 & 2032
- Table 118: Global Rice Syrup Market Volume Liters Forecast, by Rice Type 2019 & 2032
- Table 119: Global Rice Syrup Market Revenue Million Forecast, by Category 2019 & 2032
- Table 120: Global Rice Syrup Market Volume Liters Forecast, by Category 2019 & 2032
- Table 121: Global Rice Syrup Market Revenue Million Forecast, by Application 2019 & 2032
- Table 122: Global Rice Syrup Market Volume Liters Forecast, by Application 2019 & 2032
- Table 123: Global Rice Syrup Market Revenue Million Forecast, by Country 2019 & 2032
- Table 124: Global Rice Syrup Market Volume Liters Forecast, by Country 2019 & 2032
- Table 125: Brazil Rice Syrup Market Revenue (Million) Forecast, by Application 2019 & 2032
- Table 126: Brazil Rice Syrup Market Volume (Liters) Forecast, by Application 2019 & 2032
- Table 127: Argentina Rice Syrup Market Revenue (Million) Forecast, by Application 2019 & 2032
- Table 128: Argentina Rice Syrup Market Volume (Liters) Forecast, by Application 2019 & 2032
- Table 129: Rest of South America Rice Syrup Market Revenue (Million) Forecast, by Application 2019 & 2032
- Table 130: Rest of South America Rice Syrup Market Volume (Liters) Forecast, by Application 2019 & 2032
- Table 131: Global Rice Syrup Market Revenue Million Forecast, by Rice Type 2019 & 2032
- Table 132: Global Rice Syrup Market Volume Liters Forecast, by Rice Type 2019 & 2032
- Table 133: Global Rice Syrup Market Revenue Million Forecast, by Category 2019 & 2032
- Table 134: Global Rice Syrup Market Volume Liters Forecast, by Category 2019 & 2032
- Table 135: Global Rice Syrup Market Revenue Million Forecast, by Application 2019 & 2032
- Table 136: Global Rice Syrup Market Volume Liters Forecast, by Application 2019 & 2032
- Table 137: Global Rice Syrup Market Revenue Million Forecast, by Country 2019 & 2032
- Table 138: Global Rice Syrup Market Volume Liters Forecast, by Country 2019 & 2032
- Table 139: Saudi Arabia Rice Syrup Market Revenue (Million) Forecast, by Application 2019 & 2032
- Table 140: Saudi Arabia Rice Syrup Market Volume (Liters) Forecast, by Application 2019 & 2032
- Table 141: South Africa Rice Syrup Market Revenue (Million) Forecast, by Application 2019 & 2032
- Table 142: South Africa Rice Syrup Market Volume (Liters) Forecast, by Application 2019 & 2032
- Table 143: Rest of Middle East and Africa Rice Syrup Market Revenue (Million) Forecast, by Application 2019 & 2032
- Table 144: Rest of Middle East and Africa Rice Syrup Market Volume (Liters) Forecast, by Application 2019 & 2032
Frequently Asked Questions
1. What is the projected Compound Annual Growth Rate (CAGR) of the Rice Syrup Market?
The projected CAGR is approximately 4.10%.
2. Which companies are prominent players in the Rice Syrup Market?
Key companies in the market include Cargill Incorporated, Wuhu Deli Foods Co Ltd, Bharat Gluco Industries Pvt Ltd*List Not Exhaustive, Archer Daniels Midland Company, Suzanne's Specialties Inc, Pure Life Organic Foods Ltd, Associated British Foods PLC, Axiom Foods Inc, California Natural Products Inc, Gulshan Polyols Ltd.
3. What are the main segments of the Rice Syrup Market?
The market segments include Rice Type, Category , Application.
4. Can you provide details about the market size?
The market size is estimated to be USD 825.3 Million as of 2022.
5. What are some drivers contributing to market growth?
Increasing Demand For Convenience & Processed Food.
6. What are the notable trends driving market growth?
Rising Demand for Natural Sweetener.
7. Are there any restraints impacting market growth?
Increased Consumer Awareness On Side-Effects Of Chemical Additives.
8. Can you provide examples of recent developments in the market?
N/A
9. What pricing options are available for accessing the report?
Pricing options include single-user, multi-user, and enterprise licenses priced at USD 4750, USD 5250, and USD 8750 respectively.
10. Is the market size provided in terms of value or volume?
The market size is provided in terms of value, measured in Million and volume, measured in Liters.
11. Are there any specific market keywords associated with the report?
Yes, the market keyword associated with the report is "Rice Syrup Market," which aids in identifying and referencing the specific market segment covered.
12. How do I determine which pricing option suits my needs best?
The pricing options vary based on user requirements and access needs. Individual users may opt for single-user licenses, while businesses requiring broader access may choose multi-user or enterprise licenses for cost-effective access to the report.
13. Are there any additional resources or data provided in the Rice Syrup Market report?
While the report offers comprehensive insights, it's advisable to review the specific contents or supplementary materials provided to ascertain if additional resources or data are available.
14. How can I stay updated on further developments or reports in the Rice Syrup Market?
To stay informed about further developments, trends, and reports in the Rice Syrup Market, consider subscribing to industry newsletters, following relevant companies and organizations, or regularly checking reputable industry news sources and publications.
Methodology
Step 1 - Identification of Relevant Samples Size from Population Database


Step 2 - Approaches for Defining Global Market Size (Value, Volume* & Price*)

Note*: In applicable scenarios
Step 3 - Data Sources
Primary Research
- Web Analytics
- Survey Reports
- Research Institute
- Latest Research Reports
- Opinion Leaders
Secondary Research
- Annual Reports
- White Paper
- Latest Press Release
- Industry Association
- Paid Database
- Investor Presentations

Step 4 - Data Triangulation
Involves using different sources of information in order to increase the validity of a study
These sources are likely to be stakeholders in a program - participants, other researchers, program staff, other community members, and so on.
Then we put all data in single framework & apply various statistical tools to find out the dynamic on the market.
During the analysis stage, feedback from the stakeholder groups would be compared to determine areas of agreement as well as areas of divergence


