

Key Insights
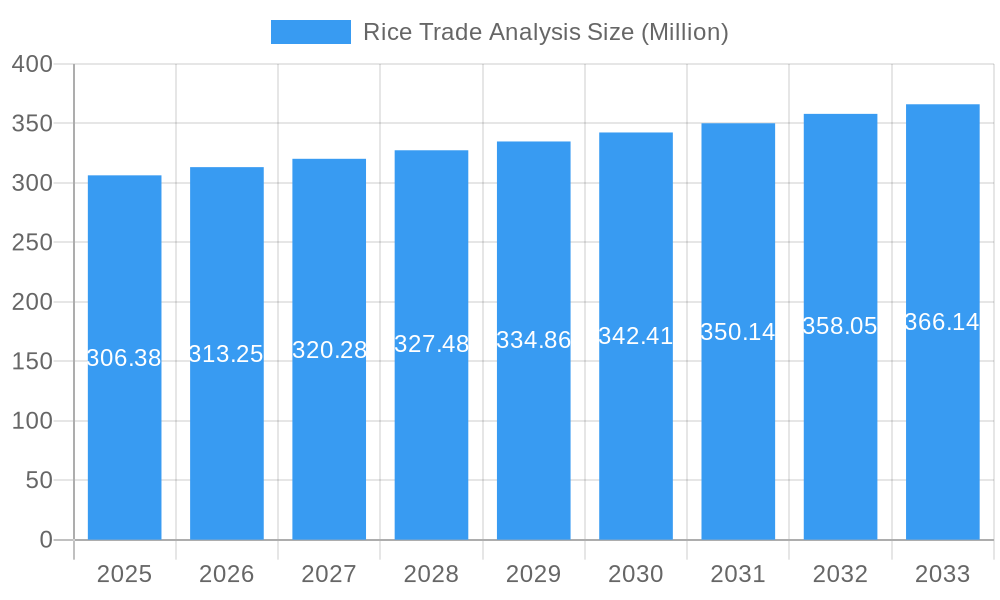
The global rice trade market, valued at $306.38 billion in 2025, is projected to experience steady growth with a Compound Annual Growth Rate (CAGR) of 2.20% from 2025 to 2033. This growth is driven by several factors. Rising global populations, particularly in Asia and Africa, consistently increase the demand for rice as a staple food. Growing urbanization and changing dietary habits are also contributing factors, with processed rice products and specialty rice varieties gaining popularity in both developed and developing nations. Furthermore, increasing livestock farming, particularly poultry and aquaculture, fuels demand for rice as livestock feed. However, the market faces certain challenges, including fluctuations in rice prices due to weather patterns and climate change impacting crop yields. Supply chain disruptions and geopolitical instability also pose risks to consistent market growth. The market is segmented by type (Hybrid Rice, Non-Basmati Rice, Specialty Rice including Organic and Aromatic varieties) and application (Food Processing, Household Consumption, Livestock Feed). Leading companies like Cargill, Adani Wilmar, and KRBL Ltd. are key players, leveraging their global reach and supply chain capabilities. Regional distribution showcases a concentration in the Asia-Pacific region, followed by significant demand in North America and Europe. The forecast period suggests continued market expansion, driven by factors mentioned above, albeit at a moderate pace reflecting the inherent complexities of agricultural commodity markets.
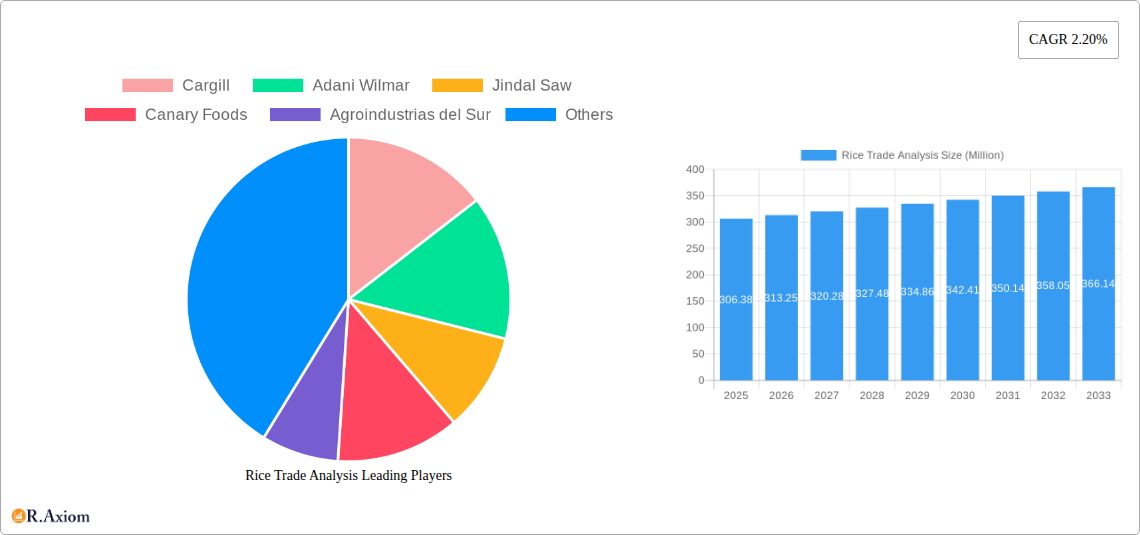
Rice Trade Analysis Market Size (In Million)
The competitive landscape is characterized by a mix of large multinational corporations and regional players. Major players focus on strategic partnerships, acquisitions, and investments in research and development to enhance product quality and expand their market share. The increasing demand for sustainable and ethically sourced rice is prompting companies to adopt environmentally friendly farming practices and transparent supply chains. This shift towards sustainability is expected to influence the market positively in the long term. Government policies and initiatives aimed at supporting domestic rice production and trade also play a significant role in shaping the market dynamics. Variations in production costs and export policies across regions affect the global pricing and trade patterns of rice. The future outlook for the rice trade market remains positive, albeit with moderate growth projections reflecting the intrinsic vulnerabilities of the agricultural sector to external factors.
Rice Trade Analysis Company Market Share
This comprehensive report provides a detailed analysis of the global rice trade market from 2019 to 2033, encompassing market size, segmentation, key players, and future trends. The study period covers the historical period (2019-2024), the base year (2025), and the forecast period (2025-2033). This report is essential for industry stakeholders, investors, and market researchers seeking actionable insights into this vital agricultural commodity market.
Rice Trade Analysis Market Concentration & Innovation
This section analyzes the competitive landscape of the rice trade market, examining market concentration, innovation drivers, regulatory frameworks, product substitutes, end-user trends, and mergers and acquisitions (M&A) activities. The market is characterized by a mix of large multinational corporations and regional players, resulting in moderate concentration. Key players such as Cargill, Adani Wilmar, and KRBL Ltd. hold significant market shares, estimated at xx%, xx%, and xx%, respectively, in 2025. However, smaller regional players and specialized producers of organic and aromatic rice also contribute to the market diversity.
Innovation in the rice trade sector is driven by advancements in rice cultivation techniques, including the development of hybrid rice varieties and improved farming practices. Technological disruptions such as precision agriculture and automation are enhancing efficiency and sustainability. Furthermore, evolving consumer preferences towards healthier and more convenient food options are driving innovation in rice processing and packaging. Regulatory frameworks vary across countries, influencing the trade dynamics and market access. The imposition of export duties and bans, as seen in India's recent policies, can significantly affect market supply and pricing.
The report also details M&A activity, with a focus on deal values and their impact on market consolidation. In the period 2019-2024, the total M&A deal value in the rice trade sector is estimated at approximately $xx Million. These transactions reflect strategic moves by major players to expand their geographic reach and product portfolios. Furthermore, the report analyzes the impact of product substitutes, such as other grains and alternative food sources, on the rice market. End-user trends, including growing urbanization and changing dietary habits, are also incorporated into the analysis.
Rice Trade Analysis Industry Trends & Insights
This section delves into the key trends shaping the rice trade market, encompassing market growth drivers, technological advancements, consumer preferences, and competitive dynamics. The global rice trade market is expected to experience a Compound Annual Growth Rate (CAGR) of xx% during the forecast period (2025-2033), driven by factors such as increasing global population, rising demand for staple foods, and the growing adoption of rice in various applications beyond household consumption. Market penetration of specialty rice, including organic and aromatic varieties, is expected to rise significantly, reaching xx% by 2033. Technological advancements such as improved farming techniques, enhanced processing technologies, and efficient logistics solutions are contributing to increased efficiency and productivity in the rice trade industry.
Changing consumer preferences, including the growing demand for convenience foods and healthier dietary options, are also influencing market dynamics. Competitive dynamics are shaped by factors such as pricing strategies, branding, and the ability to adapt to evolving market conditions. The report analyzes the competitive intensity in different regional markets and evaluates the competitive advantages of major players.
Dominant Markets & Segments in Rice Trade Analysis
This section identifies the dominant regions, countries, and segments within the rice trade market. Analysis is conducted based on rice type (Hybrid Rice, Non-Basmati Rice, Specialty Rice - Organic, Aromatic) and application (Food Processing, Household Consumption, Livestock Feed).
By Type: Non-Basmati rice dominates the global market due to its wide availability and affordability. However, the specialty rice segment, including organic and aromatic varieties, is experiencing the fastest growth, driven by increasing consumer demand for premium and healthier rice options. Hybrid rice also holds a significant share, especially in regions where high yields are crucial.
By Application: Household consumption remains the largest application segment, followed by food processing and livestock feed. The food processing sector is witnessing significant growth due to the increasing use of rice in various processed food products. Livestock feed application is expected to see moderate growth, fueled by the rising demand for animal feed worldwide.
Key Drivers for Dominant Segments:
- Economic Policies: Government policies related to agricultural subsidies, trade regulations, and food security initiatives significantly influence rice production and trade.
- Infrastructure: Efficient transportation and storage infrastructure is essential for effective rice trade. Improved infrastructure in key rice-producing and consuming regions contributes to market growth.
- Consumer Preferences: The shift toward healthier and more convenient foods drives the demand for specialty and processed rice products.
Rice Trade Analysis Product Developments
Recent years have witnessed significant advancements in rice processing and packaging technologies. Innovations focus on enhancing rice quality, extending shelf life, and optimizing production efficiency. The development of functional rice varieties with improved nutritional content is another key trend. These developments cater to evolving consumer preferences and increase the competitiveness of rice products in the global market. New applications of rice, such as in ready-to-eat meals and snacks, further broaden market opportunities.
Report Scope & Segmentation Analysis
This report segments the rice trade market based on Type (Hybrid Rice, Non-Basmati Rice, Specialty Rice (Organic, Aromatic)) and Application (Food Processing, Household Consumption, Livestock Feed). Each segment's market size, growth projections, and competitive dynamics are analyzed. For example, the Non-Basmati rice segment is expected to maintain a significant market share, but the Specialty Rice segment is anticipated to show the highest growth rate. Similarly, the Household Consumption segment holds the largest share in the Application segment, but food processing is expected to show substantial growth in the coming years.
Key Drivers of Rice Trade Analysis Growth
The growth of the rice trade market is driven by several key factors. Increasing global population and rising per capita income are increasing the demand for staple foods. Furthermore, the growing adoption of rice in various food products and the expansion of the processed food industry are boosting market demand. Government policies, including agricultural subsidies and trade agreements, also play a significant role in shaping market growth. Technological advancements such as improved rice cultivation techniques and efficient processing technologies are enhancing productivity and efficiency.
Challenges in the Rice Trade Analysis Sector
The rice trade sector faces several challenges, including climate change impacting rice yields, fluctuating commodity prices, and supply chain disruptions. These factors can lead to price volatility and affect market stability. Government regulations and trade policies can also present barriers to market access. Furthermore, intense competition among producers and exporters requires continuous adaptation and innovation to maintain market share. The estimated impact of these challenges on the overall market growth is approximately xx% reduction.
Emerging Opportunities in Rice Trade Analysis
The rice trade market offers several emerging opportunities. The increasing demand for functional foods and organic products presents a significant growth potential for specialty rice. Expanding into new markets, particularly in developing countries with a growing population, provides opportunities for increased sales and market penetration. Investing in sustainable rice farming practices and adopting advanced processing technologies can provide a competitive advantage. Finally, strategic partnerships and collaborations can drive innovation and market expansion.
Leading Players in the Rice Trade Analysis Market
- Cargill Cargill
- Adani Wilmar Adani Wilmar
- Jindal Saw
- Canary Foods
- Agroindustrias del Sur
- Saurer
- KRBL Ltd KRBL Ltd
- Vigoro
- Thai Binh Rice
- Agroindustrial Rueda
Key Developments in Rice Trade Analysis Industry
- September 2022: India banned the export of broken rice and imposed a 20% export duty on non-basmati rice. This significantly impacted global rice supply and prices.
- August 2022: The Indian government announced the procurement of 51.8 Million tons of rice for the 2022-2023 season, influencing domestic prices and market dynamics.
- February 2022: China implemented a minimum price for rice, limiting the volume purchased at the minimum price to 50 Million tons. This policy aimed to stabilize domestic prices and support rice producers.
Strategic Outlook for Rice Trade Analysis Market
The rice trade market is poised for continued growth, driven by increasing global demand and ongoing advancements in rice cultivation, processing, and trade. Opportunities lie in expanding into new markets, developing innovative rice products, and adopting sustainable practices. Strategic partnerships and investments in technology will be crucial for success in the competitive rice trade landscape. The market's long-term growth trajectory remains positive, promising significant returns for businesses that adapt to changing market dynamics and consumer preferences.
Rice Trade Analysis Segmentation
- 1. Production Analysis
- 2. Consumption Analysis
- 3. Import Market Analysis (Value & Volume)
- 4. Export Market Analysis (Value & Volume)
- 5. Price Trend Analysis
Rice Trade Analysis Segmentation By Geography
-
1. North America
- 1.1. United States
- 1.2. Canada
-
2. Europe
- 2.1. France
- 2.2. United Kingdom
- 2.3. Germany
- 2.4. Italy
- 2.5. Spain
-
3. Asia Pacific
- 3.1. China
- 3.2. India
- 3.3. Thailand
- 3.4. Vietnam
- 3.5. Pakistan
-
4. South America
- 4.1. Brazil
- 4.2. Argentina
-
5. Africa
- 5.1. South Africa
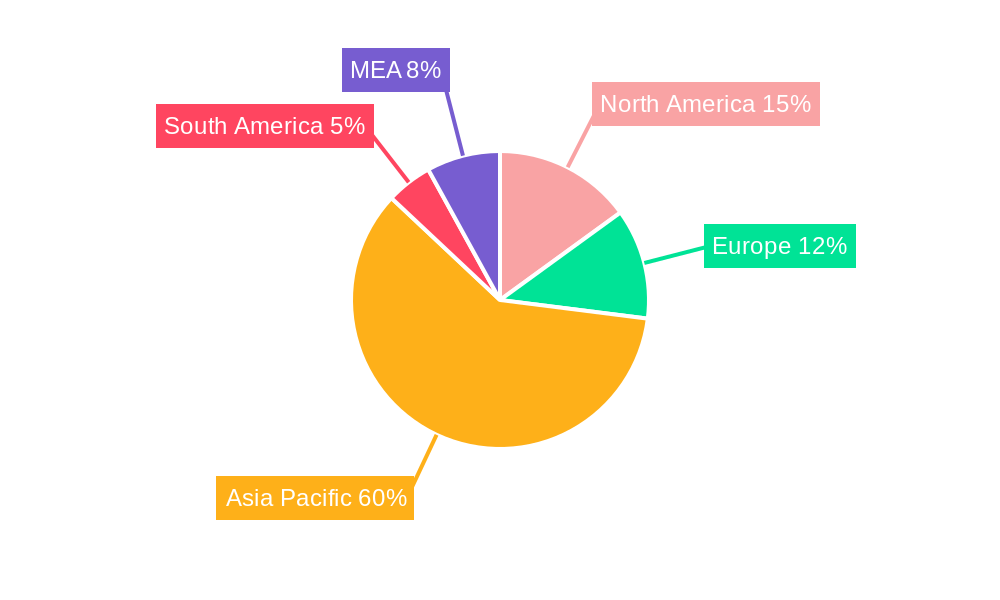
Rice Trade Analysis Regional Market Share
Geographic Coverage of Rice Trade Analysis
Rice Trade Analysis REPORT HIGHLIGHTS
| Aspects | Details |
|---|---|
| Study Period | 2020-2034 |
| Base Year | 2025 |
| Estimated Year | 2026 |
| Forecast Period | 2026-2034 |
| Historical Period | 2020-2025 |
| Growth Rate | CAGR of 2.20% from 2020-2034 |
| Segmentation |
|
Table of Contents
- 1. Introduction
- 1.1. Research Scope
- 1.2. Market Segmentation
- 1.3. Research Objective
- 1.4. Definitions and Assumptions
- 2. Executive Summary
- 2.1. Market Snapshot
- 3. Market Dynamics
- 3.1. Market Drivers
- 3.2. Market Restrains
- 3.3. Market Trends
- 3.4. Market Opportunities
- 4. Market Factor Analysis
- 4.1. Porters Five Forces
- 4.1.1. Bargaining Power of Suppliers
- 4.1.2. Bargaining Power of Buyers
- 4.1.3. Threat of New Entrants
- 4.1.4. Threat of Substitutes
- 4.1.5. Competitive Rivalry
- 4.2. PESTEL analysis
- 4.3. BCG Analysis
- 4.3.1. Stars (High Growth, High Market Share)
- 4.3.2. Cash Cows (Low Growth, High Market Share)
- 4.3.3. Question Mark (High Growth, Low Market Share)
- 4.3.4. Dogs (Low Growth, Low Market Share)
- 4.4. Ansoff Matrix Analysis
- 4.5. Supply Chain Analysis
- 4.6. Regulatory Landscape
- 4.7. Current Market Potential and Opportunity Assessment (TAM–SAM–SOM Framework)
- 4.8. RAX Analyst Note
- 4.1. Porters Five Forces
- 5. Market Analysis, Insights and Forecast 2021-2033
- 5.1. Market Analysis, Insights and Forecast - by Production Analysis
- 5.2. Market Analysis, Insights and Forecast - by Consumption Analysis
- 5.3. Market Analysis, Insights and Forecast - by Import Market Analysis (Value & Volume)
- 5.4. Market Analysis, Insights and Forecast - by Export Market Analysis (Value & Volume)
- 5.5. Market Analysis, Insights and Forecast - by Price Trend Analysis
- 5.6. Market Analysis, Insights and Forecast - by Region
- 5.6.1. North America
- 5.6.2. Europe
- 5.6.3. Asia Pacific
- 5.6.4. South America
- 5.6.5. Africa
- 6. Global Rice Trade Analysis Analysis, Insights and Forecast, 2021-2033
- 6.1. Market Analysis, Insights and Forecast - by Production Analysis
- 6.2. Market Analysis, Insights and Forecast - by Consumption Analysis
- 6.3. Market Analysis, Insights and Forecast - by Import Market Analysis (Value & Volume)
- 6.4. Market Analysis, Insights and Forecast - by Export Market Analysis (Value & Volume)
- 6.5. Market Analysis, Insights and Forecast - by Price Trend Analysis
- 7. North America Rice Trade Analysis Analysis, Insights and Forecast, 2020-2032
- 7.1. Market Analysis, Insights and Forecast - by Production Analysis
- 7.2. Market Analysis, Insights and Forecast - by Consumption Analysis
- 7.3. Market Analysis, Insights and Forecast - by Import Market Analysis (Value & Volume)
- 7.4. Market Analysis, Insights and Forecast - by Export Market Analysis (Value & Volume)
- 7.5. Market Analysis, Insights and Forecast - by Price Trend Analysis
- 8. Europe Rice Trade Analysis Analysis, Insights and Forecast, 2020-2032
- 8.1. Market Analysis, Insights and Forecast - by Production Analysis
- 8.2. Market Analysis, Insights and Forecast - by Consumption Analysis
- 8.3. Market Analysis, Insights and Forecast - by Import Market Analysis (Value & Volume)
- 8.4. Market Analysis, Insights and Forecast - by Export Market Analysis (Value & Volume)
- 8.5. Market Analysis, Insights and Forecast - by Price Trend Analysis
- 9. Asia Pacific Rice Trade Analysis Analysis, Insights and Forecast, 2020-2032
- 9.1. Market Analysis, Insights and Forecast - by Production Analysis
- 9.2. Market Analysis, Insights and Forecast - by Consumption Analysis
- 9.3. Market Analysis, Insights and Forecast - by Import Market Analysis (Value & Volume)
- 9.4. Market Analysis, Insights and Forecast - by Export Market Analysis (Value & Volume)
- 9.5. Market Analysis, Insights and Forecast - by Price Trend Analysis
- 10. South America Rice Trade Analysis Analysis, Insights and Forecast, 2020-2032
- 10.1. Market Analysis, Insights and Forecast - by Production Analysis
- 10.2. Market Analysis, Insights and Forecast - by Consumption Analysis
- 10.3. Market Analysis, Insights and Forecast - by Import Market Analysis (Value & Volume)
- 10.4. Market Analysis, Insights and Forecast - by Export Market Analysis (Value & Volume)
- 10.5. Market Analysis, Insights and Forecast - by Price Trend Analysis
- 11. Africa Rice Trade Analysis Analysis, Insights and Forecast, 2020-2032
- 11.1. Market Analysis, Insights and Forecast - by Production Analysis
- 11.2. Market Analysis, Insights and Forecast - by Consumption Analysis
- 11.3. Market Analysis, Insights and Forecast - by Import Market Analysis (Value & Volume)
- 11.4. Market Analysis, Insights and Forecast - by Export Market Analysis (Value & Volume)
- 11.5. Market Analysis, Insights and Forecast - by Price Trend Analysis
- 12. Competitive Analysis
- 12.1. Company Profiles
- 12.1.1 Cargill
- 12.1.1.1. Company Overview
- 12.1.1.2. Products
- 12.1.1.3. Company Financials
- 12.1.1.4. SWOT Analysis
- 12.1.2 Adani Wilmar
- 12.1.2.1. Company Overview
- 12.1.2.2. Products
- 12.1.2.3. Company Financials
- 12.1.2.4. SWOT Analysis
- 12.1.3 Jindal Saw
- 12.1.3.1. Company Overview
- 12.1.3.2. Products
- 12.1.3.3. Company Financials
- 12.1.3.4. SWOT Analysis
- 12.1.4 Canary Foods
- 12.1.4.1. Company Overview
- 12.1.4.2. Products
- 12.1.4.3. Company Financials
- 12.1.4.4. SWOT Analysis
- 12.1.5 Agroindustrias del Sur
- 12.1.5.1. Company Overview
- 12.1.5.2. Products
- 12.1.5.3. Company Financials
- 12.1.5.4. SWOT Analysis
- 12.1.6 Saurer
- 12.1.6.1. Company Overview
- 12.1.6.2. Products
- 12.1.6.3. Company Financials
- 12.1.6.4. SWOT Analysis
- 12.1.7 KRBL Ltd
- 12.1.7.1. Company Overview
- 12.1.7.2. Products
- 12.1.7.3. Company Financials
- 12.1.7.4. SWOT Analysis
- 12.1.8 Vigoro
- 12.1.8.1. Company Overview
- 12.1.8.2. Products
- 12.1.8.3. Company Financials
- 12.1.8.4. SWOT Analysis
- 12.1.9 Thai Binh Rice
- 12.1.9.1. Company Overview
- 12.1.9.2. Products
- 12.1.9.3. Company Financials
- 12.1.9.4. SWOT Analysis
- 12.1.10 Agroindustrial Rueda
- 12.1.10.1. Company Overview
- 12.1.10.2. Products
- 12.1.10.3. Company Financials
- 12.1.10.4. SWOT Analysis
- 12.1.1 Cargill
- 12.2. Market Entropy
- 12.2.1 Company's Key Areas Served
- 12.2.2 Recent Developments
- 12.3. Company Market Share Analysis 2025
- 12.3.1 Top 5 Companies Market Share Analysis
- 12.3.2 Top 3 Companies Market Share Analysis
- 12.4. List of Potential Customers
- 13. Research Methodology
List of Figures
- Figure 1: Global Rice Trade Analysis Revenue Breakdown (Million, %) by Region 2025 & 2033
- Figure 2: Global Rice Trade Analysis Volume Breakdown (Kiloton, %) by Region 2025 & 2033
- Figure 3: North America Rice Trade Analysis Revenue (Million), by Production Analysis 2025 & 2033
- Figure 4: North America Rice Trade Analysis Volume (Kiloton), by Production Analysis 2025 & 2033
- Figure 5: North America Rice Trade Analysis Revenue Share (%), by Production Analysis 2025 & 2033
- Figure 6: North America Rice Trade Analysis Volume Share (%), by Production Analysis 2025 & 2033
- Figure 7: North America Rice Trade Analysis Revenue (Million), by Consumption Analysis 2025 & 2033
- Figure 8: North America Rice Trade Analysis Volume (Kiloton), by Consumption Analysis 2025 & 2033
- Figure 9: North America Rice Trade Analysis Revenue Share (%), by Consumption Analysis 2025 & 2033
- Figure 10: North America Rice Trade Analysis Volume Share (%), by Consumption Analysis 2025 & 2033
- Figure 11: North America Rice Trade Analysis Revenue (Million), by Import Market Analysis (Value & Volume) 2025 & 2033
- Figure 12: North America Rice Trade Analysis Volume (Kiloton), by Import Market Analysis (Value & Volume) 2025 & 2033
- Figure 13: North America Rice Trade Analysis Revenue Share (%), by Import Market Analysis (Value & Volume) 2025 & 2033
- Figure 14: North America Rice Trade Analysis Volume Share (%), by Import Market Analysis (Value & Volume) 2025 & 2033
- Figure 15: North America Rice Trade Analysis Revenue (Million), by Export Market Analysis (Value & Volume) 2025 & 2033
- Figure 16: North America Rice Trade Analysis Volume (Kiloton), by Export Market Analysis (Value & Volume) 2025 & 2033
- Figure 17: North America Rice Trade Analysis Revenue Share (%), by Export Market Analysis (Value & Volume) 2025 & 2033
- Figure 18: North America Rice Trade Analysis Volume Share (%), by Export Market Analysis (Value & Volume) 2025 & 2033
- Figure 19: North America Rice Trade Analysis Revenue (Million), by Price Trend Analysis 2025 & 2033
- Figure 20: North America Rice Trade Analysis Volume (Kiloton), by Price Trend Analysis 2025 & 2033
- Figure 21: North America Rice Trade Analysis Revenue Share (%), by Price Trend Analysis 2025 & 2033
- Figure 22: North America Rice Trade Analysis Volume Share (%), by Price Trend Analysis 2025 & 2033
- Figure 23: North America Rice Trade Analysis Revenue (Million), by Country 2025 & 2033
- Figure 24: North America Rice Trade Analysis Volume (Kiloton), by Country 2025 & 2033
- Figure 25: North America Rice Trade Analysis Revenue Share (%), by Country 2025 & 2033
- Figure 26: North America Rice Trade Analysis Volume Share (%), by Country 2025 & 2033
- Figure 27: Europe Rice Trade Analysis Revenue (Million), by Production Analysis 2025 & 2033
- Figure 28: Europe Rice Trade Analysis Volume (Kiloton), by Production Analysis 2025 & 2033
- Figure 29: Europe Rice Trade Analysis Revenue Share (%), by Production Analysis 2025 & 2033
- Figure 30: Europe Rice Trade Analysis Volume Share (%), by Production Analysis 2025 & 2033
- Figure 31: Europe Rice Trade Analysis Revenue (Million), by Consumption Analysis 2025 & 2033
- Figure 32: Europe Rice Trade Analysis Volume (Kiloton), by Consumption Analysis 2025 & 2033
- Figure 33: Europe Rice Trade Analysis Revenue Share (%), by Consumption Analysis 2025 & 2033
- Figure 34: Europe Rice Trade Analysis Volume Share (%), by Consumption Analysis 2025 & 2033
- Figure 35: Europe Rice Trade Analysis Revenue (Million), by Import Market Analysis (Value & Volume) 2025 & 2033
- Figure 36: Europe Rice Trade Analysis Volume (Kiloton), by Import Market Analysis (Value & Volume) 2025 & 2033
- Figure 37: Europe Rice Trade Analysis Revenue Share (%), by Import Market Analysis (Value & Volume) 2025 & 2033
- Figure 38: Europe Rice Trade Analysis Volume Share (%), by Import Market Analysis (Value & Volume) 2025 & 2033
- Figure 39: Europe Rice Trade Analysis Revenue (Million), by Export Market Analysis (Value & Volume) 2025 & 2033
- Figure 40: Europe Rice Trade Analysis Volume (Kiloton), by Export Market Analysis (Value & Volume) 2025 & 2033
- Figure 41: Europe Rice Trade Analysis Revenue Share (%), by Export Market Analysis (Value & Volume) 2025 & 2033
- Figure 42: Europe Rice Trade Analysis Volume Share (%), by Export Market Analysis (Value & Volume) 2025 & 2033
- Figure 43: Europe Rice Trade Analysis Revenue (Million), by Price Trend Analysis 2025 & 2033
- Figure 44: Europe Rice Trade Analysis Volume (Kiloton), by Price Trend Analysis 2025 & 2033
- Figure 45: Europe Rice Trade Analysis Revenue Share (%), by Price Trend Analysis 2025 & 2033
- Figure 46: Europe Rice Trade Analysis Volume Share (%), by Price Trend Analysis 2025 & 2033
- Figure 47: Europe Rice Trade Analysis Revenue (Million), by Country 2025 & 2033
- Figure 48: Europe Rice Trade Analysis Volume (Kiloton), by Country 2025 & 2033
- Figure 49: Europe Rice Trade Analysis Revenue Share (%), by Country 2025 & 2033
- Figure 50: Europe Rice Trade Analysis Volume Share (%), by Country 2025 & 2033
- Figure 51: Asia Pacific Rice Trade Analysis Revenue (Million), by Production Analysis 2025 & 2033
- Figure 52: Asia Pacific Rice Trade Analysis Volume (Kiloton), by Production Analysis 2025 & 2033
- Figure 53: Asia Pacific Rice Trade Analysis Revenue Share (%), by Production Analysis 2025 & 2033
- Figure 54: Asia Pacific Rice Trade Analysis Volume Share (%), by Production Analysis 2025 & 2033
- Figure 55: Asia Pacific Rice Trade Analysis Revenue (Million), by Consumption Analysis 2025 & 2033
- Figure 56: Asia Pacific Rice Trade Analysis Volume (Kiloton), by Consumption Analysis 2025 & 2033
- Figure 57: Asia Pacific Rice Trade Analysis Revenue Share (%), by Consumption Analysis 2025 & 2033
- Figure 58: Asia Pacific Rice Trade Analysis Volume Share (%), by Consumption Analysis 2025 & 2033
- Figure 59: Asia Pacific Rice Trade Analysis Revenue (Million), by Import Market Analysis (Value & Volume) 2025 & 2033
- Figure 60: Asia Pacific Rice Trade Analysis Volume (Kiloton), by Import Market Analysis (Value & Volume) 2025 & 2033
- Figure 61: Asia Pacific Rice Trade Analysis Revenue Share (%), by Import Market Analysis (Value & Volume) 2025 & 2033
- Figure 62: Asia Pacific Rice Trade Analysis Volume Share (%), by Import Market Analysis (Value & Volume) 2025 & 2033
- Figure 63: Asia Pacific Rice Trade Analysis Revenue (Million), by Export Market Analysis (Value & Volume) 2025 & 2033
- Figure 64: Asia Pacific Rice Trade Analysis Volume (Kiloton), by Export Market Analysis (Value & Volume) 2025 & 2033
- Figure 65: Asia Pacific Rice Trade Analysis Revenue Share (%), by Export Market Analysis (Value & Volume) 2025 & 2033
- Figure 66: Asia Pacific Rice Trade Analysis Volume Share (%), by Export Market Analysis (Value & Volume) 2025 & 2033
- Figure 67: Asia Pacific Rice Trade Analysis Revenue (Million), by Price Trend Analysis 2025 & 2033
- Figure 68: Asia Pacific Rice Trade Analysis Volume (Kiloton), by Price Trend Analysis 2025 & 2033
- Figure 69: Asia Pacific Rice Trade Analysis Revenue Share (%), by Price Trend Analysis 2025 & 2033
- Figure 70: Asia Pacific Rice Trade Analysis Volume Share (%), by Price Trend Analysis 2025 & 2033
- Figure 71: Asia Pacific Rice Trade Analysis Revenue (Million), by Country 2025 & 2033
- Figure 72: Asia Pacific Rice Trade Analysis Volume (Kiloton), by Country 2025 & 2033
- Figure 73: Asia Pacific Rice Trade Analysis Revenue Share (%), by Country 2025 & 2033
- Figure 74: Asia Pacific Rice Trade Analysis Volume Share (%), by Country 2025 & 2033
- Figure 75: South America Rice Trade Analysis Revenue (Million), by Production Analysis 2025 & 2033
- Figure 76: South America Rice Trade Analysis Volume (Kiloton), by Production Analysis 2025 & 2033
- Figure 77: South America Rice Trade Analysis Revenue Share (%), by Production Analysis 2025 & 2033
- Figure 78: South America Rice Trade Analysis Volume Share (%), by Production Analysis 2025 & 2033
- Figure 79: South America Rice Trade Analysis Revenue (Million), by Consumption Analysis 2025 & 2033
- Figure 80: South America Rice Trade Analysis Volume (Kiloton), by Consumption Analysis 2025 & 2033
- Figure 81: South America Rice Trade Analysis Revenue Share (%), by Consumption Analysis 2025 & 2033
- Figure 82: South America Rice Trade Analysis Volume Share (%), by Consumption Analysis 2025 & 2033
- Figure 83: South America Rice Trade Analysis Revenue (Million), by Import Market Analysis (Value & Volume) 2025 & 2033
- Figure 84: South America Rice Trade Analysis Volume (Kiloton), by Import Market Analysis (Value & Volume) 2025 & 2033
- Figure 85: South America Rice Trade Analysis Revenue Share (%), by Import Market Analysis (Value & Volume) 2025 & 2033
- Figure 86: South America Rice Trade Analysis Volume Share (%), by Import Market Analysis (Value & Volume) 2025 & 2033
- Figure 87: South America Rice Trade Analysis Revenue (Million), by Export Market Analysis (Value & Volume) 2025 & 2033
- Figure 88: South America Rice Trade Analysis Volume (Kiloton), by Export Market Analysis (Value & Volume) 2025 & 2033
- Figure 89: South America Rice Trade Analysis Revenue Share (%), by Export Market Analysis (Value & Volume) 2025 & 2033
- Figure 90: South America Rice Trade Analysis Volume Share (%), by Export Market Analysis (Value & Volume) 2025 & 2033
- Figure 91: South America Rice Trade Analysis Revenue (Million), by Price Trend Analysis 2025 & 2033
- Figure 92: South America Rice Trade Analysis Volume (Kiloton), by Price Trend Analysis 2025 & 2033
- Figure 93: South America Rice Trade Analysis Revenue Share (%), by Price Trend Analysis 2025 & 2033
- Figure 94: South America Rice Trade Analysis Volume Share (%), by Price Trend Analysis 2025 & 2033
- Figure 95: South America Rice Trade Analysis Revenue (Million), by Country 2025 & 2033
- Figure 96: South America Rice Trade Analysis Volume (Kiloton), by Country 2025 & 2033
- Figure 97: South America Rice Trade Analysis Revenue Share (%), by Country 2025 & 2033
- Figure 98: South America Rice Trade Analysis Volume Share (%), by Country 2025 & 2033
- Figure 99: Africa Rice Trade Analysis Revenue (Million), by Production Analysis 2025 & 2033
- Figure 100: Africa Rice Trade Analysis Volume (Kiloton), by Production Analysis 2025 & 2033
- Figure 101: Africa Rice Trade Analysis Revenue Share (%), by Production Analysis 2025 & 2033
- Figure 102: Africa Rice Trade Analysis Volume Share (%), by Production Analysis 2025 & 2033
- Figure 103: Africa Rice Trade Analysis Revenue (Million), by Consumption Analysis 2025 & 2033
- Figure 104: Africa Rice Trade Analysis Volume (Kiloton), by Consumption Analysis 2025 & 2033
- Figure 105: Africa Rice Trade Analysis Revenue Share (%), by Consumption Analysis 2025 & 2033
- Figure 106: Africa Rice Trade Analysis Volume Share (%), by Consumption Analysis 2025 & 2033
- Figure 107: Africa Rice Trade Analysis Revenue (Million), by Import Market Analysis (Value & Volume) 2025 & 2033
- Figure 108: Africa Rice Trade Analysis Volume (Kiloton), by Import Market Analysis (Value & Volume) 2025 & 2033
- Figure 109: Africa Rice Trade Analysis Revenue Share (%), by Import Market Analysis (Value & Volume) 2025 & 2033
- Figure 110: Africa Rice Trade Analysis Volume Share (%), by Import Market Analysis (Value & Volume) 2025 & 2033
- Figure 111: Africa Rice Trade Analysis Revenue (Million), by Export Market Analysis (Value & Volume) 2025 & 2033
- Figure 112: Africa Rice Trade Analysis Volume (Kiloton), by Export Market Analysis (Value & Volume) 2025 & 2033
- Figure 113: Africa Rice Trade Analysis Revenue Share (%), by Export Market Analysis (Value & Volume) 2025 & 2033
- Figure 114: Africa Rice Trade Analysis Volume Share (%), by Export Market Analysis (Value & Volume) 2025 & 2033
- Figure 115: Africa Rice Trade Analysis Revenue (Million), by Price Trend Analysis 2025 & 2033
- Figure 116: Africa Rice Trade Analysis Volume (Kiloton), by Price Trend Analysis 2025 & 2033
- Figure 117: Africa Rice Trade Analysis Revenue Share (%), by Price Trend Analysis 2025 & 2033
- Figure 118: Africa Rice Trade Analysis Volume Share (%), by Price Trend Analysis 2025 & 2033
- Figure 119: Africa Rice Trade Analysis Revenue (Million), by Country 2025 & 2033
- Figure 120: Africa Rice Trade Analysis Volume (Kiloton), by Country 2025 & 2033
- Figure 121: Africa Rice Trade Analysis Revenue Share (%), by Country 2025 & 2033
- Figure 122: Africa Rice Trade Analysis Volume Share (%), by Country 2025 & 2033
List of Tables
- Table 1: Global Rice Trade Analysis Revenue Million Forecast, by Production Analysis 2020 & 2033
- Table 2: Global Rice Trade Analysis Volume Kiloton Forecast, by Production Analysis 2020 & 2033
- Table 3: Global Rice Trade Analysis Revenue Million Forecast, by Consumption Analysis 2020 & 2033
- Table 4: Global Rice Trade Analysis Volume Kiloton Forecast, by Consumption Analysis 2020 & 2033
- Table 5: Global Rice Trade Analysis Revenue Million Forecast, by Import Market Analysis (Value & Volume) 2020 & 2033
- Table 6: Global Rice Trade Analysis Volume Kiloton Forecast, by Import Market Analysis (Value & Volume) 2020 & 2033
- Table 7: Global Rice Trade Analysis Revenue Million Forecast, by Export Market Analysis (Value & Volume) 2020 & 2033
- Table 8: Global Rice Trade Analysis Volume Kiloton Forecast, by Export Market Analysis (Value & Volume) 2020 & 2033
- Table 9: Global Rice Trade Analysis Revenue Million Forecast, by Price Trend Analysis 2020 & 2033
- Table 10: Global Rice Trade Analysis Volume Kiloton Forecast, by Price Trend Analysis 2020 & 2033
- Table 11: Global Rice Trade Analysis Revenue Million Forecast, by Region 2020 & 2033
- Table 12: Global Rice Trade Analysis Volume Kiloton Forecast, by Region 2020 & 2033
- Table 13: Global Rice Trade Analysis Revenue Million Forecast, by Production Analysis 2020 & 2033
- Table 14: Global Rice Trade Analysis Volume Kiloton Forecast, by Production Analysis 2020 & 2033
- Table 15: Global Rice Trade Analysis Revenue Million Forecast, by Consumption Analysis 2020 & 2033
- Table 16: Global Rice Trade Analysis Volume Kiloton Forecast, by Consumption Analysis 2020 & 2033
- Table 17: Global Rice Trade Analysis Revenue Million Forecast, by Import Market Analysis (Value & Volume) 2020 & 2033
- Table 18: Global Rice Trade Analysis Volume Kiloton Forecast, by Import Market Analysis (Value & Volume) 2020 & 2033
- Table 19: Global Rice Trade Analysis Revenue Million Forecast, by Export Market Analysis (Value & Volume) 2020 & 2033
- Table 20: Global Rice Trade Analysis Volume Kiloton Forecast, by Export Market Analysis (Value & Volume) 2020 & 2033
- Table 21: Global Rice Trade Analysis Revenue Million Forecast, by Price Trend Analysis 2020 & 2033
- Table 22: Global Rice Trade Analysis Volume Kiloton Forecast, by Price Trend Analysis 2020 & 2033
- Table 23: Global Rice Trade Analysis Revenue Million Forecast, by Country 2020 & 2033
- Table 24: Global Rice Trade Analysis Volume Kiloton Forecast, by Country 2020 & 2033
- Table 25: United States Rice Trade Analysis Revenue (Million) Forecast, by Application 2020 & 2033
- Table 26: United States Rice Trade Analysis Volume (Kiloton) Forecast, by Application 2020 & 2033
- Table 27: Canada Rice Trade Analysis Revenue (Million) Forecast, by Application 2020 & 2033
- Table 28: Canada Rice Trade Analysis Volume (Kiloton) Forecast, by Application 2020 & 2033
- Table 29: Global Rice Trade Analysis Revenue Million Forecast, by Production Analysis 2020 & 2033
- Table 30: Global Rice Trade Analysis Volume Kiloton Forecast, by Production Analysis 2020 & 2033
- Table 31: Global Rice Trade Analysis Revenue Million Forecast, by Consumption Analysis 2020 & 2033
- Table 32: Global Rice Trade Analysis Volume Kiloton Forecast, by Consumption Analysis 2020 & 2033
- Table 33: Global Rice Trade Analysis Revenue Million Forecast, by Import Market Analysis (Value & Volume) 2020 & 2033
- Table 34: Global Rice Trade Analysis Volume Kiloton Forecast, by Import Market Analysis (Value & Volume) 2020 & 2033
- Table 35: Global Rice Trade Analysis Revenue Million Forecast, by Export Market Analysis (Value & Volume) 2020 & 2033
- Table 36: Global Rice Trade Analysis Volume Kiloton Forecast, by Export Market Analysis (Value & Volume) 2020 & 2033
- Table 37: Global Rice Trade Analysis Revenue Million Forecast, by Price Trend Analysis 2020 & 2033
- Table 38: Global Rice Trade Analysis Volume Kiloton Forecast, by Price Trend Analysis 2020 & 2033
- Table 39: Global Rice Trade Analysis Revenue Million Forecast, by Country 2020 & 2033
- Table 40: Global Rice Trade Analysis Volume Kiloton Forecast, by Country 2020 & 2033
- Table 41: France Rice Trade Analysis Revenue (Million) Forecast, by Application 2020 & 2033
- Table 42: France Rice Trade Analysis Volume (Kiloton) Forecast, by Application 2020 & 2033
- Table 43: United Kingdom Rice Trade Analysis Revenue (Million) Forecast, by Application 2020 & 2033
- Table 44: United Kingdom Rice Trade Analysis Volume (Kiloton) Forecast, by Application 2020 & 2033
- Table 45: Germany Rice Trade Analysis Revenue (Million) Forecast, by Application 2020 & 2033
- Table 46: Germany Rice Trade Analysis Volume (Kiloton) Forecast, by Application 2020 & 2033
- Table 47: Italy Rice Trade Analysis Revenue (Million) Forecast, by Application 2020 & 2033
- Table 48: Italy Rice Trade Analysis Volume (Kiloton) Forecast, by Application 2020 & 2033
- Table 49: Spain Rice Trade Analysis Revenue (Million) Forecast, by Application 2020 & 2033
- Table 50: Spain Rice Trade Analysis Volume (Kiloton) Forecast, by Application 2020 & 2033
- Table 51: Global Rice Trade Analysis Revenue Million Forecast, by Production Analysis 2020 & 2033
- Table 52: Global Rice Trade Analysis Volume Kiloton Forecast, by Production Analysis 2020 & 2033
- Table 53: Global Rice Trade Analysis Revenue Million Forecast, by Consumption Analysis 2020 & 2033
- Table 54: Global Rice Trade Analysis Volume Kiloton Forecast, by Consumption Analysis 2020 & 2033
- Table 55: Global Rice Trade Analysis Revenue Million Forecast, by Import Market Analysis (Value & Volume) 2020 & 2033
- Table 56: Global Rice Trade Analysis Volume Kiloton Forecast, by Import Market Analysis (Value & Volume) 2020 & 2033
- Table 57: Global Rice Trade Analysis Revenue Million Forecast, by Export Market Analysis (Value & Volume) 2020 & 2033
- Table 58: Global Rice Trade Analysis Volume Kiloton Forecast, by Export Market Analysis (Value & Volume) 2020 & 2033
- Table 59: Global Rice Trade Analysis Revenue Million Forecast, by Price Trend Analysis 2020 & 2033
- Table 60: Global Rice Trade Analysis Volume Kiloton Forecast, by Price Trend Analysis 2020 & 2033
- Table 61: Global Rice Trade Analysis Revenue Million Forecast, by Country 2020 & 2033
- Table 62: Global Rice Trade Analysis Volume Kiloton Forecast, by Country 2020 & 2033
- Table 63: China Rice Trade Analysis Revenue (Million) Forecast, by Application 2020 & 2033
- Table 64: China Rice Trade Analysis Volume (Kiloton) Forecast, by Application 2020 & 2033
- Table 65: India Rice Trade Analysis Revenue (Million) Forecast, by Application 2020 & 2033
- Table 66: India Rice Trade Analysis Volume (Kiloton) Forecast, by Application 2020 & 2033
- Table 67: Thailand Rice Trade Analysis Revenue (Million) Forecast, by Application 2020 & 2033
- Table 68: Thailand Rice Trade Analysis Volume (Kiloton) Forecast, by Application 2020 & 2033
- Table 69: Vietnam Rice Trade Analysis Revenue (Million) Forecast, by Application 2020 & 2033
- Table 70: Vietnam Rice Trade Analysis Volume (Kiloton) Forecast, by Application 2020 & 2033
- Table 71: Pakistan Rice Trade Analysis Revenue (Million) Forecast, by Application 2020 & 2033
- Table 72: Pakistan Rice Trade Analysis Volume (Kiloton) Forecast, by Application 2020 & 2033
- Table 73: Global Rice Trade Analysis Revenue Million Forecast, by Production Analysis 2020 & 2033
- Table 74: Global Rice Trade Analysis Volume Kiloton Forecast, by Production Analysis 2020 & 2033
- Table 75: Global Rice Trade Analysis Revenue Million Forecast, by Consumption Analysis 2020 & 2033
- Table 76: Global Rice Trade Analysis Volume Kiloton Forecast, by Consumption Analysis 2020 & 2033
- Table 77: Global Rice Trade Analysis Revenue Million Forecast, by Import Market Analysis (Value & Volume) 2020 & 2033
- Table 78: Global Rice Trade Analysis Volume Kiloton Forecast, by Import Market Analysis (Value & Volume) 2020 & 2033
- Table 79: Global Rice Trade Analysis Revenue Million Forecast, by Export Market Analysis (Value & Volume) 2020 & 2033
- Table 80: Global Rice Trade Analysis Volume Kiloton Forecast, by Export Market Analysis (Value & Volume) 2020 & 2033
- Table 81: Global Rice Trade Analysis Revenue Million Forecast, by Price Trend Analysis 2020 & 2033
- Table 82: Global Rice Trade Analysis Volume Kiloton Forecast, by Price Trend Analysis 2020 & 2033
- Table 83: Global Rice Trade Analysis Revenue Million Forecast, by Country 2020 & 2033
- Table 84: Global Rice Trade Analysis Volume Kiloton Forecast, by Country 2020 & 2033
- Table 85: Brazil Rice Trade Analysis Revenue (Million) Forecast, by Application 2020 & 2033
- Table 86: Brazil Rice Trade Analysis Volume (Kiloton) Forecast, by Application 2020 & 2033
- Table 87: Argentina Rice Trade Analysis Revenue (Million) Forecast, by Application 2020 & 2033
- Table 88: Argentina Rice Trade Analysis Volume (Kiloton) Forecast, by Application 2020 & 2033
- Table 89: Global Rice Trade Analysis Revenue Million Forecast, by Production Analysis 2020 & 2033
- Table 90: Global Rice Trade Analysis Volume Kiloton Forecast, by Production Analysis 2020 & 2033
- Table 91: Global Rice Trade Analysis Revenue Million Forecast, by Consumption Analysis 2020 & 2033
- Table 92: Global Rice Trade Analysis Volume Kiloton Forecast, by Consumption Analysis 2020 & 2033
- Table 93: Global Rice Trade Analysis Revenue Million Forecast, by Import Market Analysis (Value & Volume) 2020 & 2033
- Table 94: Global Rice Trade Analysis Volume Kiloton Forecast, by Import Market Analysis (Value & Volume) 2020 & 2033
- Table 95: Global Rice Trade Analysis Revenue Million Forecast, by Export Market Analysis (Value & Volume) 2020 & 2033
- Table 96: Global Rice Trade Analysis Volume Kiloton Forecast, by Export Market Analysis (Value & Volume) 2020 & 2033
- Table 97: Global Rice Trade Analysis Revenue Million Forecast, by Price Trend Analysis 2020 & 2033
- Table 98: Global Rice Trade Analysis Volume Kiloton Forecast, by Price Trend Analysis 2020 & 2033
- Table 99: Global Rice Trade Analysis Revenue Million Forecast, by Country 2020 & 2033
- Table 100: Global Rice Trade Analysis Volume Kiloton Forecast, by Country 2020 & 2033
- Table 101: South Africa Rice Trade Analysis Revenue (Million) Forecast, by Application 2020 & 2033
- Table 102: South Africa Rice Trade Analysis Volume (Kiloton) Forecast, by Application 2020 & 2033
Frequently Asked Questions
1. What is the projected Compound Annual Growth Rate (CAGR) of the Rice Trade Analysis?
The projected CAGR is approximately 2.20%.
2. Which companies are prominent players in the Rice Trade Analysis?
Key companies in the market include Cargill , Adani Wilmar , Jindal Saw , Canary Foods , Agroindustrias del Sur, Saurer , KRBL Ltd , Vigoro , Thai Binh Rice , Agroindustrial Rueda .
3. What are the main segments of the Rice Trade Analysis?
The market segments include Production Analysis, Consumption Analysis, Import Market Analysis (Value & Volume), Export Market Analysis (Value & Volume), Price Trend Analysis.
4. Can you provide details about the market size?
The market size is estimated to be USD 306.38 Million as of 2022.
5. What are some drivers contributing to market growth?
N/A
6. What are the notable trends driving market growth?
Favorable Trade Policies.
7. Are there any restraints impacting market growth?
N/A
8. Can you provide examples of recent developments in the market?
September 2022: India banned the export of broken rice, and a 20% export duty was imposed on non-basmati rice. This is the first ban by India after the 2011 ban on non-basmati rice for three years.
9. What pricing options are available for accessing the report?
Pricing options include single-user, multi-user, and enterprise licenses priced at USD 4750, USD 5250, and USD 8750 respectively.
10. Is the market size provided in terms of value or volume?
The market size is provided in terms of value, measured in Million and volume, measured in Kiloton.
11. Are there any specific market keywords associated with the report?
Yes, the market keyword associated with the report is "Rice Trade Analysis," which aids in identifying and referencing the specific market segment covered.
12. How do I determine which pricing option suits my needs best?
The pricing options vary based on user requirements and access needs. Individual users may opt for single-user licenses, while businesses requiring broader access may choose multi-user or enterprise licenses for cost-effective access to the report.
13. Are there any additional resources or data provided in the Rice Trade Analysis report?
While the report offers comprehensive insights, it's advisable to review the specific contents or supplementary materials provided to ascertain if additional resources or data are available.
14. How can I stay updated on further developments or reports in the Rice Trade Analysis?
To stay informed about further developments, trends, and reports in the Rice Trade Analysis, consider subscribing to industry newsletters, following relevant companies and organizations, or regularly checking reputable industry news sources and publications.
Methodology
Step 1 - Identification of Relevant Samples Size from Population Database


Step 2 - Approaches for Defining Global Market Size (Value, Volume* & Price*)

Note*: In applicable scenarios
Step 3 - Data Sources
Primary Research
- Web Analytics
- Survey Reports
- Research Institute
- Latest Research Reports
- Opinion Leaders
Secondary Research
- Annual Reports
- White Paper
- Latest Press Release
- Industry Association
- Paid Database
- Investor Presentations

Step 4 - Data Triangulation
Involves using different sources of information in order to increase the validity of a study
These sources are likely to be stakeholders in a program - participants, other researchers, program staff, other community members, and so on.
Then we put all data in single framework & apply various statistical tools to find out the dynamic on the market.
During the analysis stage, feedback from the stakeholder groups would be compared to determine areas of agreement as well as areas of divergence