
Key Insights
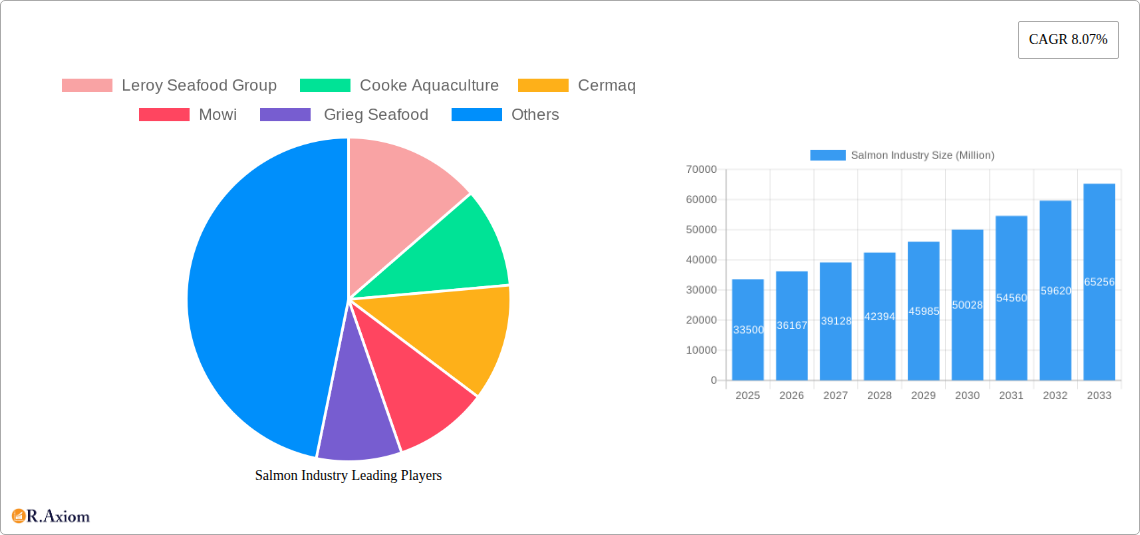
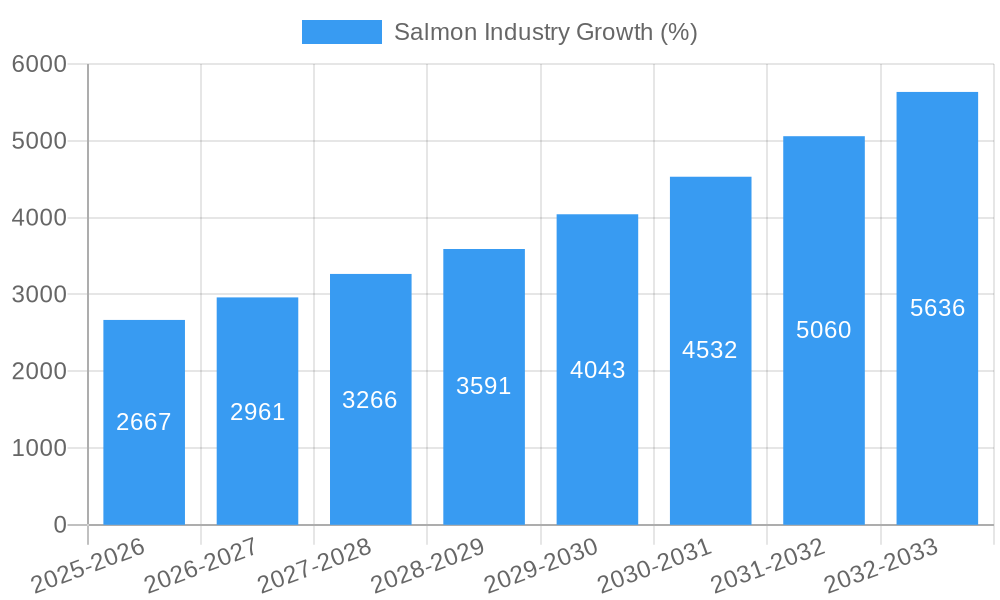
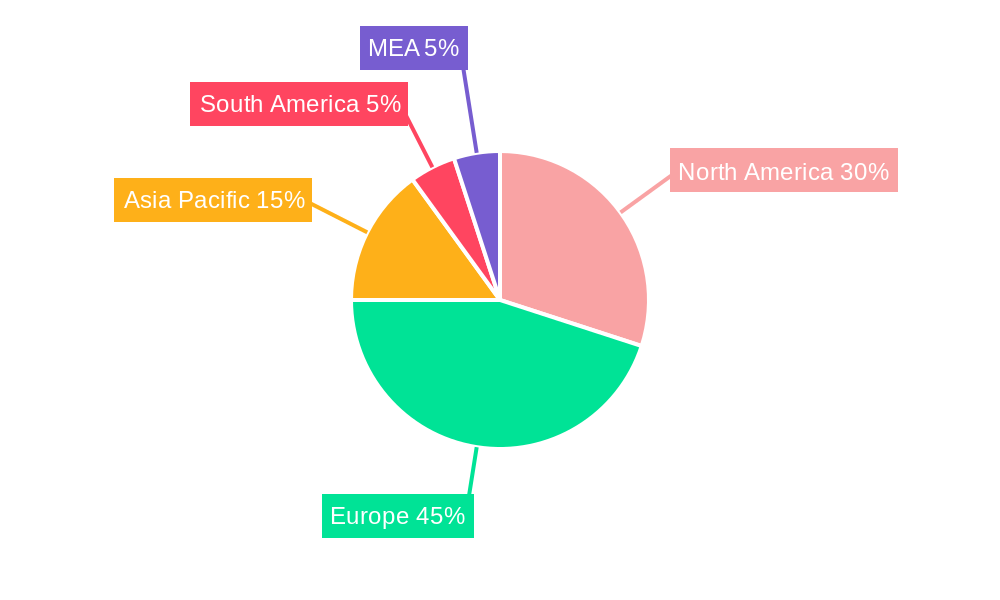
The global salmon market, valued at $33.5 billion in 2025, is projected to experience robust growth, exhibiting a compound annual growth rate (CAGR) of 8.07% from 2025 to 2033. This expansion is driven by several key factors. Increasing consumer demand for healthy and sustainable protein sources fuels the market's upward trajectory. Growing awareness of the nutritional benefits of salmon, rich in Omega-3 fatty acids and protein, is a significant driver. Furthermore, the rise of aquaculture, particularly in regions like Norway and Chile, contributes to increased supply and accessibility, making salmon a more affordable option for a wider consumer base. The market is segmented by farming methods (farmed vs. wild-captured) and species (Atlantic Salmon, Coho Salmon, Masu Salmon, Chinook Salmon, and others), with farmed Atlantic salmon currently dominating the market share. Key players like Leroy Seafood Group, Cooke Aquaculture, Cermaq, Mowi, and Grieg Seafood are constantly innovating in farming techniques and expanding their market reach to capitalize on this growth. Geographic variations exist, with North America and Europe representing significant markets, followed by the Asia-Pacific region. Continued market expansion is expected, driven by evolving consumer preferences, advancements in aquaculture technology, and increasing investments in sustainable farming practices.
However, challenges remain. Fluctuations in global fish stocks and environmental concerns related to aquaculture practices are potential restraints. Competition from alternative protein sources and the potential impact of geopolitical events also require attention. Addressing these challenges through sustainable aquaculture practices, transparent sourcing, and innovative product development will be crucial for the continued, healthy growth of the salmon market. The industry's future lies in balancing supply with demand, ensuring environmental sustainability, and consistently providing high-quality, nutritious salmon products to a growing global consumer base.
Salmon Industry: A Comprehensive Market Analysis (2019-2033)
This in-depth report provides a comprehensive analysis of the global salmon industry, encompassing market size, growth projections, competitive landscape, and key trends from 2019 to 2033. It offers actionable insights for industry stakeholders, investors, and businesses seeking to navigate this dynamic market. The report leverages extensive data analysis and expert insights to provide a clear and concise understanding of the current state and future trajectory of the salmon industry. With a focus on key players like Leroy Seafood Group, Cooke Aquaculture, Cermaq, Mowi, and Grieg Seafood, this report is an essential resource for strategic decision-making.
Salmon Industry Market Concentration & Innovation
This section analyzes the competitive landscape of the salmon industry, focusing on market concentration, innovation drivers, regulatory frameworks, product substitutes, end-user trends, and merger & acquisition (M&A) activities. The historical period (2019-2024) and the forecast period (2025-2033) are examined to highlight shifts in market share and strategic alliances.
Market Concentration: The global salmon market demonstrates moderate concentration, with the top five players – Leroy Seafood Group, Cooke Aquaculture, Cermaq, Mowi, and Grieg Seafood – holding an estimated xx% of the global market share in 2024. The report details the market share of each major player and analyzes their strategic positioning.
Innovation Drivers: Technological advancements in aquaculture, particularly in feed efficiency and disease prevention, are major drivers of innovation. The development of sustainable farming practices and the increasing demand for traceable and ethically sourced salmon are also fueling innovation.
Regulatory Frameworks: Stringent regulations regarding aquaculture practices, environmental protection, and food safety significantly impact market dynamics. The report analyzes the impact of key regulations across different regions.
Product Substitutes: The report explores alternative protein sources and their potential impact on salmon consumption, such as plant-based alternatives and other seafood options.
End-User Trends: Shifting consumer preferences towards health and sustainability are driving demand for sustainably farmed salmon. The report analyzes the changing consumption patterns and their implications for the industry.
M&A Activities: The report details significant M&A activities in the salmon industry during the study period (2019-2024), analyzing deal values and their impact on market consolidation. A forecast of future M&A activities based on market trends is also included. Estimated total M&A deal value during 2019-2024 is estimated at $xx Million.
Salmon Industry Industry Trends & Insights
This section delves into the key trends shaping the salmon industry, including market growth drivers, technological disruptions, consumer preferences, and competitive dynamics. The compound annual growth rate (CAGR) for the forecast period (2025-2033) is projected at xx%, driven by several factors.
The increasing global demand for protein, coupled with the rising popularity of salmon as a healthy and versatile food source, is a primary driver of market growth. The adoption of innovative aquaculture techniques, such as RAS (Recirculating Aquaculture Systems), is enhancing production efficiency and sustainability, improving market penetration. Technological advancements in processing and preservation techniques are expanding market reach and extending product shelf life. Consumer preferences for traceable, ethically sourced, and sustainably produced salmon are also shaping industry practices. Increased competition among major players is driving innovation and efficiency improvements, ensuring a dynamic market. Market penetration of farmed salmon continues to increase, currently at approximately xx% in key markets.
Dominant Markets & Segments in Salmon Industry
This section identifies the leading regions, countries, and market segments within the salmon industry.
Leading Regions/Countries: Norway and Chile remain dominant in global salmon production, accounting for a significant portion of the global market. However, other regions, such as Canada, are experiencing growth due to increased production and export capabilities.
Dominant Segments:
- Type: Farmed salmon significantly dominates the market compared to wild-caught salmon, largely due to increased production capacity and cost-effectiveness.
- Species Type: Atlantic salmon accounts for the largest share of the global market, followed by Chinook and Coho salmon. Other species types represent a smaller, but growing, segment.
Key drivers of dominance in each segment are analyzed, encompassing economic policies, infrastructure, technological advancements, consumer preferences, and environmental factors. The report provides a detailed breakdown of the market size and growth projections for each segment for the forecast period (2025-2033). Norway's dominance is attributed to its established aquaculture infrastructure, supportive government policies, and technological advancements. Chile's strong position is due to favorable environmental conditions and a robust export market.
Salmon Industry Product Developments
Recent product innovations focus on enhancing convenience, extending shelf life, and meeting growing consumer demand for value-added products. This includes the development of ready-to-eat salmon products, innovative packaging solutions, and value-added processed salmon items. Technological advancements in genetic modification and selective breeding are improving salmon yields and reducing production costs. The market fit of these innovations is assessed based on consumer demand and market trends, ensuring that product development aligns with broader industry shifts.
Report Scope & Segmentation Analysis
This report segments the salmon market by Type (Farmed, Wild Captured) and Species Type (Atlantic Salmon, Coho Salmon, Masu Salmon, Chinook Salmon, Other Species Types). Each segment is analyzed based on historical data (2019-2024), current market size (2025), and future growth projections (2025-2033). Competitive dynamics within each segment are also explored, considering market share, pricing strategies, and technological advancements. The market size for each segment is detailed, with projections for 2033 provided. For instance, the farmed Atlantic salmon segment is projected to reach $xx Million by 2033.
Key Drivers of Salmon Industry Growth
Several factors contribute to the growth of the salmon industry. Technological advancements in aquaculture, particularly RAS systems, improve efficiency and sustainability. Increasing global demand for protein fuels consumption. Government support through subsidies and research funding enhances productivity. Rising consumer awareness of the health benefits of salmon increases demand. Sustainable farming practices and certifications boost consumer confidence and brand appeal.
Challenges in the Salmon Industry Sector
The industry faces several challenges. Environmental concerns related to aquaculture, such as sea lice infestations and escaped fish, cause regulatory scrutiny and consumer apprehension. Supply chain disruptions, including transportation costs and logistical challenges, impact profitability. Fluctuations in feed prices and energy costs impact production costs. Intense competition among producers exerts pressure on pricing and profit margins.
Emerging Opportunities in Salmon Industry
Emerging opportunities include expanding into new markets with high growth potential, like Asia. Developing innovative products, such as ready-to-eat meals and value-added processed salmon, cater to consumer preferences. Investing in sustainable aquaculture practices, like RAS systems and closed containment facilities, addresses environmental concerns. Utilizing technology for precision aquaculture, such as sensors and AI, improves efficiency and reduces environmental impact.
Leading Players in the Salmon Industry Market
Key Developments in Salmon Industry Industry
- 2022-Q4: Mowi announced a significant investment in RAS technology.
- 2023-Q1: Leroy Seafood Group launched a new line of sustainable salmon products.
- 2023-Q3: Cooke Aquaculture acquired a smaller competitor, expanding its market share. (Further details on specific acquisitions and launches would be included in the full report)
Strategic Outlook for Salmon Industry Market
The salmon industry is poised for continued growth, driven by rising global demand, technological advancements, and increasing consumer awareness of its health benefits. Opportunities lie in sustainable aquaculture practices, product innovation, and expanding into new markets. Addressing challenges related to environmental concerns and supply chain resilience is crucial for long-term sustainability and profitability. Strategic partnerships and investments in technology will be key to success in this competitive market.
Salmon Industry Segmentation
-
1. Species Type
- 1.1. Atlantic Salmon
- 1.2. Coho Salmon
- 1.3. Masu Salmon
- 1.4. Chinook Salmon
- 1.5. Other Species Types
-
2. Type
- 2.1. Farmed
- 2.2. Wild Captured
-
3. Species Type
- 3.1. Atlantic Salmon
- 3.2. Coho Salmon
- 3.3. Masu Salmon
- 3.4. Chinook Salmon
- 3.5. Other Species Types
-
4. Type
- 4.1. Farmed
- 4.2. Wild Captured
Salmon Industry Segmentation By Geography
-
1. North America
- 1.1. United States
- 1.2. Canada
-
2. Europe
- 2.1. Norway
- 2.2. Spain
- 2.3. Netherlands
- 2.4. France
- 2.5. Italy
- 2.6. Greece
- 2.7. United Kingdom
- 2.8. Scotland
-
3. Asia Pacific
- 3.1. China
- 3.2. Japan
- 3.3. Australia
-
4. South America
- 4.1. Chile
Salmon Industry REPORT HIGHLIGHTS
| Aspects | Details |
|---|---|
| Study Period | 2019-2033 |
| Base Year | 2024 |
| Estimated Year | 2025 |
| Forecast Period | 2025-2033 |
| Historical Period | 2019-2024 |
| Growth Rate | CAGR of 8.07% from 2019-2033 |
| Segmentation |
|
Table of Contents
- 1. Introduction
- 1.1. Research Scope
- 1.2. Market Segmentation
- 1.3. Research Methodology
- 1.4. Definitions and Assumptions
- 2. Executive Summary
- 2.1. Introduction
- 3. Market Dynamics
- 3.1. Introduction
- 3.2. Market Drivers
- 3.2.1. ; Awareness About Health Benefits Associated With Pecan Consumption; Wide Application of Pecan
- 3.3. Market Restrains
- 3.3.1. ; Volatility in the Prices; Adverse Weather Conditions Affecting Yield
- 3.4. Market Trends
- 3.4.1. Healthy Boost in the Salmon Production
- 4. Market Factor Analysis
- 4.1. Porters Five Forces
- 4.2. Supply/Value Chain
- 4.3. PESTEL analysis
- 4.4. Market Entropy
- 4.5. Patent/Trademark Analysis
- 5. Global Salmon Industry Analysis, Insights and Forecast, 2019-2031
- 5.1. Market Analysis, Insights and Forecast - by Species Type
- 5.1.1. Atlantic Salmon
- 5.1.2. Coho Salmon
- 5.1.3. Masu Salmon
- 5.1.4. Chinook Salmon
- 5.1.5. Other Species Types
- 5.2. Market Analysis, Insights and Forecast - by Type
- 5.2.1. Farmed
- 5.2.2. Wild Captured
- 5.3. Market Analysis, Insights and Forecast - by Species Type
- 5.3.1. Atlantic Salmon
- 5.3.2. Coho Salmon
- 5.3.3. Masu Salmon
- 5.3.4. Chinook Salmon
- 5.3.5. Other Species Types
- 5.4. Market Analysis, Insights and Forecast - by Type
- 5.4.1. Farmed
- 5.4.2. Wild Captured
- 5.5. Market Analysis, Insights and Forecast - by Region
- 5.5.1. North America
- 5.5.2. Europe
- 5.5.3. Asia Pacific
- 5.5.4. South America
- 5.1. Market Analysis, Insights and Forecast - by Species Type
- 6. North America Salmon Industry Analysis, Insights and Forecast, 2019-2031
- 6.1. Market Analysis, Insights and Forecast - by Species Type
- 6.1.1. Atlantic Salmon
- 6.1.2. Coho Salmon
- 6.1.3. Masu Salmon
- 6.1.4. Chinook Salmon
- 6.1.5. Other Species Types
- 6.2. Market Analysis, Insights and Forecast - by Type
- 6.2.1. Farmed
- 6.2.2. Wild Captured
- 6.3. Market Analysis, Insights and Forecast - by Species Type
- 6.3.1. Atlantic Salmon
- 6.3.2. Coho Salmon
- 6.3.3. Masu Salmon
- 6.3.4. Chinook Salmon
- 6.3.5. Other Species Types
- 6.4. Market Analysis, Insights and Forecast - by Type
- 6.4.1. Farmed
- 6.4.2. Wild Captured
- 6.1. Market Analysis, Insights and Forecast - by Species Type
- 7. Europe Salmon Industry Analysis, Insights and Forecast, 2019-2031
- 7.1. Market Analysis, Insights and Forecast - by Species Type
- 7.1.1. Atlantic Salmon
- 7.1.2. Coho Salmon
- 7.1.3. Masu Salmon
- 7.1.4. Chinook Salmon
- 7.1.5. Other Species Types
- 7.2. Market Analysis, Insights and Forecast - by Type
- 7.2.1. Farmed
- 7.2.2. Wild Captured
- 7.3. Market Analysis, Insights and Forecast - by Species Type
- 7.3.1. Atlantic Salmon
- 7.3.2. Coho Salmon
- 7.3.3. Masu Salmon
- 7.3.4. Chinook Salmon
- 7.3.5. Other Species Types
- 7.4. Market Analysis, Insights and Forecast - by Type
- 7.4.1. Farmed
- 7.4.2. Wild Captured
- 7.1. Market Analysis, Insights and Forecast - by Species Type
- 8. Asia Pacific Salmon Industry Analysis, Insights and Forecast, 2019-2031
- 8.1. Market Analysis, Insights and Forecast - by Species Type
- 8.1.1. Atlantic Salmon
- 8.1.2. Coho Salmon
- 8.1.3. Masu Salmon
- 8.1.4. Chinook Salmon
- 8.1.5. Other Species Types
- 8.2. Market Analysis, Insights and Forecast - by Type
- 8.2.1. Farmed
- 8.2.2. Wild Captured
- 8.3. Market Analysis, Insights and Forecast - by Species Type
- 8.3.1. Atlantic Salmon
- 8.3.2. Coho Salmon
- 8.3.3. Masu Salmon
- 8.3.4. Chinook Salmon
- 8.3.5. Other Species Types
- 8.4. Market Analysis, Insights and Forecast - by Type
- 8.4.1. Farmed
- 8.4.2. Wild Captured
- 8.1. Market Analysis, Insights and Forecast - by Species Type
- 9. South America Salmon Industry Analysis, Insights and Forecast, 2019-2031
- 9.1. Market Analysis, Insights and Forecast - by Species Type
- 9.1.1. Atlantic Salmon
- 9.1.2. Coho Salmon
- 9.1.3. Masu Salmon
- 9.1.4. Chinook Salmon
- 9.1.5. Other Species Types
- 9.2. Market Analysis, Insights and Forecast - by Type
- 9.2.1. Farmed
- 9.2.2. Wild Captured
- 9.3. Market Analysis, Insights and Forecast - by Species Type
- 9.3.1. Atlantic Salmon
- 9.3.2. Coho Salmon
- 9.3.3. Masu Salmon
- 9.3.4. Chinook Salmon
- 9.3.5. Other Species Types
- 9.4. Market Analysis, Insights and Forecast - by Type
- 9.4.1. Farmed
- 9.4.2. Wild Captured
- 9.1. Market Analysis, Insights and Forecast - by Species Type
- 10. North America Salmon Industry Analysis, Insights and Forecast, 2019-2031
- 10.1. Market Analysis, Insights and Forecast - By Country/Sub-region
- 10.1.1 United States
- 10.1.2 Canada
- 11. Europe Salmon Industry Analysis, Insights and Forecast, 2019-2031
- 11.1. Market Analysis, Insights and Forecast - By Country/Sub-region
- 11.1.1 Norway
- 11.1.2 Spain
- 11.1.3 Netherlands
- 11.1.4 France
- 11.1.5 Italy
- 11.1.6 Greece
- 11.1.7 United Kingdom
- 11.1.8 Scotland
- 12. Asia Pacific Salmon Industry Analysis, Insights and Forecast, 2019-2031
- 12.1. Market Analysis, Insights and Forecast - By Country/Sub-region
- 12.1.1 China
- 12.1.2 Japan
- 12.1.3 Australia
- 13. South America Salmon Industry Analysis, Insights and Forecast, 2019-2031
- 13.1. Market Analysis, Insights and Forecast - By Country/Sub-region
- 13.1.1. Chile
- 14. MEA Salmon Industry Analysis, Insights and Forecast, 2019-2031
- 14.1. Market Analysis, Insights and Forecast - By Country/Sub-region
- 14.1.1 Middle East
- 14.1.2 Africa
- 15. Competitive Analysis
- 15.1. Global Market Share Analysis 2024
- 15.2. Company Profiles
- 15.2.1 Leroy Seafood Group
- 15.2.1.1. Overview
- 15.2.1.2. Products
- 15.2.1.3. SWOT Analysis
- 15.2.1.4. Recent Developments
- 15.2.1.5. Financials (Based on Availability)
- 15.2.2 Cooke Aquaculture
- 15.2.2.1. Overview
- 15.2.2.2. Products
- 15.2.2.3. SWOT Analysis
- 15.2.2.4. Recent Developments
- 15.2.2.5. Financials (Based on Availability)
- 15.2.3 Cermaq
- 15.2.3.1. Overview
- 15.2.3.2. Products
- 15.2.3.3. SWOT Analysis
- 15.2.3.4. Recent Developments
- 15.2.3.5. Financials (Based on Availability)
- 15.2.4 Mowi
- 15.2.4.1. Overview
- 15.2.4.2. Products
- 15.2.4.3. SWOT Analysis
- 15.2.4.4. Recent Developments
- 15.2.4.5. Financials (Based on Availability)
- 15.2.5 Grieg Seafood
- 15.2.5.1. Overview
- 15.2.5.2. Products
- 15.2.5.3. SWOT Analysis
- 15.2.5.4. Recent Developments
- 15.2.5.5. Financials (Based on Availability)
- 15.2.1 Leroy Seafood Group
List of Figures
- Figure 1: Global Salmon Industry Revenue Breakdown (Million, %) by Region 2024 & 2032
- Figure 2: North America Salmon Industry Revenue (Million), by Country 2024 & 2032
- Figure 3: North America Salmon Industry Revenue Share (%), by Country 2024 & 2032
- Figure 4: Europe Salmon Industry Revenue (Million), by Country 2024 & 2032
- Figure 5: Europe Salmon Industry Revenue Share (%), by Country 2024 & 2032
- Figure 6: Asia Pacific Salmon Industry Revenue (Million), by Country 2024 & 2032
- Figure 7: Asia Pacific Salmon Industry Revenue Share (%), by Country 2024 & 2032
- Figure 8: South America Salmon Industry Revenue (Million), by Country 2024 & 2032
- Figure 9: South America Salmon Industry Revenue Share (%), by Country 2024 & 2032
- Figure 10: MEA Salmon Industry Revenue (Million), by Country 2024 & 2032
- Figure 11: MEA Salmon Industry Revenue Share (%), by Country 2024 & 2032
- Figure 12: North America Salmon Industry Revenue (Million), by Species Type 2024 & 2032
- Figure 13: North America Salmon Industry Revenue Share (%), by Species Type 2024 & 2032
- Figure 14: North America Salmon Industry Revenue (Million), by Type 2024 & 2032
- Figure 15: North America Salmon Industry Revenue Share (%), by Type 2024 & 2032
- Figure 16: North America Salmon Industry Revenue (Million), by Species Type 2024 & 2032
- Figure 17: North America Salmon Industry Revenue Share (%), by Species Type 2024 & 2032
- Figure 18: North America Salmon Industry Revenue (Million), by Type 2024 & 2032
- Figure 19: North America Salmon Industry Revenue Share (%), by Type 2024 & 2032
- Figure 20: North America Salmon Industry Revenue (Million), by Country 2024 & 2032
- Figure 21: North America Salmon Industry Revenue Share (%), by Country 2024 & 2032
- Figure 22: Europe Salmon Industry Revenue (Million), by Species Type 2024 & 2032
- Figure 23: Europe Salmon Industry Revenue Share (%), by Species Type 2024 & 2032
- Figure 24: Europe Salmon Industry Revenue (Million), by Type 2024 & 2032
- Figure 25: Europe Salmon Industry Revenue Share (%), by Type 2024 & 2032
- Figure 26: Europe Salmon Industry Revenue (Million), by Species Type 2024 & 2032
- Figure 27: Europe Salmon Industry Revenue Share (%), by Species Type 2024 & 2032
- Figure 28: Europe Salmon Industry Revenue (Million), by Type 2024 & 2032
- Figure 29: Europe Salmon Industry Revenue Share (%), by Type 2024 & 2032
- Figure 30: Europe Salmon Industry Revenue (Million), by Country 2024 & 2032
- Figure 31: Europe Salmon Industry Revenue Share (%), by Country 2024 & 2032
- Figure 32: Asia Pacific Salmon Industry Revenue (Million), by Species Type 2024 & 2032
- Figure 33: Asia Pacific Salmon Industry Revenue Share (%), by Species Type 2024 & 2032
- Figure 34: Asia Pacific Salmon Industry Revenue (Million), by Type 2024 & 2032
- Figure 35: Asia Pacific Salmon Industry Revenue Share (%), by Type 2024 & 2032
- Figure 36: Asia Pacific Salmon Industry Revenue (Million), by Species Type 2024 & 2032
- Figure 37: Asia Pacific Salmon Industry Revenue Share (%), by Species Type 2024 & 2032
- Figure 38: Asia Pacific Salmon Industry Revenue (Million), by Type 2024 & 2032
- Figure 39: Asia Pacific Salmon Industry Revenue Share (%), by Type 2024 & 2032
- Figure 40: Asia Pacific Salmon Industry Revenue (Million), by Country 2024 & 2032
- Figure 41: Asia Pacific Salmon Industry Revenue Share (%), by Country 2024 & 2032
- Figure 42: South America Salmon Industry Revenue (Million), by Species Type 2024 & 2032
- Figure 43: South America Salmon Industry Revenue Share (%), by Species Type 2024 & 2032
- Figure 44: South America Salmon Industry Revenue (Million), by Type 2024 & 2032
- Figure 45: South America Salmon Industry Revenue Share (%), by Type 2024 & 2032
- Figure 46: South America Salmon Industry Revenue (Million), by Species Type 2024 & 2032
- Figure 47: South America Salmon Industry Revenue Share (%), by Species Type 2024 & 2032
- Figure 48: South America Salmon Industry Revenue (Million), by Type 2024 & 2032
- Figure 49: South America Salmon Industry Revenue Share (%), by Type 2024 & 2032
- Figure 50: South America Salmon Industry Revenue (Million), by Country 2024 & 2032
- Figure 51: South America Salmon Industry Revenue Share (%), by Country 2024 & 2032
List of Tables
- Table 1: Global Salmon Industry Revenue Million Forecast, by Region 2019 & 2032
- Table 2: Global Salmon Industry Revenue Million Forecast, by Species Type 2019 & 2032
- Table 3: Global Salmon Industry Revenue Million Forecast, by Type 2019 & 2032
- Table 4: Global Salmon Industry Revenue Million Forecast, by Species Type 2019 & 2032
- Table 5: Global Salmon Industry Revenue Million Forecast, by Type 2019 & 2032
- Table 6: Global Salmon Industry Revenue Million Forecast, by Region 2019 & 2032
- Table 7: Global Salmon Industry Revenue Million Forecast, by Country 2019 & 2032
- Table 8: United States Salmon Industry Revenue (Million) Forecast, by Application 2019 & 2032
- Table 9: Canada Salmon Industry Revenue (Million) Forecast, by Application 2019 & 2032
- Table 10: Global Salmon Industry Revenue Million Forecast, by Country 2019 & 2032
- Table 11: Norway Salmon Industry Revenue (Million) Forecast, by Application 2019 & 2032
- Table 12: Spain Salmon Industry Revenue (Million) Forecast, by Application 2019 & 2032
- Table 13: Netherlands Salmon Industry Revenue (Million) Forecast, by Application 2019 & 2032
- Table 14: France Salmon Industry Revenue (Million) Forecast, by Application 2019 & 2032
- Table 15: Italy Salmon Industry Revenue (Million) Forecast, by Application 2019 & 2032
- Table 16: Greece Salmon Industry Revenue (Million) Forecast, by Application 2019 & 2032
- Table 17: United Kingdom Salmon Industry Revenue (Million) Forecast, by Application 2019 & 2032
- Table 18: Scotland Salmon Industry Revenue (Million) Forecast, by Application 2019 & 2032
- Table 19: Global Salmon Industry Revenue Million Forecast, by Country 2019 & 2032
- Table 20: China Salmon Industry Revenue (Million) Forecast, by Application 2019 & 2032
- Table 21: Japan Salmon Industry Revenue (Million) Forecast, by Application 2019 & 2032
- Table 22: Australia Salmon Industry Revenue (Million) Forecast, by Application 2019 & 2032
- Table 23: Global Salmon Industry Revenue Million Forecast, by Country 2019 & 2032
- Table 24: Chile Salmon Industry Revenue (Million) Forecast, by Application 2019 & 2032
- Table 25: Global Salmon Industry Revenue Million Forecast, by Country 2019 & 2032
- Table 26: Middle East Salmon Industry Revenue (Million) Forecast, by Application 2019 & 2032
- Table 27: Africa Salmon Industry Revenue (Million) Forecast, by Application 2019 & 2032
- Table 28: Global Salmon Industry Revenue Million Forecast, by Species Type 2019 & 2032
- Table 29: Global Salmon Industry Revenue Million Forecast, by Type 2019 & 2032
- Table 30: Global Salmon Industry Revenue Million Forecast, by Species Type 2019 & 2032
- Table 31: Global Salmon Industry Revenue Million Forecast, by Type 2019 & 2032
- Table 32: Global Salmon Industry Revenue Million Forecast, by Country 2019 & 2032
- Table 33: United States Salmon Industry Revenue (Million) Forecast, by Application 2019 & 2032
- Table 34: Canada Salmon Industry Revenue (Million) Forecast, by Application 2019 & 2032
- Table 35: Global Salmon Industry Revenue Million Forecast, by Species Type 2019 & 2032
- Table 36: Global Salmon Industry Revenue Million Forecast, by Type 2019 & 2032
- Table 37: Global Salmon Industry Revenue Million Forecast, by Species Type 2019 & 2032
- Table 38: Global Salmon Industry Revenue Million Forecast, by Type 2019 & 2032
- Table 39: Global Salmon Industry Revenue Million Forecast, by Country 2019 & 2032
- Table 40: Norway Salmon Industry Revenue (Million) Forecast, by Application 2019 & 2032
- Table 41: Spain Salmon Industry Revenue (Million) Forecast, by Application 2019 & 2032
- Table 42: Netherlands Salmon Industry Revenue (Million) Forecast, by Application 2019 & 2032
- Table 43: France Salmon Industry Revenue (Million) Forecast, by Application 2019 & 2032
- Table 44: Italy Salmon Industry Revenue (Million) Forecast, by Application 2019 & 2032
- Table 45: Greece Salmon Industry Revenue (Million) Forecast, by Application 2019 & 2032
- Table 46: United Kingdom Salmon Industry Revenue (Million) Forecast, by Application 2019 & 2032
- Table 47: Scotland Salmon Industry Revenue (Million) Forecast, by Application 2019 & 2032
- Table 48: Global Salmon Industry Revenue Million Forecast, by Species Type 2019 & 2032
- Table 49: Global Salmon Industry Revenue Million Forecast, by Type 2019 & 2032
- Table 50: Global Salmon Industry Revenue Million Forecast, by Species Type 2019 & 2032
- Table 51: Global Salmon Industry Revenue Million Forecast, by Type 2019 & 2032
- Table 52: Global Salmon Industry Revenue Million Forecast, by Country 2019 & 2032
- Table 53: China Salmon Industry Revenue (Million) Forecast, by Application 2019 & 2032
- Table 54: Japan Salmon Industry Revenue (Million) Forecast, by Application 2019 & 2032
- Table 55: Australia Salmon Industry Revenue (Million) Forecast, by Application 2019 & 2032
- Table 56: Global Salmon Industry Revenue Million Forecast, by Species Type 2019 & 2032
- Table 57: Global Salmon Industry Revenue Million Forecast, by Type 2019 & 2032
- Table 58: Global Salmon Industry Revenue Million Forecast, by Species Type 2019 & 2032
- Table 59: Global Salmon Industry Revenue Million Forecast, by Type 2019 & 2032
- Table 60: Global Salmon Industry Revenue Million Forecast, by Country 2019 & 2032
- Table 61: Chile Salmon Industry Revenue (Million) Forecast, by Application 2019 & 2032
Frequently Asked Questions
1. What is the projected Compound Annual Growth Rate (CAGR) of the Salmon Industry?
The projected CAGR is approximately 8.07%.
2. Which companies are prominent players in the Salmon Industry?
Key companies in the market include Leroy Seafood Group , Cooke Aquaculture , Cermaq, Mowi , Grieg Seafood .
3. What are the main segments of the Salmon Industry?
The market segments include Species Type, Type, Species Type, Type.
4. Can you provide details about the market size?
The market size is estimated to be USD 33.50 Million as of 2022.
5. What are some drivers contributing to market growth?
; Awareness About Health Benefits Associated With Pecan Consumption; Wide Application of Pecan.
6. What are the notable trends driving market growth?
Healthy Boost in the Salmon Production.
7. Are there any restraints impacting market growth?
; Volatility in the Prices; Adverse Weather Conditions Affecting Yield.
8. Can you provide examples of recent developments in the market?
N/A
9. What pricing options are available for accessing the report?
Pricing options include single-user, multi-user, and enterprise licenses priced at USD 4750, USD 5250, and USD 8750 respectively.
10. Is the market size provided in terms of value or volume?
The market size is provided in terms of value, measured in Million.
11. Are there any specific market keywords associated with the report?
Yes, the market keyword associated with the report is "Salmon Industry," which aids in identifying and referencing the specific market segment covered.
12. How do I determine which pricing option suits my needs best?
The pricing options vary based on user requirements and access needs. Individual users may opt for single-user licenses, while businesses requiring broader access may choose multi-user or enterprise licenses for cost-effective access to the report.
13. Are there any additional resources or data provided in the Salmon Industry report?
While the report offers comprehensive insights, it's advisable to review the specific contents or supplementary materials provided to ascertain if additional resources or data are available.
14. How can I stay updated on further developments or reports in the Salmon Industry?
To stay informed about further developments, trends, and reports in the Salmon Industry, consider subscribing to industry newsletters, following relevant companies and organizations, or regularly checking reputable industry news sources and publications.
Methodology
Step 1 - Identification of Relevant Samples Size from Population Database


Step 2 - Approaches for Defining Global Market Size (Value, Volume* & Price*)

Note*: In applicable scenarios
Step 3 - Data Sources
Primary Research
- Web Analytics
- Survey Reports
- Research Institute
- Latest Research Reports
- Opinion Leaders
Secondary Research
- Annual Reports
- White Paper
- Latest Press Release
- Industry Association
- Paid Database
- Investor Presentations

Step 4 - Data Triangulation
Involves using different sources of information in order to increase the validity of a study
These sources are likely to be stakeholders in a program - participants, other researchers, program staff, other community members, and so on.
Then we put all data in single framework & apply various statistical tools to find out the dynamic on the market.
During the analysis stage, feedback from the stakeholder groups would be compared to determine areas of agreement as well as areas of divergence


