

Key Insights
The global Satellite Communication (SATCOM) industry is projected for substantial expansion, exhibiting an 11% Compound Annual Growth Rate (CAGR) from 2025 to 2033. This growth is propelled by escalating demand for high-speed internet in remote regions and the increasing integration of IoT devices. Technological advancements, including higher throughput satellites, and government investments in national security and space exploration are also key drivers. The market is segmented by satellite mass, orbit class (GEO, LEO, MEO), communication type (broadcasting, mobile communication, satellite phone), and end-user (commercial, military & government). These diverse applications and innovations ensure sustained market growth.
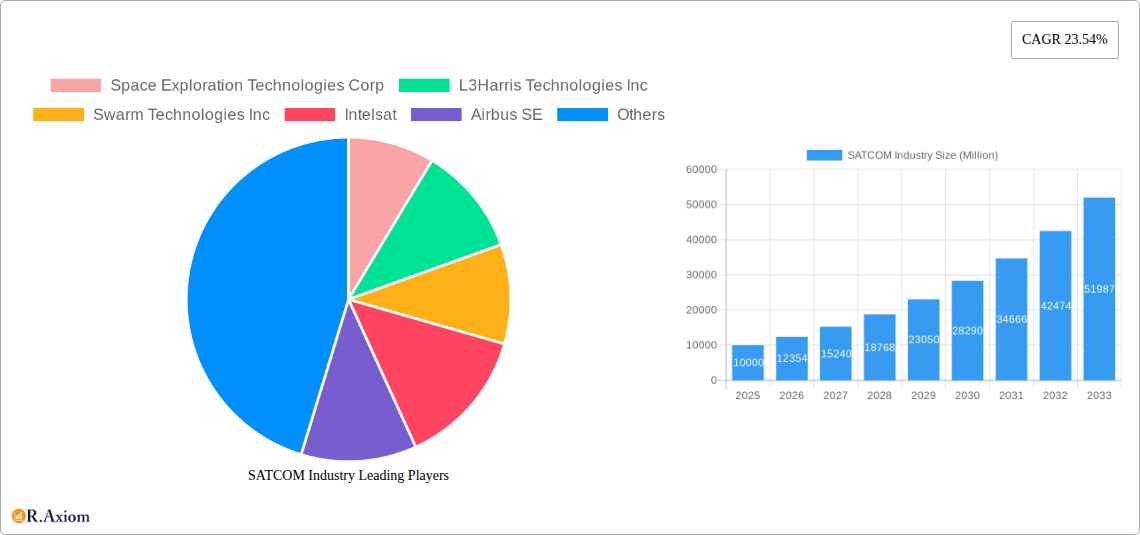
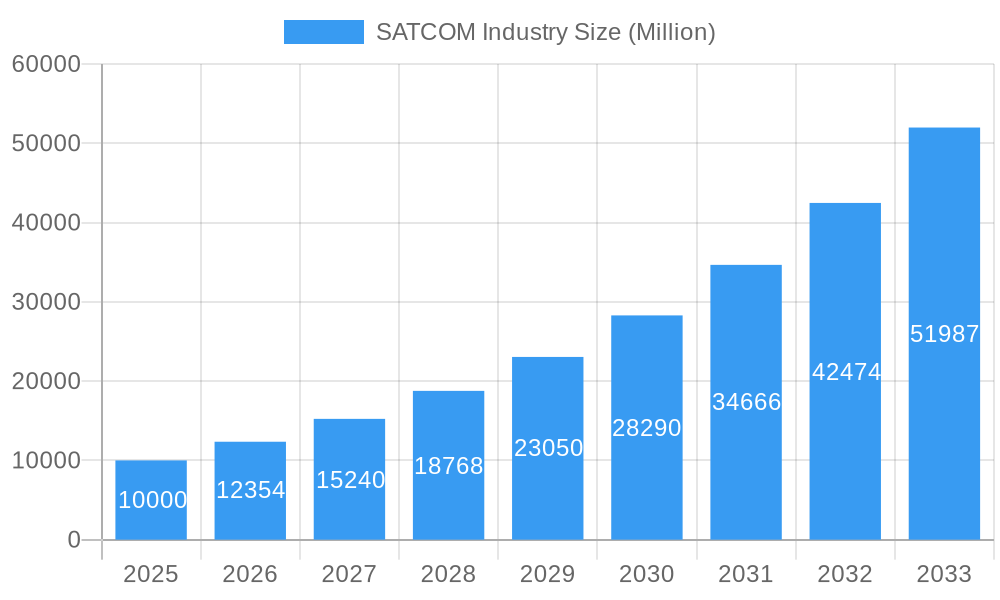
SATCOM Industry Market Size (In Billion)
Leading entities such as SpaceX, L3Harris Technologies, Intelsat, and Airbus are driving industry innovation through strategic partnerships and continuous technological development. While regulatory challenges and significant capital investment persist, the market outlook remains optimistic. The pervasive reliance on satellite technology across defense, maritime, and aerospace sectors, alongside continuous innovation and strategic collaborations, indicates a robust growth trajectory for the SATCOM market.
SATCOM Industry Company Market Share
This report offers a thorough analysis of the global SATCOM market, detailing its size, segmentation, key players, growth drivers, challenges, and future projections. The total market value is estimated at $98.28 billion in 2025, with a forecast period from 2025 to 2033. This research is invaluable for stakeholders, investors, and professionals seeking to comprehend the dynamics of this rapidly evolving sector, providing actionable insights and strategic recommendations.
SATCOM Industry Market Concentration & Innovation
The SATCOM industry exhibits a moderately concentrated market structure, with a few large players holding significant market share. However, the emergence of new technologies and smaller, innovative companies is challenging this established order. Key players such as Space Exploration Technologies Corp, L3Harris Technologies Inc, and Intelsat hold substantial market share, estimated at xx%, xx%, and xx%, respectively, in 2025. Innovation is driven by the demand for higher bandwidth, lower latency, and more efficient satellite technologies. Regulatory frameworks, particularly concerning spectrum allocation and international regulations, significantly influence market dynamics. The rise of terrestrial 5G and other wireless technologies presents a degree of product substitution, particularly in certain segments. M&A activity has been robust, with deal values exceeding xx Million in recent years, reflecting industry consolidation and strategic acquisitions to expand capabilities and market reach. For example, the merger of X and Y in 2022 resulted in a combined market share of approximately Z%. End-user trends are shifting toward greater demand for secure, reliable communication solutions across various sectors, driving innovation in areas like anti-jamming technology and cybersecurity.
SATCOM Industry Industry Trends & Insights
The SATCOM industry is experiencing robust growth, driven by increasing demand for broadband connectivity, especially in underserved regions. The global market is projected to achieve a Compound Annual Growth Rate (CAGR) of xx% during the forecast period (2025-2033). Technological disruptions, such as the adoption of Low Earth Orbit (LEO) constellations and the development of advanced antenna technologies, are transforming the industry landscape. Consumer preferences are shifting towards higher bandwidth, lower latency services, impacting service offerings and pricing strategies. The competitive dynamics are characterized by intense competition among established players and the emergence of new entrants, particularly in the LEO segment. This competition is pushing down prices and driving innovation in terms of both cost efficiency and service quality. Market penetration is increasing rapidly, especially in the mobile communication and broadcasting segments. By 2033, market penetration in the mobile communication segment is anticipated to reach xx%.
Dominant Markets & Segments in SATCOM Industry
Leading Region: North America currently holds the largest market share in the SATCOM industry, driven by strong government spending, advanced technology infrastructure, and a robust commercial sector. This is also significantly impacted by factors such as economic policies supporting space technology research and development.
Dominant Segment:
- Satellite Mass: The 100-500kg satellite mass segment dominates the market due to its optimal balance between payload capacity and launch cost. This segment is expected to show strong growth during the forecast period.
- Orbit Class: GEO satellites continue to hold a significant market share due to their wide coverage area. However, LEO constellations are rapidly gaining traction, particularly for broadband services.
- Communication Type: Broadcasting remains a significant segment, but Mobile Communication and Satellite Phone applications are showing rapid growth, driven by increased demand for connectivity on the move.
- End User: The Commercial sector dominates, followed by the Military & Government sector. This is primarily influenced by the increasing demand for high-speed internet and the reliance of government and military on reliable communication systems.
Detailed dominance analysis reveals that strong growth in developing economies and expanding infrastructure in remote areas are fueling the expansion of specific segments.
SATCOM Industry Product Developments
Recent product innovations focus on higher throughput, lower latency, and improved efficiency. New antenna technologies, advanced signal processing techniques, and the use of software-defined radios are key features. The adoption of LEO constellations is a significant development, offering improved latency and coverage compared to traditional GEO satellites. These advancements cater to the growing demand for high-bandwidth applications such as video streaming, online gaming, and IoT applications, making them highly competitive in the market.
Report Scope & Segmentation Analysis
This report segments the SATCOM market based on Satellite Mass (Below 10 Kg, 10-100kg, 100-500kg, 500-1000kg, above 1000kg), Orbit Class (GEO, LEO, MEO), Communication Type (Broadcasting, Mobile Communication, Satellite Phone, Others), and End User (Commercial, Military & Government, Other). Each segment's growth projections, market sizes, and competitive dynamics are analyzed in detail. For example, the LEO segment is projected to experience significant growth due to the deployment of numerous mega-constellations. Similarly, the mobile communication segment is poised for substantial expansion driven by rising smartphone penetration and demand for connectivity in remote areas.
Key Drivers of SATCOM Industry Growth
Technological advancements, such as the development of high-throughput satellites and advanced antenna technologies, are major growth drivers. Increasing demand for broadband connectivity in both developed and developing countries is another significant factor. Favorable government policies and regulatory frameworks promoting space exploration and investment further propel market expansion.
Challenges in the SATCOM Industry Sector
Regulatory hurdles related to spectrum allocation and international agreements present challenges. Supply chain disruptions and the high cost of satellite manufacturing and launch remain significant barriers. Intense competition among established players and the entry of new competitors create pricing pressures, further affecting market dynamics. These factors contribute to reduced profitability and limit market expansion potential.
Emerging Opportunities in SATCOM Industry
The Internet of Things (IoT) presents a significant opportunity for SATCOM providers, particularly in remote monitoring and data transmission applications. The increasing demand for secure communications in government and military applications drives the need for resilient and secure satellite networks. Furthermore, the expansion of satellite-based services into new markets, particularly in developing countries, offers considerable potential.
Leading Players in the SATCOM Industry Market
- Space Exploration Technologies Corp
- L3Harris Technologies Inc
- Swarm Technologies Inc
- Intelsat
- Airbus SE
- Viasat Inc
- Cobham Limited
- China Aerospace Science and Technology Corporation (CASC)
- Thales
- SKY Perfect JSAT Corporation
- SES S.A.
- Maxar Technologies Inc
- Thuraya Telecommunications Company
- EchoStar Corporation
Key Developments in SATCOM Industry Industry
- February 2023: Anuvu partnered with Telesat to develop new antennas and ground station infrastructure for its constellation, enhancing high-speed connectivity solutions.
- February 2023: SES, in collaboration with ThinKom and Hughes, launched a multi-orbit service for government aerial missions, demonstrating the ThinAir Ka2517 terminal on MEO and GEO networks.
- January 2023: Viasat secured a contract from the United States Marine Corps to provide comprehensive satellite communication support, expanding its existing managed services agreement. These developments highlight the growing demand for advanced satellite communication solutions and the industry's commitment to innovation.
Strategic Outlook for SATCOM Industry Market
The SATCOM industry is poised for continued growth, driven by technological advancements, increasing demand for broadband connectivity, and expansion into new markets. The deployment of mega-constellations and the development of advanced satellite technologies will significantly shape the industry's future. Investing in research and development, strategic partnerships, and adapting to evolving customer needs will be crucial for success in this dynamic market. The long-term outlook remains positive, with substantial growth potential across various segments.
SATCOM Industry Segmentation
-
1. Satellite Mass
- 1.1. 10-100kg
- 1.2. 100-500kg
- 1.3. 500-1000kg
- 1.4. Below 10 Kg
- 1.5. above 1000kg
-
2. Orbit Class
- 2.1. GEO
- 2.2. LEO
- 2.3. MEO
-
3. Communication Type
- 3.1. Broadcasting
- 3.2. Mobile Communication
- 3.3. Satellite Phone
- 3.4. Others
-
4. End User
- 4.1. Commercial
- 4.2. Military & Government
- 4.3. Other
SATCOM Industry Segmentation By Geography
-
1. North America
- 1.1. United States
- 1.2. Canada
- 1.3. Mexico
-
2. South America
- 2.1. Brazil
- 2.2. Argentina
- 2.3. Rest of South America
-
3. Europe
- 3.1. United Kingdom
- 3.2. Germany
- 3.3. France
- 3.4. Italy
- 3.5. Spain
- 3.6. Russia
- 3.7. Benelux
- 3.8. Nordics
- 3.9. Rest of Europe
-
4. Middle East & Africa
- 4.1. Turkey
- 4.2. Israel
- 4.3. GCC
- 4.4. North Africa
- 4.5. South Africa
- 4.6. Rest of Middle East & Africa
-
5. Asia Pacific
- 5.1. China
- 5.2. India
- 5.3. Japan
- 5.4. South Korea
- 5.5. ASEAN
- 5.6. Oceania
- 5.7. Rest of Asia Pacific
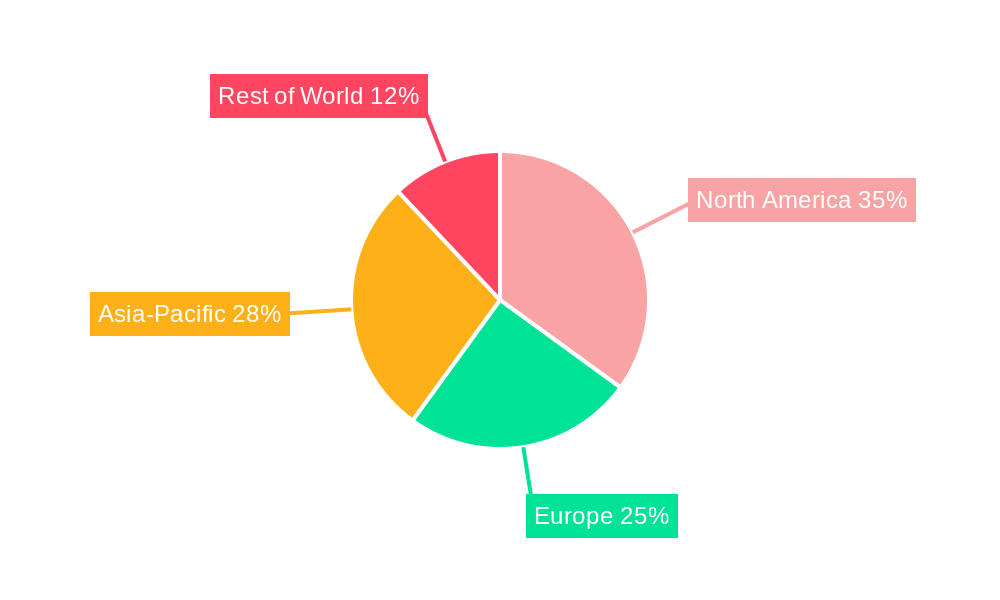
SATCOM Industry Regional Market Share
Geographic Coverage of SATCOM Industry
SATCOM Industry REPORT HIGHLIGHTS
| Aspects | Details |
|---|---|
| Study Period | 2020-2034 |
| Base Year | 2025 |
| Estimated Year | 2026 |
| Forecast Period | 2026-2034 |
| Historical Period | 2020-2025 |
| Growth Rate | CAGR of 11% from 2020-2034 |
| Segmentation |
|
Table of Contents
- 1. Introduction
- 1.1. Research Scope
- 1.2. Market Segmentation
- 1.3. Research Objective
- 1.4. Definitions and Assumptions
- 2. Executive Summary
- 2.1. Market Snapshot
- 3. Market Dynamics
- 3.1. Market Drivers
- 3.2. Market Restrains
- 3.3. Market Trends
- 3.4. Market Opportunities
- 4. Market Factor Analysis
- 4.1. Porters Five Forces
- 4.1.1. Bargaining Power of Suppliers
- 4.1.2. Bargaining Power of Buyers
- 4.1.3. Threat of New Entrants
- 4.1.4. Threat of Substitutes
- 4.1.5. Competitive Rivalry
- 4.2. PESTEL analysis
- 4.3. BCG Analysis
- 4.3.1. Stars (High Growth, High Market Share)
- 4.3.2. Cash Cows (Low Growth, High Market Share)
- 4.3.3. Question Mark (High Growth, Low Market Share)
- 4.3.4. Dogs (Low Growth, Low Market Share)
- 4.4. Ansoff Matrix Analysis
- 4.5. Supply Chain Analysis
- 4.6. Regulatory Landscape
- 4.7. Current Market Potential and Opportunity Assessment (TAM–SAM–SOM Framework)
- 4.8. RAX Analyst Note
- 4.1. Porters Five Forces
- 5. Market Analysis, Insights and Forecast 2021-2033
- 5.1. Market Analysis, Insights and Forecast - by Satellite Mass
- 5.1.1. 10-100kg
- 5.1.2. 100-500kg
- 5.1.3. 500-1000kg
- 5.1.4. Below 10 Kg
- 5.1.5. above 1000kg
- 5.2. Market Analysis, Insights and Forecast - by Orbit Class
- 5.2.1. GEO
- 5.2.2. LEO
- 5.2.3. MEO
- 5.3. Market Analysis, Insights and Forecast - by Communication Type
- 5.3.1. Broadcasting
- 5.3.2. Mobile Communication
- 5.3.3. Satellite Phone
- 5.3.4. Others
- 5.4. Market Analysis, Insights and Forecast - by End User
- 5.4.1. Commercial
- 5.4.2. Military & Government
- 5.4.3. Other
- 5.5. Market Analysis, Insights and Forecast - by Region
- 5.5.1. North America
- 5.5.2. South America
- 5.5.3. Europe
- 5.5.4. Middle East & Africa
- 5.5.5. Asia Pacific
- 5.1. Market Analysis, Insights and Forecast - by Satellite Mass
- 6. Global SATCOM Industry Analysis, Insights and Forecast, 2021-2033
- 6.1. Market Analysis, Insights and Forecast - by Satellite Mass
- 6.1.1. 10-100kg
- 6.1.2. 100-500kg
- 6.1.3. 500-1000kg
- 6.1.4. Below 10 Kg
- 6.1.5. above 1000kg
- 6.2. Market Analysis, Insights and Forecast - by Orbit Class
- 6.2.1. GEO
- 6.2.2. LEO
- 6.2.3. MEO
- 6.3. Market Analysis, Insights and Forecast - by Communication Type
- 6.3.1. Broadcasting
- 6.3.2. Mobile Communication
- 6.3.3. Satellite Phone
- 6.3.4. Others
- 6.4. Market Analysis, Insights and Forecast - by End User
- 6.4.1. Commercial
- 6.4.2. Military & Government
- 6.4.3. Other
- 6.1. Market Analysis, Insights and Forecast - by Satellite Mass
- 7. North America SATCOM Industry Analysis, Insights and Forecast, 2020-2032
- 7.1. Market Analysis, Insights and Forecast - by Satellite Mass
- 7.1.1. 10-100kg
- 7.1.2. 100-500kg
- 7.1.3. 500-1000kg
- 7.1.4. Below 10 Kg
- 7.1.5. above 1000kg
- 7.2. Market Analysis, Insights and Forecast - by Orbit Class
- 7.2.1. GEO
- 7.2.2. LEO
- 7.2.3. MEO
- 7.3. Market Analysis, Insights and Forecast - by Communication Type
- 7.3.1. Broadcasting
- 7.3.2. Mobile Communication
- 7.3.3. Satellite Phone
- 7.3.4. Others
- 7.4. Market Analysis, Insights and Forecast - by End User
- 7.4.1. Commercial
- 7.4.2. Military & Government
- 7.4.3. Other
- 7.1. Market Analysis, Insights and Forecast - by Satellite Mass
- 8. South America SATCOM Industry Analysis, Insights and Forecast, 2020-2032
- 8.1. Market Analysis, Insights and Forecast - by Satellite Mass
- 8.1.1. 10-100kg
- 8.1.2. 100-500kg
- 8.1.3. 500-1000kg
- 8.1.4. Below 10 Kg
- 8.1.5. above 1000kg
- 8.2. Market Analysis, Insights and Forecast - by Orbit Class
- 8.2.1. GEO
- 8.2.2. LEO
- 8.2.3. MEO
- 8.3. Market Analysis, Insights and Forecast - by Communication Type
- 8.3.1. Broadcasting
- 8.3.2. Mobile Communication
- 8.3.3. Satellite Phone
- 8.3.4. Others
- 8.4. Market Analysis, Insights and Forecast - by End User
- 8.4.1. Commercial
- 8.4.2. Military & Government
- 8.4.3. Other
- 8.1. Market Analysis, Insights and Forecast - by Satellite Mass
- 9. Europe SATCOM Industry Analysis, Insights and Forecast, 2020-2032
- 9.1. Market Analysis, Insights and Forecast - by Satellite Mass
- 9.1.1. 10-100kg
- 9.1.2. 100-500kg
- 9.1.3. 500-1000kg
- 9.1.4. Below 10 Kg
- 9.1.5. above 1000kg
- 9.2. Market Analysis, Insights and Forecast - by Orbit Class
- 9.2.1. GEO
- 9.2.2. LEO
- 9.2.3. MEO
- 9.3. Market Analysis, Insights and Forecast - by Communication Type
- 9.3.1. Broadcasting
- 9.3.2. Mobile Communication
- 9.3.3. Satellite Phone
- 9.3.4. Others
- 9.4. Market Analysis, Insights and Forecast - by End User
- 9.4.1. Commercial
- 9.4.2. Military & Government
- 9.4.3. Other
- 9.1. Market Analysis, Insights and Forecast - by Satellite Mass
- 10. Middle East & Africa SATCOM Industry Analysis, Insights and Forecast, 2020-2032
- 10.1. Market Analysis, Insights and Forecast - by Satellite Mass
- 10.1.1. 10-100kg
- 10.1.2. 100-500kg
- 10.1.3. 500-1000kg
- 10.1.4. Below 10 Kg
- 10.1.5. above 1000kg
- 10.2. Market Analysis, Insights and Forecast - by Orbit Class
- 10.2.1. GEO
- 10.2.2. LEO
- 10.2.3. MEO
- 10.3. Market Analysis, Insights and Forecast - by Communication Type
- 10.3.1. Broadcasting
- 10.3.2. Mobile Communication
- 10.3.3. Satellite Phone
- 10.3.4. Others
- 10.4. Market Analysis, Insights and Forecast - by End User
- 10.4.1. Commercial
- 10.4.2. Military & Government
- 10.4.3. Other
- 10.1. Market Analysis, Insights and Forecast - by Satellite Mass
- 11. Asia Pacific SATCOM Industry Analysis, Insights and Forecast, 2020-2032
- 11.1. Market Analysis, Insights and Forecast - by Satellite Mass
- 11.1.1. 10-100kg
- 11.1.2. 100-500kg
- 11.1.3. 500-1000kg
- 11.1.4. Below 10 Kg
- 11.1.5. above 1000kg
- 11.2. Market Analysis, Insights and Forecast - by Orbit Class
- 11.2.1. GEO
- 11.2.2. LEO
- 11.2.3. MEO
- 11.3. Market Analysis, Insights and Forecast - by Communication Type
- 11.3.1. Broadcasting
- 11.3.2. Mobile Communication
- 11.3.3. Satellite Phone
- 11.3.4. Others
- 11.4. Market Analysis, Insights and Forecast - by End User
- 11.4.1. Commercial
- 11.4.2. Military & Government
- 11.4.3. Other
- 11.1. Market Analysis, Insights and Forecast - by Satellite Mass
- 12. Competitive Analysis
- 12.1. Company Profiles
- 12.1.1 Space Exploration Technologies Corp
- 12.1.1.1. Company Overview
- 12.1.1.2. Products
- 12.1.1.3. Company Financials
- 12.1.1.4. SWOT Analysis
- 12.1.2 L3Harris Technologies Inc
- 12.1.2.1. Company Overview
- 12.1.2.2. Products
- 12.1.2.3. Company Financials
- 12.1.2.4. SWOT Analysis
- 12.1.3 Swarm Technologies Inc
- 12.1.3.1. Company Overview
- 12.1.3.2. Products
- 12.1.3.3. Company Financials
- 12.1.3.4. SWOT Analysis
- 12.1.4 Intelsat
- 12.1.4.1. Company Overview
- 12.1.4.2. Products
- 12.1.4.3. Company Financials
- 12.1.4.4. SWOT Analysis
- 12.1.5 Airbus SE
- 12.1.5.1. Company Overview
- 12.1.5.2. Products
- 12.1.5.3. Company Financials
- 12.1.5.4. SWOT Analysis
- 12.1.6 Viasat Inc
- 12.1.6.1. Company Overview
- 12.1.6.2. Products
- 12.1.6.3. Company Financials
- 12.1.6.4. SWOT Analysis
- 12.1.7 Cobham Limited
- 12.1.7.1. Company Overview
- 12.1.7.2. Products
- 12.1.7.3. Company Financials
- 12.1.7.4. SWOT Analysis
- 12.1.8 China Aerospace Science and Technology Corporation (CASC)
- 12.1.8.1. Company Overview
- 12.1.8.2. Products
- 12.1.8.3. Company Financials
- 12.1.8.4. SWOT Analysis
- 12.1.9 Thales
- 12.1.9.1. Company Overview
- 12.1.9.2. Products
- 12.1.9.3. Company Financials
- 12.1.9.4. SWOT Analysis
- 12.1.10 SKY Perfect JSAT Corporation
- 12.1.10.1. Company Overview
- 12.1.10.2. Products
- 12.1.10.3. Company Financials
- 12.1.10.4. SWOT Analysis
- 12.1.11 SES S A
- 12.1.11.1. Company Overview
- 12.1.11.2. Products
- 12.1.11.3. Company Financials
- 12.1.11.4. SWOT Analysis
- 12.1.12 Maxar Technologies Inc
- 12.1.12.1. Company Overview
- 12.1.12.2. Products
- 12.1.12.3. Company Financials
- 12.1.12.4. SWOT Analysis
- 12.1.13 Thuraya Telecommunications Company
- 12.1.13.1. Company Overview
- 12.1.13.2. Products
- 12.1.13.3. Company Financials
- 12.1.13.4. SWOT Analysis
- 12.1.14 EchoStar Corporation
- 12.1.14.1. Company Overview
- 12.1.14.2. Products
- 12.1.14.3. Company Financials
- 12.1.14.4. SWOT Analysis
- 12.1.1 Space Exploration Technologies Corp
- 12.2. Market Entropy
- 12.2.1 Company's Key Areas Served
- 12.2.2 Recent Developments
- 12.3. Company Market Share Analysis 2025
- 12.3.1 Top 5 Companies Market Share Analysis
- 12.3.2 Top 3 Companies Market Share Analysis
- 12.4. List of Potential Customers
- 13. Research Methodology
List of Figures
- Figure 1: Global SATCOM Industry Revenue Breakdown (billion, %) by Region 2025 & 2033
- Figure 2: North America SATCOM Industry Revenue (billion), by Satellite Mass 2025 & 2033
- Figure 3: North America SATCOM Industry Revenue Share (%), by Satellite Mass 2025 & 2033
- Figure 4: North America SATCOM Industry Revenue (billion), by Orbit Class 2025 & 2033
- Figure 5: North America SATCOM Industry Revenue Share (%), by Orbit Class 2025 & 2033
- Figure 6: North America SATCOM Industry Revenue (billion), by Communication Type 2025 & 2033
- Figure 7: North America SATCOM Industry Revenue Share (%), by Communication Type 2025 & 2033
- Figure 8: North America SATCOM Industry Revenue (billion), by End User 2025 & 2033
- Figure 9: North America SATCOM Industry Revenue Share (%), by End User 2025 & 2033
- Figure 10: North America SATCOM Industry Revenue (billion), by Country 2025 & 2033
- Figure 11: North America SATCOM Industry Revenue Share (%), by Country 2025 & 2033
- Figure 12: South America SATCOM Industry Revenue (billion), by Satellite Mass 2025 & 2033
- Figure 13: South America SATCOM Industry Revenue Share (%), by Satellite Mass 2025 & 2033
- Figure 14: South America SATCOM Industry Revenue (billion), by Orbit Class 2025 & 2033
- Figure 15: South America SATCOM Industry Revenue Share (%), by Orbit Class 2025 & 2033
- Figure 16: South America SATCOM Industry Revenue (billion), by Communication Type 2025 & 2033
- Figure 17: South America SATCOM Industry Revenue Share (%), by Communication Type 2025 & 2033
- Figure 18: South America SATCOM Industry Revenue (billion), by End User 2025 & 2033
- Figure 19: South America SATCOM Industry Revenue Share (%), by End User 2025 & 2033
- Figure 20: South America SATCOM Industry Revenue (billion), by Country 2025 & 2033
- Figure 21: South America SATCOM Industry Revenue Share (%), by Country 2025 & 2033
- Figure 22: Europe SATCOM Industry Revenue (billion), by Satellite Mass 2025 & 2033
- Figure 23: Europe SATCOM Industry Revenue Share (%), by Satellite Mass 2025 & 2033
- Figure 24: Europe SATCOM Industry Revenue (billion), by Orbit Class 2025 & 2033
- Figure 25: Europe SATCOM Industry Revenue Share (%), by Orbit Class 2025 & 2033
- Figure 26: Europe SATCOM Industry Revenue (billion), by Communication Type 2025 & 2033
- Figure 27: Europe SATCOM Industry Revenue Share (%), by Communication Type 2025 & 2033
- Figure 28: Europe SATCOM Industry Revenue (billion), by End User 2025 & 2033
- Figure 29: Europe SATCOM Industry Revenue Share (%), by End User 2025 & 2033
- Figure 30: Europe SATCOM Industry Revenue (billion), by Country 2025 & 2033
- Figure 31: Europe SATCOM Industry Revenue Share (%), by Country 2025 & 2033
- Figure 32: Middle East & Africa SATCOM Industry Revenue (billion), by Satellite Mass 2025 & 2033
- Figure 33: Middle East & Africa SATCOM Industry Revenue Share (%), by Satellite Mass 2025 & 2033
- Figure 34: Middle East & Africa SATCOM Industry Revenue (billion), by Orbit Class 2025 & 2033
- Figure 35: Middle East & Africa SATCOM Industry Revenue Share (%), by Orbit Class 2025 & 2033
- Figure 36: Middle East & Africa SATCOM Industry Revenue (billion), by Communication Type 2025 & 2033
- Figure 37: Middle East & Africa SATCOM Industry Revenue Share (%), by Communication Type 2025 & 2033
- Figure 38: Middle East & Africa SATCOM Industry Revenue (billion), by End User 2025 & 2033
- Figure 39: Middle East & Africa SATCOM Industry Revenue Share (%), by End User 2025 & 2033
- Figure 40: Middle East & Africa SATCOM Industry Revenue (billion), by Country 2025 & 2033
- Figure 41: Middle East & Africa SATCOM Industry Revenue Share (%), by Country 2025 & 2033
- Figure 42: Asia Pacific SATCOM Industry Revenue (billion), by Satellite Mass 2025 & 2033
- Figure 43: Asia Pacific SATCOM Industry Revenue Share (%), by Satellite Mass 2025 & 2033
- Figure 44: Asia Pacific SATCOM Industry Revenue (billion), by Orbit Class 2025 & 2033
- Figure 45: Asia Pacific SATCOM Industry Revenue Share (%), by Orbit Class 2025 & 2033
- Figure 46: Asia Pacific SATCOM Industry Revenue (billion), by Communication Type 2025 & 2033
- Figure 47: Asia Pacific SATCOM Industry Revenue Share (%), by Communication Type 2025 & 2033
- Figure 48: Asia Pacific SATCOM Industry Revenue (billion), by End User 2025 & 2033
- Figure 49: Asia Pacific SATCOM Industry Revenue Share (%), by End User 2025 & 2033
- Figure 50: Asia Pacific SATCOM Industry Revenue (billion), by Country 2025 & 2033
- Figure 51: Asia Pacific SATCOM Industry Revenue Share (%), by Country 2025 & 2033
List of Tables
- Table 1: Global SATCOM Industry Revenue billion Forecast, by Satellite Mass 2020 & 2033
- Table 2: Global SATCOM Industry Revenue billion Forecast, by Orbit Class 2020 & 2033
- Table 3: Global SATCOM Industry Revenue billion Forecast, by Communication Type 2020 & 2033
- Table 4: Global SATCOM Industry Revenue billion Forecast, by End User 2020 & 2033
- Table 5: Global SATCOM Industry Revenue billion Forecast, by Region 2020 & 2033
- Table 6: Global SATCOM Industry Revenue billion Forecast, by Satellite Mass 2020 & 2033
- Table 7: Global SATCOM Industry Revenue billion Forecast, by Orbit Class 2020 & 2033
- Table 8: Global SATCOM Industry Revenue billion Forecast, by Communication Type 2020 & 2033
- Table 9: Global SATCOM Industry Revenue billion Forecast, by End User 2020 & 2033
- Table 10: Global SATCOM Industry Revenue billion Forecast, by Country 2020 & 2033
- Table 11: United States SATCOM Industry Revenue (billion) Forecast, by Application 2020 & 2033
- Table 12: Canada SATCOM Industry Revenue (billion) Forecast, by Application 2020 & 2033
- Table 13: Mexico SATCOM Industry Revenue (billion) Forecast, by Application 2020 & 2033
- Table 14: Global SATCOM Industry Revenue billion Forecast, by Satellite Mass 2020 & 2033
- Table 15: Global SATCOM Industry Revenue billion Forecast, by Orbit Class 2020 & 2033
- Table 16: Global SATCOM Industry Revenue billion Forecast, by Communication Type 2020 & 2033
- Table 17: Global SATCOM Industry Revenue billion Forecast, by End User 2020 & 2033
- Table 18: Global SATCOM Industry Revenue billion Forecast, by Country 2020 & 2033
- Table 19: Brazil SATCOM Industry Revenue (billion) Forecast, by Application 2020 & 2033
- Table 20: Argentina SATCOM Industry Revenue (billion) Forecast, by Application 2020 & 2033
- Table 21: Rest of South America SATCOM Industry Revenue (billion) Forecast, by Application 2020 & 2033
- Table 22: Global SATCOM Industry Revenue billion Forecast, by Satellite Mass 2020 & 2033
- Table 23: Global SATCOM Industry Revenue billion Forecast, by Orbit Class 2020 & 2033
- Table 24: Global SATCOM Industry Revenue billion Forecast, by Communication Type 2020 & 2033
- Table 25: Global SATCOM Industry Revenue billion Forecast, by End User 2020 & 2033
- Table 26: Global SATCOM Industry Revenue billion Forecast, by Country 2020 & 2033
- Table 27: United Kingdom SATCOM Industry Revenue (billion) Forecast, by Application 2020 & 2033
- Table 28: Germany SATCOM Industry Revenue (billion) Forecast, by Application 2020 & 2033
- Table 29: France SATCOM Industry Revenue (billion) Forecast, by Application 2020 & 2033
- Table 30: Italy SATCOM Industry Revenue (billion) Forecast, by Application 2020 & 2033
- Table 31: Spain SATCOM Industry Revenue (billion) Forecast, by Application 2020 & 2033
- Table 32: Russia SATCOM Industry Revenue (billion) Forecast, by Application 2020 & 2033
- Table 33: Benelux SATCOM Industry Revenue (billion) Forecast, by Application 2020 & 2033
- Table 34: Nordics SATCOM Industry Revenue (billion) Forecast, by Application 2020 & 2033
- Table 35: Rest of Europe SATCOM Industry Revenue (billion) Forecast, by Application 2020 & 2033
- Table 36: Global SATCOM Industry Revenue billion Forecast, by Satellite Mass 2020 & 2033
- Table 37: Global SATCOM Industry Revenue billion Forecast, by Orbit Class 2020 & 2033
- Table 38: Global SATCOM Industry Revenue billion Forecast, by Communication Type 2020 & 2033
- Table 39: Global SATCOM Industry Revenue billion Forecast, by End User 2020 & 2033
- Table 40: Global SATCOM Industry Revenue billion Forecast, by Country 2020 & 2033
- Table 41: Turkey SATCOM Industry Revenue (billion) Forecast, by Application 2020 & 2033
- Table 42: Israel SATCOM Industry Revenue (billion) Forecast, by Application 2020 & 2033
- Table 43: GCC SATCOM Industry Revenue (billion) Forecast, by Application 2020 & 2033
- Table 44: North Africa SATCOM Industry Revenue (billion) Forecast, by Application 2020 & 2033
- Table 45: South Africa SATCOM Industry Revenue (billion) Forecast, by Application 2020 & 2033
- Table 46: Rest of Middle East & Africa SATCOM Industry Revenue (billion) Forecast, by Application 2020 & 2033
- Table 47: Global SATCOM Industry Revenue billion Forecast, by Satellite Mass 2020 & 2033
- Table 48: Global SATCOM Industry Revenue billion Forecast, by Orbit Class 2020 & 2033
- Table 49: Global SATCOM Industry Revenue billion Forecast, by Communication Type 2020 & 2033
- Table 50: Global SATCOM Industry Revenue billion Forecast, by End User 2020 & 2033
- Table 51: Global SATCOM Industry Revenue billion Forecast, by Country 2020 & 2033
- Table 52: China SATCOM Industry Revenue (billion) Forecast, by Application 2020 & 2033
- Table 53: India SATCOM Industry Revenue (billion) Forecast, by Application 2020 & 2033
- Table 54: Japan SATCOM Industry Revenue (billion) Forecast, by Application 2020 & 2033
- Table 55: South Korea SATCOM Industry Revenue (billion) Forecast, by Application 2020 & 2033
- Table 56: ASEAN SATCOM Industry Revenue (billion) Forecast, by Application 2020 & 2033
- Table 57: Oceania SATCOM Industry Revenue (billion) Forecast, by Application 2020 & 2033
- Table 58: Rest of Asia Pacific SATCOM Industry Revenue (billion) Forecast, by Application 2020 & 2033
Frequently Asked Questions
1. What is the projected Compound Annual Growth Rate (CAGR) of the SATCOM Industry?
The projected CAGR is approximately 11%.
2. Which companies are prominent players in the SATCOM Industry?
Key companies in the market include Space Exploration Technologies Corp, L3Harris Technologies Inc, Swarm Technologies Inc, Intelsat, Airbus SE, Viasat Inc, Cobham Limited, China Aerospace Science and Technology Corporation (CASC), Thales, SKY Perfect JSAT Corporation, SES S A, Maxar Technologies Inc, Thuraya Telecommunications Company, EchoStar Corporation.
3. What are the main segments of the SATCOM Industry?
The market segments include Satellite Mass, Orbit Class, Communication Type, End User.
4. Can you provide details about the market size?
The market size is estimated to be USD 98.28 billion as of 2022.
5. What are some drivers contributing to market growth?
N/A
6. What are the notable trends driving market growth?
OTHER KEY INDUSTRY TRENDS COVERED IN THE REPORT.
7. Are there any restraints impacting market growth?
N/A
8. Can you provide examples of recent developments in the market?
February 2023: Anuvu, a provider of high-speed connectivity solutions has signed an agreement with Telesat for new antennas and ground-station infrastructure to support the development of the Anuvu Constellation.February 2023: SES, in partnership with ThinKom and Hughes, has introduced a revolutionary high-performance multi-orbit service capable of supporting multiple solutions for government aerial missions. Open Architecture ThinKom ThinAir Ka2517 aerial satcom terminal has been successfully demonstrated on SES's Medium Earth Orbit (MEO) and Geostationary (GEO) satellite networksJanuary 2023: Satellite communications provider Viasat has been awarded a contract by the United States Marine Corps to provide end-to-end satellite communications support, extending the agreement under which it provides satellite communications solutions under managed services.
9. What pricing options are available for accessing the report?
Pricing options include single-user, multi-user, and enterprise licenses priced at USD 3800, USD 4500, and USD 5800 respectively.
10. Is the market size provided in terms of value or volume?
The market size is provided in terms of value, measured in billion.
11. Are there any specific market keywords associated with the report?
Yes, the market keyword associated with the report is "SATCOM Industry," which aids in identifying and referencing the specific market segment covered.
12. How do I determine which pricing option suits my needs best?
The pricing options vary based on user requirements and access needs. Individual users may opt for single-user licenses, while businesses requiring broader access may choose multi-user or enterprise licenses for cost-effective access to the report.
13. Are there any additional resources or data provided in the SATCOM Industry report?
While the report offers comprehensive insights, it's advisable to review the specific contents or supplementary materials provided to ascertain if additional resources or data are available.
14. How can I stay updated on further developments or reports in the SATCOM Industry?
To stay informed about further developments, trends, and reports in the SATCOM Industry, consider subscribing to industry newsletters, following relevant companies and organizations, or regularly checking reputable industry news sources and publications.
Methodology
Step 1 - Identification of Relevant Samples Size from Population Database


Step 2 - Approaches for Defining Global Market Size (Value, Volume* & Price*)

Note*: In applicable scenarios
Step 3 - Data Sources
Primary Research
- Web Analytics
- Survey Reports
- Research Institute
- Latest Research Reports
- Opinion Leaders
Secondary Research
- Annual Reports
- White Paper
- Latest Press Release
- Industry Association
- Paid Database
- Investor Presentations

Step 4 - Data Triangulation
Involves using different sources of information in order to increase the validity of a study
These sources are likely to be stakeholders in a program - participants, other researchers, program staff, other community members, and so on.
Then we put all data in single framework & apply various statistical tools to find out the dynamic on the market.
During the analysis stage, feedback from the stakeholder groups would be compared to determine areas of agreement as well as areas of divergence