

Key Insights
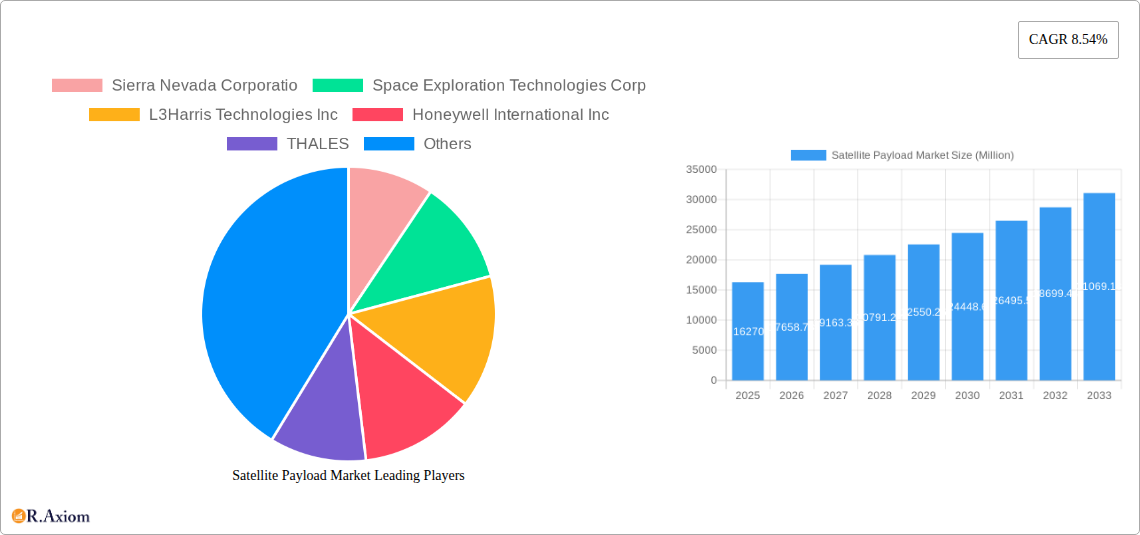
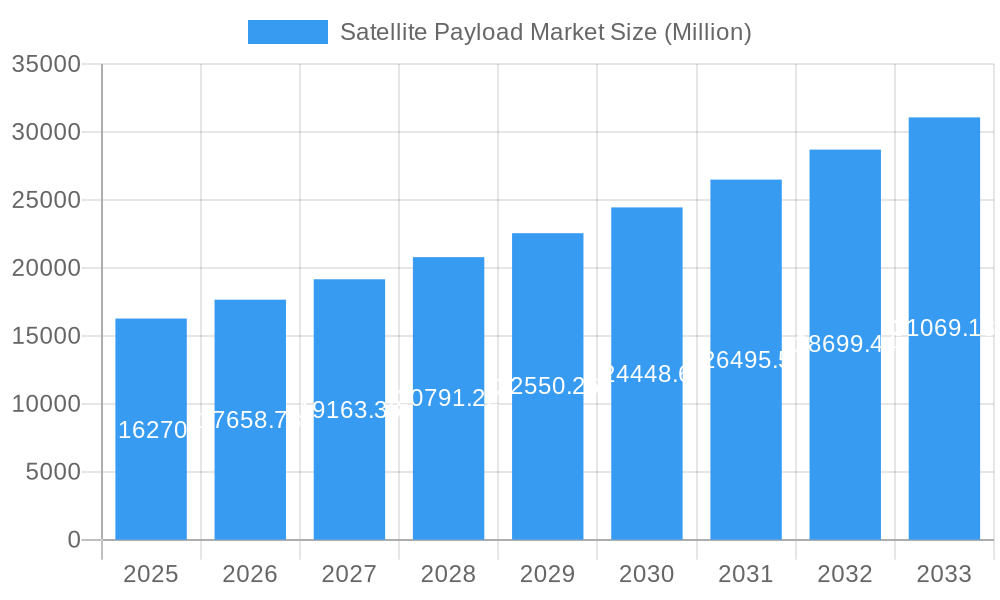
The global satellite payload market, valued at $16.27 billion in 2025, is projected to experience robust growth, exhibiting a compound annual growth rate (CAGR) of 8.54% from 2025 to 2033. This expansion is driven by several key factors. Increasing demand for high-resolution imagery from both commercial and military sectors fuels the growth of imaging payloads. The proliferation of telecommunication satellites, particularly within Low Earth Orbit (LEO) constellations providing broadband internet access, significantly contributes to market expansion. Furthermore, advancements in miniaturization and cost reduction of payload components, coupled with the growing adoption of NewSpace initiatives and private investment in space exploration, are propelling market growth. Government investments in scientific research, weather monitoring, and national security applications also play a vital role. The market segmentation reveals a diverse landscape: GEO (Geostationary Earth Orbit) payloads continue to be significant, while the LEO segment exhibits the highest growth potential, driven by mega-constellations. Commercial applications dominate the end-use segment, followed by military applications. Communication payloads represent the largest share of payload types, although navigation and imaging payloads are witnessing strong growth.
Satellite Payload Market Market Size (In Billion)
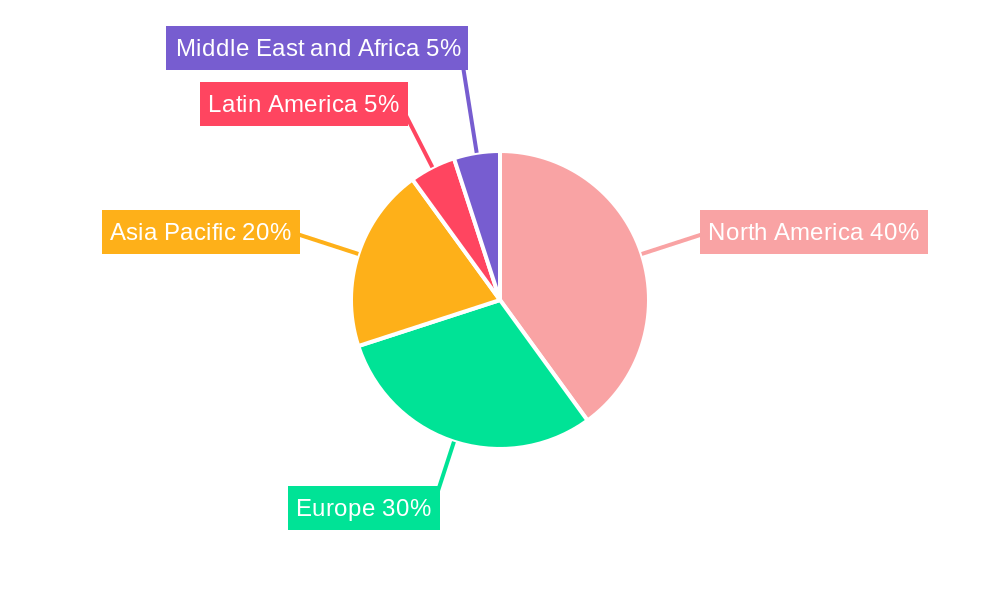
Regional analysis indicates North America and Europe currently hold substantial market shares due to established space agencies and technological advancements. However, the Asia-Pacific region, particularly China and India, is witnessing rapid growth, driven by increasing investments in space technology and infrastructure. The competitive landscape is characterized by major players such as SpaceX, Lockheed Martin, Airbus, and Boeing, along with prominent regional players like ISRO (Indian Space Research Organisation). Strategic partnerships, mergers, and acquisitions are anticipated to further shape the market dynamics in the coming years. While supply chain constraints and the high cost of launch services could pose challenges, the overall outlook for the satellite payload market remains positive, with significant opportunities for growth and innovation across all segments.
Satellite Payload Market Company Market Share
Satellite Payload Market: A Comprehensive Report (2019-2033)
This meticulously researched report provides a deep dive into the Satellite Payload Market, offering actionable insights for industry stakeholders, investors, and strategic decision-makers. Spanning the period from 2019 to 2033, with a base year of 2025 and a forecast period of 2025-2033, this report analyzes market trends, competitive dynamics, and future growth potential, providing a holistic understanding of this rapidly evolving sector. The report segments the market by orbit (GEO, MEO, LEO), end-use (commercial, military), application (weather monitoring, telecommunication, surveillance, scientific research, other applications), and payload type (communication, navigation, imaging, others). Key players such as Sierra Nevada Corporation, Space Exploration Technologies Corp (SpaceX), L3Harris Technologies Inc, Honeywell International Inc, Thales, General Dynamics Corporation, Lockheed Martin Corporation, Airbus SE, RTX Corporation, ISRO, Northrop Grumman Corporation, and The Boeing Company are thoroughly profiled.
Satellite Payload Market Market Concentration & Innovation
The Satellite Payload Market exhibits a moderately concentrated landscape, dominated by a handful of major players commanding significant market share. In 2025, the top five companies are estimated to hold approximately xx% of the global market, with SpaceX and Lockheed Martin holding the largest shares. However, increasing participation from smaller, specialized companies is driving innovation and competition.
- Market Concentration: The Herfindahl-Hirschman Index (HHI) is estimated to be xx in 2025, indicating a moderately concentrated market.
- Innovation Drivers: Advancements in miniaturization, high-throughput satellite technology, AI-powered data analytics, and the growing demand for cost-effective solutions are major innovation drivers.
- Regulatory Frameworks: International space laws and national regulations governing satellite launches and operations significantly influence market dynamics. Variations in these regulations across different regions impact market growth and investment strategies.
- Product Substitutes: While traditional satellite payloads remain dominant, the rise of terrestrial communication networks and other alternative technologies presents a certain level of substitution.
- End-User Trends: The increasing demand for high-bandwidth connectivity, improved imagery resolution for both commercial and military applications, and advanced weather forecasting capabilities fuels market growth.
- M&A Activities: Significant M&A activity is observed in the sector, with deal values reaching xx Million in 2024, primarily driven by companies aiming to expand their capabilities and market reach. Consolidation is expected to continue, further shaping the market landscape.
Satellite Payload Market Industry Trends & Insights
The Satellite Payload Market is experiencing robust growth, driven by a confluence of factors. The global market is projected to reach xx Million by 2033, exhibiting a CAGR of xx% during the forecast period (2025-2033). The increasing adoption of satellite-based services across diverse sectors, coupled with technological advancements, is fueling this expansion. Market penetration in emerging economies is also rising, creating new avenues for growth.
Technological disruptions, such as the development of smaller, more efficient payloads and the integration of advanced sensor technologies, are reshaping the market. Consumer preferences are shifting towards high-quality, reliable, and cost-effective satellite-based services, impacting product development and deployment strategies. The competitive dynamics are characterized by intense rivalry among established players and the emergence of new entrants, necessitating continuous innovation and strategic adaptations.
Dominant Markets & Segments in Satellite Payload Market
The Commercial segment holds a dominant position, accounting for xx% of the market in 2025. This sector is driven by increasing demand for communication services, earth observation, and navigation systems. The LEO orbit segment is experiencing the fastest growth, benefiting from reduced launch costs and improved accessibility. The North American market is currently the largest, with substantial government investment driving this leadership.
- Key Drivers for Commercial Segment: High demand for broadband internet access, growth in the IoT sector, and increasing use of satellite imagery for various applications.
- Key Drivers for LEO Orbit: Lower launch costs, ease of deployment, and the capability to provide global coverage.
- Key Drivers for North American Market: Strong government support for space exploration, robust private sector investment, and established infrastructure.
Satellite Payload Market Product Developments
Recent years have witnessed significant advancements in payload technology, including the development of smaller, lighter, and more efficient communication payloads, improved high-resolution imaging sensors, and advanced navigation payloads. These innovations offer enhanced performance, reduced costs, and improved market fit across various applications. The integration of AI and machine learning in payload design and operation is a key emerging trend, enabling autonomous operation and enhanced data analysis.
Report Scope & Segmentation Analysis
This report segments the Satellite Payload Market by Orbit (GEO, MEO, LEO), End-Use (Commercial, Military), Application (Weather Monitoring, Telecommunication, Surveillance, Scientific Research, Other Applications), and Payload Type (Communication, Navigation, Imaging, Others). Each segment is analyzed in detail, providing insights into its market size, growth projections, and competitive dynamics. For instance, the Communication payload type is projected to maintain its dominance throughout the forecast period due to the escalating demand for global connectivity. Similarly, the commercial end-use segment is expected to witness significant expansion, primarily fueled by advancements in communication technologies and rising adoption of satellite-based solutions across various industries.
Key Drivers of Satellite Payload Market Growth
Several factors contribute to the growth of the Satellite Payload Market. Technological advancements, such as miniaturization and increased efficiency of satellite payloads, significantly reduce launch costs and improve performance. The growing demand for high-bandwidth communication services across diverse sectors, including telecommunications and the Internet of Things (IoT), fuels significant market growth. Government initiatives and investments in space exploration, particularly in countries like the U.S. and China, provide further impetus to this growth.
Challenges in the Satellite Payload Market Sector
Despite the promising growth prospects, the Satellite Payload Market faces several challenges. High launch costs remain a significant barrier, particularly for smaller companies. The increasing complexity of satellite technology and the stringent regulatory requirements associated with space operations necessitate substantial investment in research and development. Furthermore, intense competition among established players and the emergence of new entrants create pressure on profit margins. Supply chain disruptions can also affect production and delivery timelines, impacting market stability.
Emerging Opportunities in Satellite Payload Market
Emerging trends in the Satellite Payload Market offer significant opportunities. The increasing adoption of New Space technologies, including reusable launch vehicles, is driving down launch costs and creating access for new entrants. The growing demand for small satellites for Earth observation, telecommunications, and other applications opens up a large market segment. Advancements in AI and machine learning are improving the efficiency and functionality of satellite payloads. Further, the expanding demand for personalized satellite-based services and the rise of new satellite constellations create numerous opportunities for innovation and market expansion.
Leading Players in the Satellite Payload Market Market
Key Developments in Satellite Payload Market Industry
- January 2023: SpaceX successfully launched a Falcon 9 rocket carrying a large number of Starlink satellites, increasing its global coverage.
- June 2022: Airbus SE announced a new partnership to develop advanced Earth observation payloads.
- November 2021: Lockheed Martin secured a contract for the development of a new military communication payload.
- (Add further relevant developments with dates and brief descriptions)
Strategic Outlook for Satellite Payload Market Market
The Satellite Payload Market is poised for continued strong growth, driven by ongoing technological advancements, increasing demand for satellite-based services across multiple sectors, and substantial investments in space exploration. The market is expected to benefit from the emergence of new technologies such as miniaturization, improved sensor technologies, and AI-powered data analytics. Companies focusing on innovation, strategic partnerships, and efficient supply chain management are expected to thrive in this dynamic landscape. The integration of advanced technologies and a growing focus on sustainability will further shape the future trajectory of the Satellite Payload Market.
Satellite Payload Market Segmentation
- 1. Production Analysis
- 2. Consumption Analysis
- 3. Import Market Analysis (Value & Volume)
- 4. Export Market Analysis (Value & Volume)
- 5. Price Trend Analysis
Satellite Payload Market Segmentation By Geography
-
1. North America
- 1.1. United States
- 1.2. Canada
- 1.3. Mexico
-
2. South America
- 2.1. Brazil
- 2.2. Argentina
- 2.3. Rest of South America
-
3. Europe
- 3.1. United Kingdom
- 3.2. Germany
- 3.3. France
- 3.4. Italy
- 3.5. Spain
- 3.6. Russia
- 3.7. Benelux
- 3.8. Nordics
- 3.9. Rest of Europe
-
4. Middle East & Africa
- 4.1. Turkey
- 4.2. Israel
- 4.3. GCC
- 4.4. North Africa
- 4.5. South Africa
- 4.6. Rest of Middle East & Africa
-
5. Asia Pacific
- 5.1. China
- 5.2. India
- 5.3. Japan
- 5.4. South Korea
- 5.5. ASEAN
- 5.6. Oceania
- 5.7. Rest of Asia Pacific
Satellite Payload Market Regional Market Share
Geographic Coverage of Satellite Payload Market
Satellite Payload Market REPORT HIGHLIGHTS
| Aspects | Details |
|---|---|
| Study Period | 2020-2034 |
| Base Year | 2025 |
| Estimated Year | 2026 |
| Forecast Period | 2026-2034 |
| Historical Period | 2020-2025 |
| Growth Rate | CAGR of 8.54% from 2020-2034 |
| Segmentation |
|
Table of Contents
- 1. Introduction
- 1.1. Research Scope
- 1.2. Market Segmentation
- 1.3. Research Objective
- 1.4. Definitions and Assumptions
- 2. Executive Summary
- 2.1. Market Snapshot
- 3. Market Dynamics
- 3.1. Market Drivers
- 3.2. Market Restrains
- 3.3. Market Trends
- 3.4. Market Opportunities
- 4. Market Factor Analysis
- 4.1. Porters Five Forces
- 4.1.1. Bargaining Power of Suppliers
- 4.1.2. Bargaining Power of Buyers
- 4.1.3. Threat of New Entrants
- 4.1.4. Threat of Substitutes
- 4.1.5. Competitive Rivalry
- 4.2. PESTEL analysis
- 4.3. BCG Analysis
- 4.3.1. Stars (High Growth, High Market Share)
- 4.3.2. Cash Cows (Low Growth, High Market Share)
- 4.3.3. Question Mark (High Growth, Low Market Share)
- 4.3.4. Dogs (Low Growth, Low Market Share)
- 4.4. Ansoff Matrix Analysis
- 4.5. Supply Chain Analysis
- 4.6. Regulatory Landscape
- 4.7. Current Market Potential and Opportunity Assessment (TAM–SAM–SOM Framework)
- 4.8. RAX Analyst Note
- 4.1. Porters Five Forces
- 5. Market Analysis, Insights and Forecast 2021-2033
- 5.1. Market Analysis, Insights and Forecast - by Production Analysis
- 5.2. Market Analysis, Insights and Forecast - by Consumption Analysis
- 5.3. Market Analysis, Insights and Forecast - by Import Market Analysis (Value & Volume)
- 5.4. Market Analysis, Insights and Forecast - by Export Market Analysis (Value & Volume)
- 5.5. Market Analysis, Insights and Forecast - by Price Trend Analysis
- 5.6. Market Analysis, Insights and Forecast - by Region
- 5.6.1. North America
- 5.6.2. South America
- 5.6.3. Europe
- 5.6.4. Middle East & Africa
- 5.6.5. Asia Pacific
- 6. Global Satellite Payload Market Analysis, Insights and Forecast, 2021-2033
- 6.1. Market Analysis, Insights and Forecast - by Production Analysis
- 6.2. Market Analysis, Insights and Forecast - by Consumption Analysis
- 6.3. Market Analysis, Insights and Forecast - by Import Market Analysis (Value & Volume)
- 6.4. Market Analysis, Insights and Forecast - by Export Market Analysis (Value & Volume)
- 6.5. Market Analysis, Insights and Forecast - by Price Trend Analysis
- 7. North America Satellite Payload Market Analysis, Insights and Forecast, 2020-2032
- 7.1. Market Analysis, Insights and Forecast - by Production Analysis
- 7.2. Market Analysis, Insights and Forecast - by Consumption Analysis
- 7.3. Market Analysis, Insights and Forecast - by Import Market Analysis (Value & Volume)
- 7.4. Market Analysis, Insights and Forecast - by Export Market Analysis (Value & Volume)
- 7.5. Market Analysis, Insights and Forecast - by Price Trend Analysis
- 8. South America Satellite Payload Market Analysis, Insights and Forecast, 2020-2032
- 8.1. Market Analysis, Insights and Forecast - by Production Analysis
- 8.2. Market Analysis, Insights and Forecast - by Consumption Analysis
- 8.3. Market Analysis, Insights and Forecast - by Import Market Analysis (Value & Volume)
- 8.4. Market Analysis, Insights and Forecast - by Export Market Analysis (Value & Volume)
- 8.5. Market Analysis, Insights and Forecast - by Price Trend Analysis
- 9. Europe Satellite Payload Market Analysis, Insights and Forecast, 2020-2032
- 9.1. Market Analysis, Insights and Forecast - by Production Analysis
- 9.2. Market Analysis, Insights and Forecast - by Consumption Analysis
- 9.3. Market Analysis, Insights and Forecast - by Import Market Analysis (Value & Volume)
- 9.4. Market Analysis, Insights and Forecast - by Export Market Analysis (Value & Volume)
- 9.5. Market Analysis, Insights and Forecast - by Price Trend Analysis
- 10. Middle East & Africa Satellite Payload Market Analysis, Insights and Forecast, 2020-2032
- 10.1. Market Analysis, Insights and Forecast - by Production Analysis
- 10.2. Market Analysis, Insights and Forecast - by Consumption Analysis
- 10.3. Market Analysis, Insights and Forecast - by Import Market Analysis (Value & Volume)
- 10.4. Market Analysis, Insights and Forecast - by Export Market Analysis (Value & Volume)
- 10.5. Market Analysis, Insights and Forecast - by Price Trend Analysis
- 11. Asia Pacific Satellite Payload Market Analysis, Insights and Forecast, 2020-2032
- 11.1. Market Analysis, Insights and Forecast - by Production Analysis
- 11.2. Market Analysis, Insights and Forecast - by Consumption Analysis
- 11.3. Market Analysis, Insights and Forecast - by Import Market Analysis (Value & Volume)
- 11.4. Market Analysis, Insights and Forecast - by Export Market Analysis (Value & Volume)
- 11.5. Market Analysis, Insights and Forecast - by Price Trend Analysis
- 12. Competitive Analysis
- 12.1. Company Profiles
- 12.1.1 Sierra Nevada Corporatio
- 12.1.1.1. Company Overview
- 12.1.1.2. Products
- 12.1.1.3. Company Financials
- 12.1.1.4. SWOT Analysis
- 12.1.2 Space Exploration Technologies Corp
- 12.1.2.1. Company Overview
- 12.1.2.2. Products
- 12.1.2.3. Company Financials
- 12.1.2.4. SWOT Analysis
- 12.1.3 L3Harris Technologies Inc
- 12.1.3.1. Company Overview
- 12.1.3.2. Products
- 12.1.3.3. Company Financials
- 12.1.3.4. SWOT Analysis
- 12.1.4 Honeywell International Inc
- 12.1.4.1. Company Overview
- 12.1.4.2. Products
- 12.1.4.3. Company Financials
- 12.1.4.4. SWOT Analysis
- 12.1.5 THALES
- 12.1.5.1. Company Overview
- 12.1.5.2. Products
- 12.1.5.3. Company Financials
- 12.1.5.4. SWOT Analysis
- 12.1.6 General Dynamics Corporation
- 12.1.6.1. Company Overview
- 12.1.6.2. Products
- 12.1.6.3. Company Financials
- 12.1.6.4. SWOT Analysis
- 12.1.7 Lockheed Martin Corporation
- 12.1.7.1. Company Overview
- 12.1.7.2. Products
- 12.1.7.3. Company Financials
- 12.1.7.4. SWOT Analysis
- 12.1.8 Airbus SE
- 12.1.8.1. Company Overview
- 12.1.8.2. Products
- 12.1.8.3. Company Financials
- 12.1.8.4. SWOT Analysis
- 12.1.9 RTX Corporation
- 12.1.9.1. Company Overview
- 12.1.9.2. Products
- 12.1.9.3. Company Financials
- 12.1.9.4. SWOT Analysis
- 12.1.10 ISRO
- 12.1.10.1. Company Overview
- 12.1.10.2. Products
- 12.1.10.3. Company Financials
- 12.1.10.4. SWOT Analysis
- 12.1.11 Northrop Grumman Corporation
- 12.1.11.1. Company Overview
- 12.1.11.2. Products
- 12.1.11.3. Company Financials
- 12.1.11.4. SWOT Analysis
- 12.1.12 The Boeing Company
- 12.1.12.1. Company Overview
- 12.1.12.2. Products
- 12.1.12.3. Company Financials
- 12.1.12.4. SWOT Analysis
- 12.1.1 Sierra Nevada Corporatio
- 12.2. Market Entropy
- 12.2.1 Company's Key Areas Served
- 12.2.2 Recent Developments
- 12.3. Company Market Share Analysis 2025
- 12.3.1 Top 5 Companies Market Share Analysis
- 12.3.2 Top 3 Companies Market Share Analysis
- 12.4. List of Potential Customers
- 13. Research Methodology
List of Figures
- Figure 1: Global Satellite Payload Market Revenue Breakdown (Million, %) by Region 2025 & 2033
- Figure 2: North America Satellite Payload Market Revenue (Million), by Production Analysis 2025 & 2033
- Figure 3: North America Satellite Payload Market Revenue Share (%), by Production Analysis 2025 & 2033
- Figure 4: North America Satellite Payload Market Revenue (Million), by Consumption Analysis 2025 & 2033
- Figure 5: North America Satellite Payload Market Revenue Share (%), by Consumption Analysis 2025 & 2033
- Figure 6: North America Satellite Payload Market Revenue (Million), by Import Market Analysis (Value & Volume) 2025 & 2033
- Figure 7: North America Satellite Payload Market Revenue Share (%), by Import Market Analysis (Value & Volume) 2025 & 2033
- Figure 8: North America Satellite Payload Market Revenue (Million), by Export Market Analysis (Value & Volume) 2025 & 2033
- Figure 9: North America Satellite Payload Market Revenue Share (%), by Export Market Analysis (Value & Volume) 2025 & 2033
- Figure 10: North America Satellite Payload Market Revenue (Million), by Price Trend Analysis 2025 & 2033
- Figure 11: North America Satellite Payload Market Revenue Share (%), by Price Trend Analysis 2025 & 2033
- Figure 12: North America Satellite Payload Market Revenue (Million), by Country 2025 & 2033
- Figure 13: North America Satellite Payload Market Revenue Share (%), by Country 2025 & 2033
- Figure 14: South America Satellite Payload Market Revenue (Million), by Production Analysis 2025 & 2033
- Figure 15: South America Satellite Payload Market Revenue Share (%), by Production Analysis 2025 & 2033
- Figure 16: South America Satellite Payload Market Revenue (Million), by Consumption Analysis 2025 & 2033
- Figure 17: South America Satellite Payload Market Revenue Share (%), by Consumption Analysis 2025 & 2033
- Figure 18: South America Satellite Payload Market Revenue (Million), by Import Market Analysis (Value & Volume) 2025 & 2033
- Figure 19: South America Satellite Payload Market Revenue Share (%), by Import Market Analysis (Value & Volume) 2025 & 2033
- Figure 20: South America Satellite Payload Market Revenue (Million), by Export Market Analysis (Value & Volume) 2025 & 2033
- Figure 21: South America Satellite Payload Market Revenue Share (%), by Export Market Analysis (Value & Volume) 2025 & 2033
- Figure 22: South America Satellite Payload Market Revenue (Million), by Price Trend Analysis 2025 & 2033
- Figure 23: South America Satellite Payload Market Revenue Share (%), by Price Trend Analysis 2025 & 2033
- Figure 24: South America Satellite Payload Market Revenue (Million), by Country 2025 & 2033
- Figure 25: South America Satellite Payload Market Revenue Share (%), by Country 2025 & 2033
- Figure 26: Europe Satellite Payload Market Revenue (Million), by Production Analysis 2025 & 2033
- Figure 27: Europe Satellite Payload Market Revenue Share (%), by Production Analysis 2025 & 2033
- Figure 28: Europe Satellite Payload Market Revenue (Million), by Consumption Analysis 2025 & 2033
- Figure 29: Europe Satellite Payload Market Revenue Share (%), by Consumption Analysis 2025 & 2033
- Figure 30: Europe Satellite Payload Market Revenue (Million), by Import Market Analysis (Value & Volume) 2025 & 2033
- Figure 31: Europe Satellite Payload Market Revenue Share (%), by Import Market Analysis (Value & Volume) 2025 & 2033
- Figure 32: Europe Satellite Payload Market Revenue (Million), by Export Market Analysis (Value & Volume) 2025 & 2033
- Figure 33: Europe Satellite Payload Market Revenue Share (%), by Export Market Analysis (Value & Volume) 2025 & 2033
- Figure 34: Europe Satellite Payload Market Revenue (Million), by Price Trend Analysis 2025 & 2033
- Figure 35: Europe Satellite Payload Market Revenue Share (%), by Price Trend Analysis 2025 & 2033
- Figure 36: Europe Satellite Payload Market Revenue (Million), by Country 2025 & 2033
- Figure 37: Europe Satellite Payload Market Revenue Share (%), by Country 2025 & 2033
- Figure 38: Middle East & Africa Satellite Payload Market Revenue (Million), by Production Analysis 2025 & 2033
- Figure 39: Middle East & Africa Satellite Payload Market Revenue Share (%), by Production Analysis 2025 & 2033
- Figure 40: Middle East & Africa Satellite Payload Market Revenue (Million), by Consumption Analysis 2025 & 2033
- Figure 41: Middle East & Africa Satellite Payload Market Revenue Share (%), by Consumption Analysis 2025 & 2033
- Figure 42: Middle East & Africa Satellite Payload Market Revenue (Million), by Import Market Analysis (Value & Volume) 2025 & 2033
- Figure 43: Middle East & Africa Satellite Payload Market Revenue Share (%), by Import Market Analysis (Value & Volume) 2025 & 2033
- Figure 44: Middle East & Africa Satellite Payload Market Revenue (Million), by Export Market Analysis (Value & Volume) 2025 & 2033
- Figure 45: Middle East & Africa Satellite Payload Market Revenue Share (%), by Export Market Analysis (Value & Volume) 2025 & 2033
- Figure 46: Middle East & Africa Satellite Payload Market Revenue (Million), by Price Trend Analysis 2025 & 2033
- Figure 47: Middle East & Africa Satellite Payload Market Revenue Share (%), by Price Trend Analysis 2025 & 2033
- Figure 48: Middle East & Africa Satellite Payload Market Revenue (Million), by Country 2025 & 2033
- Figure 49: Middle East & Africa Satellite Payload Market Revenue Share (%), by Country 2025 & 2033
- Figure 50: Asia Pacific Satellite Payload Market Revenue (Million), by Production Analysis 2025 & 2033
- Figure 51: Asia Pacific Satellite Payload Market Revenue Share (%), by Production Analysis 2025 & 2033
- Figure 52: Asia Pacific Satellite Payload Market Revenue (Million), by Consumption Analysis 2025 & 2033
- Figure 53: Asia Pacific Satellite Payload Market Revenue Share (%), by Consumption Analysis 2025 & 2033
- Figure 54: Asia Pacific Satellite Payload Market Revenue (Million), by Import Market Analysis (Value & Volume) 2025 & 2033
- Figure 55: Asia Pacific Satellite Payload Market Revenue Share (%), by Import Market Analysis (Value & Volume) 2025 & 2033
- Figure 56: Asia Pacific Satellite Payload Market Revenue (Million), by Export Market Analysis (Value & Volume) 2025 & 2033
- Figure 57: Asia Pacific Satellite Payload Market Revenue Share (%), by Export Market Analysis (Value & Volume) 2025 & 2033
- Figure 58: Asia Pacific Satellite Payload Market Revenue (Million), by Price Trend Analysis 2025 & 2033
- Figure 59: Asia Pacific Satellite Payload Market Revenue Share (%), by Price Trend Analysis 2025 & 2033
- Figure 60: Asia Pacific Satellite Payload Market Revenue (Million), by Country 2025 & 2033
- Figure 61: Asia Pacific Satellite Payload Market Revenue Share (%), by Country 2025 & 2033
List of Tables
- Table 1: Global Satellite Payload Market Revenue Million Forecast, by Production Analysis 2020 & 2033
- Table 2: Global Satellite Payload Market Revenue Million Forecast, by Consumption Analysis 2020 & 2033
- Table 3: Global Satellite Payload Market Revenue Million Forecast, by Import Market Analysis (Value & Volume) 2020 & 2033
- Table 4: Global Satellite Payload Market Revenue Million Forecast, by Export Market Analysis (Value & Volume) 2020 & 2033
- Table 5: Global Satellite Payload Market Revenue Million Forecast, by Price Trend Analysis 2020 & 2033
- Table 6: Global Satellite Payload Market Revenue Million Forecast, by Region 2020 & 2033
- Table 7: Global Satellite Payload Market Revenue Million Forecast, by Production Analysis 2020 & 2033
- Table 8: Global Satellite Payload Market Revenue Million Forecast, by Consumption Analysis 2020 & 2033
- Table 9: Global Satellite Payload Market Revenue Million Forecast, by Import Market Analysis (Value & Volume) 2020 & 2033
- Table 10: Global Satellite Payload Market Revenue Million Forecast, by Export Market Analysis (Value & Volume) 2020 & 2033
- Table 11: Global Satellite Payload Market Revenue Million Forecast, by Price Trend Analysis 2020 & 2033
- Table 12: Global Satellite Payload Market Revenue Million Forecast, by Country 2020 & 2033
- Table 13: United States Satellite Payload Market Revenue (Million) Forecast, by Application 2020 & 2033
- Table 14: Canada Satellite Payload Market Revenue (Million) Forecast, by Application 2020 & 2033
- Table 15: Mexico Satellite Payload Market Revenue (Million) Forecast, by Application 2020 & 2033
- Table 16: Global Satellite Payload Market Revenue Million Forecast, by Production Analysis 2020 & 2033
- Table 17: Global Satellite Payload Market Revenue Million Forecast, by Consumption Analysis 2020 & 2033
- Table 18: Global Satellite Payload Market Revenue Million Forecast, by Import Market Analysis (Value & Volume) 2020 & 2033
- Table 19: Global Satellite Payload Market Revenue Million Forecast, by Export Market Analysis (Value & Volume) 2020 & 2033
- Table 20: Global Satellite Payload Market Revenue Million Forecast, by Price Trend Analysis 2020 & 2033
- Table 21: Global Satellite Payload Market Revenue Million Forecast, by Country 2020 & 2033
- Table 22: Brazil Satellite Payload Market Revenue (Million) Forecast, by Application 2020 & 2033
- Table 23: Argentina Satellite Payload Market Revenue (Million) Forecast, by Application 2020 & 2033
- Table 24: Rest of South America Satellite Payload Market Revenue (Million) Forecast, by Application 2020 & 2033
- Table 25: Global Satellite Payload Market Revenue Million Forecast, by Production Analysis 2020 & 2033
- Table 26: Global Satellite Payload Market Revenue Million Forecast, by Consumption Analysis 2020 & 2033
- Table 27: Global Satellite Payload Market Revenue Million Forecast, by Import Market Analysis (Value & Volume) 2020 & 2033
- Table 28: Global Satellite Payload Market Revenue Million Forecast, by Export Market Analysis (Value & Volume) 2020 & 2033
- Table 29: Global Satellite Payload Market Revenue Million Forecast, by Price Trend Analysis 2020 & 2033
- Table 30: Global Satellite Payload Market Revenue Million Forecast, by Country 2020 & 2033
- Table 31: United Kingdom Satellite Payload Market Revenue (Million) Forecast, by Application 2020 & 2033
- Table 32: Germany Satellite Payload Market Revenue (Million) Forecast, by Application 2020 & 2033
- Table 33: France Satellite Payload Market Revenue (Million) Forecast, by Application 2020 & 2033
- Table 34: Italy Satellite Payload Market Revenue (Million) Forecast, by Application 2020 & 2033
- Table 35: Spain Satellite Payload Market Revenue (Million) Forecast, by Application 2020 & 2033
- Table 36: Russia Satellite Payload Market Revenue (Million) Forecast, by Application 2020 & 2033
- Table 37: Benelux Satellite Payload Market Revenue (Million) Forecast, by Application 2020 & 2033
- Table 38: Nordics Satellite Payload Market Revenue (Million) Forecast, by Application 2020 & 2033
- Table 39: Rest of Europe Satellite Payload Market Revenue (Million) Forecast, by Application 2020 & 2033
- Table 40: Global Satellite Payload Market Revenue Million Forecast, by Production Analysis 2020 & 2033
- Table 41: Global Satellite Payload Market Revenue Million Forecast, by Consumption Analysis 2020 & 2033
- Table 42: Global Satellite Payload Market Revenue Million Forecast, by Import Market Analysis (Value & Volume) 2020 & 2033
- Table 43: Global Satellite Payload Market Revenue Million Forecast, by Export Market Analysis (Value & Volume) 2020 & 2033
- Table 44: Global Satellite Payload Market Revenue Million Forecast, by Price Trend Analysis 2020 & 2033
- Table 45: Global Satellite Payload Market Revenue Million Forecast, by Country 2020 & 2033
- Table 46: Turkey Satellite Payload Market Revenue (Million) Forecast, by Application 2020 & 2033
- Table 47: Israel Satellite Payload Market Revenue (Million) Forecast, by Application 2020 & 2033
- Table 48: GCC Satellite Payload Market Revenue (Million) Forecast, by Application 2020 & 2033
- Table 49: North Africa Satellite Payload Market Revenue (Million) Forecast, by Application 2020 & 2033
- Table 50: South Africa Satellite Payload Market Revenue (Million) Forecast, by Application 2020 & 2033
- Table 51: Rest of Middle East & Africa Satellite Payload Market Revenue (Million) Forecast, by Application 2020 & 2033
- Table 52: Global Satellite Payload Market Revenue Million Forecast, by Production Analysis 2020 & 2033
- Table 53: Global Satellite Payload Market Revenue Million Forecast, by Consumption Analysis 2020 & 2033
- Table 54: Global Satellite Payload Market Revenue Million Forecast, by Import Market Analysis (Value & Volume) 2020 & 2033
- Table 55: Global Satellite Payload Market Revenue Million Forecast, by Export Market Analysis (Value & Volume) 2020 & 2033
- Table 56: Global Satellite Payload Market Revenue Million Forecast, by Price Trend Analysis 2020 & 2033
- Table 57: Global Satellite Payload Market Revenue Million Forecast, by Country 2020 & 2033
- Table 58: China Satellite Payload Market Revenue (Million) Forecast, by Application 2020 & 2033
- Table 59: India Satellite Payload Market Revenue (Million) Forecast, by Application 2020 & 2033
- Table 60: Japan Satellite Payload Market Revenue (Million) Forecast, by Application 2020 & 2033
- Table 61: South Korea Satellite Payload Market Revenue (Million) Forecast, by Application 2020 & 2033
- Table 62: ASEAN Satellite Payload Market Revenue (Million) Forecast, by Application 2020 & 2033
- Table 63: Oceania Satellite Payload Market Revenue (Million) Forecast, by Application 2020 & 2033
- Table 64: Rest of Asia Pacific Satellite Payload Market Revenue (Million) Forecast, by Application 2020 & 2033
Frequently Asked Questions
1. What is the projected Compound Annual Growth Rate (CAGR) of the Satellite Payload Market?
The projected CAGR is approximately 8.54%.
2. Which companies are prominent players in the Satellite Payload Market?
Key companies in the market include Sierra Nevada Corporatio, Space Exploration Technologies Corp, L3Harris Technologies Inc, Honeywell International Inc, THALES, General Dynamics Corporation, Lockheed Martin Corporation, Airbus SE, RTX Corporation, ISRO, Northrop Grumman Corporation, The Boeing Company.
3. What are the main segments of the Satellite Payload Market?
The market segments include Production Analysis, Consumption Analysis, Import Market Analysis (Value & Volume), Export Market Analysis (Value & Volume), Price Trend Analysis.
4. Can you provide details about the market size?
The market size is estimated to be USD 16.27 Million as of 2022.
5. What are some drivers contributing to market growth?
; Increasing Number Of Air Passengers; Use Of Portable Electronic Devices.
6. What are the notable trends driving market growth?
Commercial Segment is Expected to Show Significant Growth During the Forecast Period.
7. Are there any restraints impacting market growth?
; High Cost Of Connectivity Equipments.
8. Can you provide examples of recent developments in the market?
N/A
9. What pricing options are available for accessing the report?
Pricing options include single-user, multi-user, and enterprise licenses priced at USD 4750, USD 5250, and USD 8750 respectively.
10. Is the market size provided in terms of value or volume?
The market size is provided in terms of value, measured in Million.
11. Are there any specific market keywords associated with the report?
Yes, the market keyword associated with the report is "Satellite Payload Market," which aids in identifying and referencing the specific market segment covered.
12. How do I determine which pricing option suits my needs best?
The pricing options vary based on user requirements and access needs. Individual users may opt for single-user licenses, while businesses requiring broader access may choose multi-user or enterprise licenses for cost-effective access to the report.
13. Are there any additional resources or data provided in the Satellite Payload Market report?
While the report offers comprehensive insights, it's advisable to review the specific contents or supplementary materials provided to ascertain if additional resources or data are available.
14. How can I stay updated on further developments or reports in the Satellite Payload Market?
To stay informed about further developments, trends, and reports in the Satellite Payload Market, consider subscribing to industry newsletters, following relevant companies and organizations, or regularly checking reputable industry news sources and publications.
Methodology
Step 1 - Identification of Relevant Samples Size from Population Database


Step 2 - Approaches for Defining Global Market Size (Value, Volume* & Price*)

Note*: In applicable scenarios
Step 3 - Data Sources
Primary Research
- Web Analytics
- Survey Reports
- Research Institute
- Latest Research Reports
- Opinion Leaders
Secondary Research
- Annual Reports
- White Paper
- Latest Press Release
- Industry Association
- Paid Database
- Investor Presentations

Step 4 - Data Triangulation
Involves using different sources of information in order to increase the validity of a study
These sources are likely to be stakeholders in a program - participants, other researchers, program staff, other community members, and so on.
Then we put all data in single framework & apply various statistical tools to find out the dynamic on the market.
During the analysis stage, feedback from the stakeholder groups would be compared to determine areas of agreement as well as areas of divergence