

Key Insights
The satellite propulsion systems market is experiencing robust growth, driven by increasing demand for satellite launches and the rising adoption of electric propulsion systems. The market's compound annual growth rate (CAGR) of 11.90% from 2019 to 2033 signifies significant expansion, with the market size estimated to be substantial by 2033. Key drivers include the miniaturization of satellites, enabling larger constellations for applications like broadband internet and Earth observation. Furthermore, advancements in electric propulsion technology, offering higher efficiency and longer mission life, are significantly impacting market growth. While the high cost of development and launch remains a restraint, the increasing number of commercial space launches and government investments in space exploration are mitigating this challenge. The market is segmented by propulsion technology, with electric, gas-based, and liquid fuel systems competing for market share. Electric propulsion is expected to witness considerable growth due to its advantages in terms of cost-effectiveness and operational efficiency. Major players like SpaceX, Honeywell, Blue Origin, and others are actively involved in developing and supplying advanced propulsion systems, fostering competition and innovation within the sector. The market's regional distribution reflects the concentration of space agencies and private launch providers, with North America and Europe currently holding a significant share.
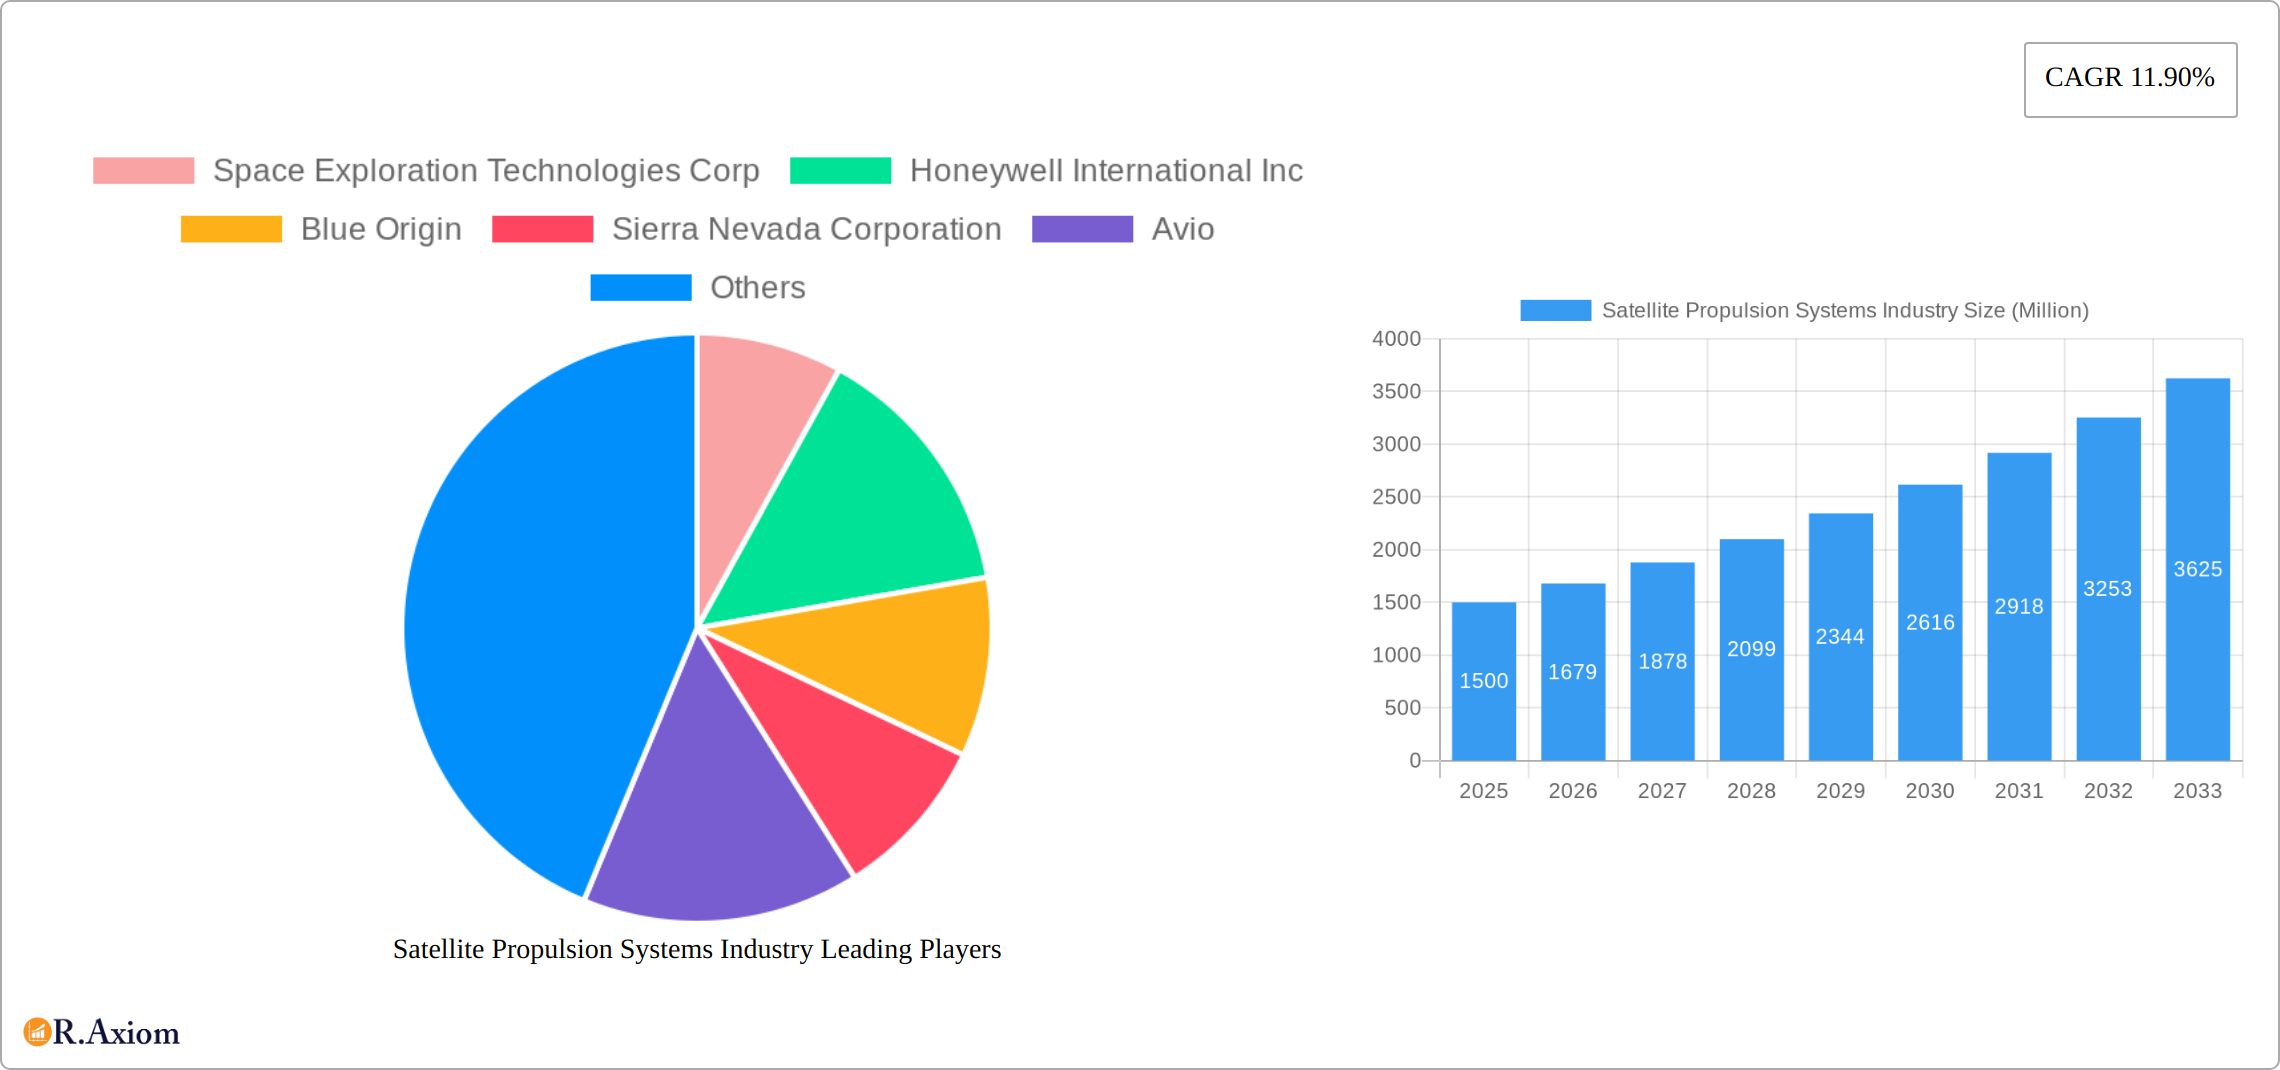
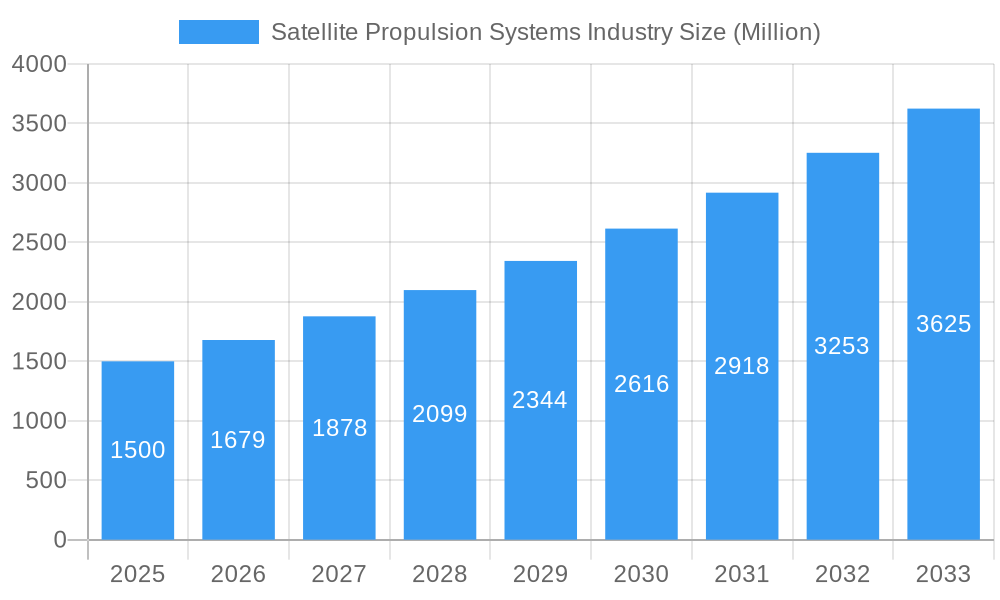
Satellite Propulsion Systems Industry Market Size (In Billion)
The forecast period (2025-2033) anticipates continued market expansion, driven by the ongoing trend of smallsat constellations and the growing demand for in-orbit servicing and debris removal missions. Technological advancements, such as the development of more efficient and reliable propulsion systems, along with the increasing availability of launch services, will further contribute to the market's growth. Competition among established players and emerging companies will likely intensify, leading to continuous innovation and price optimization. The long-term outlook for the satellite propulsion systems market remains positive, fueled by the escalating need for space-based infrastructure and the increasing commercialization of space. This necessitates the development and implementation of increasingly sophisticated and reliable propulsion technologies to meet the demands of various missions and applications.
Satellite Propulsion Systems Industry Company Market Share
This comprehensive report provides a detailed analysis of the global Satellite Propulsion Systems industry, offering invaluable insights for industry stakeholders, investors, and researchers. The study period spans from 2019 to 2033, with 2025 serving as the base and estimated year. The forecast period covers 2025-2033, while the historical period encompasses 2019-2024. The report delves into market size, segmentation, growth drivers, challenges, and key players, offering a 360-degree view of this dynamic sector. The report utilizes a data-driven approach and incorporates recent industry developments to provide accurate and actionable information. The total market size in 2025 is estimated at xx Million, projected to reach xx Million by 2033, exhibiting a CAGR of xx%.
Satellite Propulsion Systems Industry Market Concentration & Innovation
The satellite propulsion systems market exhibits a moderately concentrated landscape, dominated by several key players holding substantial market share. Space Exploration Technologies Corp (SpaceX), Honeywell International Inc, and Blue Origin are prominent leaders, collectively controlling an estimated xx% of the market. However, a dynamic competitive environment also includes significant contributions from companies such as Sierra Nevada Corporation, Avio, Moog Inc, Ariane Group, OHB SE, Sitael S.p.A, Thales, Northrop Grumman Corporation, and IHI Corporation, fostering innovation and competition.
Continuous innovation in propulsion technologies is a primary driver of market growth. This includes advancements in electric propulsion (ion thrusters, Hall-effect thrusters), gas-based systems, and liquid fuel propulsion, each designed to enhance efficiency and mission capabilities. Stringent regulatory frameworks governing environmental impact and safety are crucial considerations influencing technological advancements. The rise of reusable launch vehicles (RLVs) represents a pivotal innovation, significantly impacting cost-effectiveness and increasing launch frequency. While limited direct substitutes exist, advancements in alternative launch technologies could pose a long-term competitive threat. The burgeoning demand for diverse satellite-based services (communication, navigation, Earth observation) fuels market expansion.
Mergers and acquisitions (M&A) have played a significant role in shaping market concentration. Although precise financial details for all transactions aren't publicly available, substantial deals exceeding xx million USD in recent years have resulted in industry consolidation and enhanced technological integration. This consolidation trend is expected to continue.
- Key Metrics (Estimates): SpaceX market share: xx%; Honeywell market share: xx%; Blue Origin market share: xx%; Total M&A deal value (last 5 years): xx million USD.
Satellite Propulsion Systems Industry Industry Trends & Insights
The satellite propulsion systems market is experiencing robust growth, driven by the burgeoning demand for satellite-based services, particularly in communication, navigation, and Earth observation. The increasing adoption of small satellites and constellations is a significant trend driving demand. Technological advancements, such as the development of more efficient and reliable electric propulsion systems, are further fueling market expansion. The transition toward reusable launch vehicles is also a key trend, reducing launch costs and increasing access to space.
Consumer preferences are shifting toward more efficient, cost-effective, and environmentally friendly propulsion systems. Competitive dynamics are intense, with companies focused on enhancing technological capabilities, expanding product portfolios, and forging strategic partnerships to secure market share.
- Key Metrics: Market growth is projected at a CAGR of xx% between 2025 and 2033. Market penetration of electric propulsion systems is expected to reach xx% by 2033.
Dominant Markets & Segments in Satellite Propulsion Systems Industry
The North American region, particularly the United States, currently dominates the satellite propulsion systems market. This dominance is attributed to the robust space industry infrastructure, significant government investments in space exploration and research, and the presence of several leading companies. Europe and Asia also hold substantial market shares, with growing space programs and increasing investment driving local market expansion.
Within propulsion technologies, the liquid fuel segment currently holds the largest market share. However, the electric propulsion segment is witnessing the fastest growth rate, driven by its high fuel efficiency and suitability for various mission profiles. The gas-based segment holds a niche market share, primarily catering to specific applications.
- Key Drivers for North American Dominance:
- Substantial government funding for space exploration and research
- Presence of major aerospace companies
- Strong private sector investment
- Well-established infrastructure
Satellite Propulsion Systems Industry Product Developments
Recent product development focuses on enhancing the efficiency, reliability, and affordability of satellite propulsion systems. Key innovations include advanced electric propulsion systems (ion and Hall-effect thrusters), and improvements to liquid and solid propellant systems aimed at increasing thrust while reducing weight. These advancements directly address the increasing demand for smaller, more agile satellites capable of extended mission durations. Competitive advantages are increasingly determined by superior technological capabilities, cost-effectiveness, system reliability, and strategic partnerships with satellite manufacturers and launch service providers.
Report Scope & Segmentation Analysis
The report segments the market by propulsion technology: Electric, Gas-based, and Liquid Fuel.
Electric Propulsion: This segment is characterized by high efficiency and long operational lifespan, driving its strong growth projection. Market size is expected to reach xx Million by 2033. Competitive dynamics are shaped by innovation in thruster technologies and power systems.
Gas-based Propulsion: This segment caters to specific mission requirements and holds a niche market share. Market growth is projected at a moderate rate, with ongoing efforts to improve efficiency and reduce cost.
Liquid Fuel Propulsion: This remains the dominant segment due to its higher thrust capability. The market size is estimated at xx Million in 2025 and is expected to reach xx Million by 2033, showing a steady growth trajectory. Competition is high among established players.
Key Drivers of Satellite Propulsion Systems Industry Growth
Several factors drive the growth of the satellite propulsion systems market. The increasing demand for satellite-based services is a primary driver, fueled by the expanding telecommunications, navigation, and Earth observation sectors. Technological advancements, such as the development of more efficient and reliable propulsion systems, also play a significant role. Government investments in space exploration and research initiatives further contribute to market growth. Additionally, the emergence of new space companies and increased private sector investment are fostering innovation and market expansion.
Challenges in the Satellite Propulsion Systems Industry Sector
The satellite propulsion systems industry faces several challenges. Stringent regulatory compliance requirements and environmental concerns impact production and operation costs. Supply chain disruptions and resource availability can limit production and lead to cost increases. Intense competition among established players and emerging companies puts pressure on profit margins. Furthermore, the high cost of research and development, coupled with the long development cycles for new propulsion technologies, represents a significant obstacle.
Emerging Opportunities in Satellite Propulsion Systems Industry
Several emerging opportunities exist within the satellite propulsion systems market. The growing demand for small satellite constellations presents a significant opportunity for the development of miniaturized and highly efficient propulsion systems. The increasing interest in space exploration and deep-space missions is driving demand for advanced propulsion technologies capable of long-duration space travel. The development of sustainable and environmentally friendly propulsion systems represents another significant opportunity.
Leading Players in the Satellite Propulsion Systems Industry Market
Key Developments in Satellite Propulsion Systems Industry Industry
- February 2023: Thales Alenia Space contracted with the Korea Aerospace Research Institute (KARI) to provide integrated electric propulsion for the GEO-KOMPSAT-3 (GK3) satellite. This highlights the growing adoption of electric propulsion technology.
- February 2023: NASA's Launch Services Program (LSP) awarded Blue Origin the Escape and Plasma Acceleration and Dynamics Explorers (ESCAPADE) contract, utilizing New Glenn technology. This showcases the increasing reliance on reusable launch vehicles.
- December 2023: NASA awarded Blue Origin a NASA Launch Services II Indefinite Delivery Indefinite Quantity (IDIQ) contract to launch various satellites aboard New Glenn, further solidifying Blue Origin's position in the market and demonstrating the growing demand for launch services.
Strategic Outlook for Satellite Propulsion Systems Industry Market
The satellite propulsion systems market is poised for continued growth, driven by the expanding satellite industry, technological innovation, and increased government and private investment. The focus on miniaturization, increased efficiency, and sustainability will shape future market trends. Opportunities exist in developing advanced propulsion systems for deep-space exploration and the expansion of small satellite constellations. The market will likely see further consolidation through M&A activity as companies strive to gain a competitive edge.
Satellite Propulsion Systems Industry Segmentation
-
1. Propulsion Tech
- 1.1. Electric
- 1.2. Gas based
- 1.3. Liquid Fuel
Satellite Propulsion Systems Industry Segmentation By Geography
-
1. North America
- 1.1. United States
- 1.2. Canada
- 1.3. Mexico
-
2. South America
- 2.1. Brazil
- 2.2. Argentina
- 2.3. Rest of South America
-
3. Europe
- 3.1. United Kingdom
- 3.2. Germany
- 3.3. France
- 3.4. Italy
- 3.5. Spain
- 3.6. Russia
- 3.7. Benelux
- 3.8. Nordics
- 3.9. Rest of Europe
-
4. Middle East & Africa
- 4.1. Turkey
- 4.2. Israel
- 4.3. GCC
- 4.4. North Africa
- 4.5. South Africa
- 4.6. Rest of Middle East & Africa
-
5. Asia Pacific
- 5.1. China
- 5.2. India
- 5.3. Japan
- 5.4. South Korea
- 5.5. ASEAN
- 5.6. Oceania
- 5.7. Rest of Asia Pacific
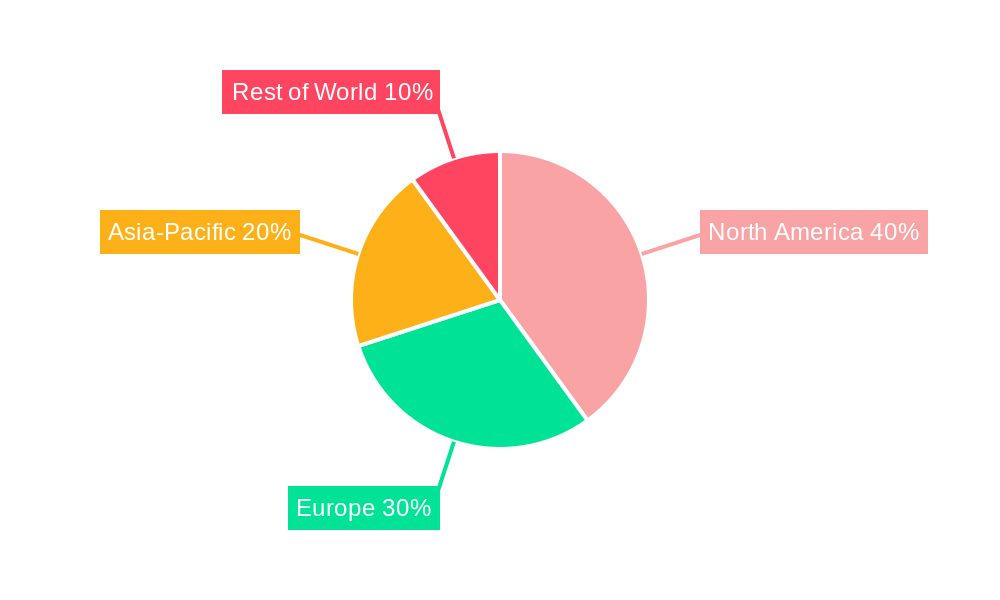
Satellite Propulsion Systems Industry Regional Market Share
Geographic Coverage of Satellite Propulsion Systems Industry
Satellite Propulsion Systems Industry REPORT HIGHLIGHTS
| Aspects | Details |
|---|---|
| Study Period | 2020-2034 |
| Base Year | 2025 |
| Estimated Year | 2026 |
| Forecast Period | 2026-2034 |
| Historical Period | 2020-2025 |
| Growth Rate | CAGR of 11.90% from 2020-2034 |
| Segmentation |
|
Table of Contents
- 1. Introduction
- 1.1. Research Scope
- 1.2. Market Segmentation
- 1.3. Research Objective
- 1.4. Definitions and Assumptions
- 2. Executive Summary
- 2.1. Market Snapshot
- 3. Market Dynamics
- 3.1. Market Drivers
- 3.2. Market Restrains
- 3.3. Market Trends
- 3.4. Market Opportunities
- 4. Market Factor Analysis
- 4.1. Porters Five Forces
- 4.1.1. Bargaining Power of Suppliers
- 4.1.2. Bargaining Power of Buyers
- 4.1.3. Threat of New Entrants
- 4.1.4. Threat of Substitutes
- 4.1.5. Competitive Rivalry
- 4.2. PESTEL analysis
- 4.3. BCG Analysis
- 4.3.1. Stars (High Growth, High Market Share)
- 4.3.2. Cash Cows (Low Growth, High Market Share)
- 4.3.3. Question Mark (High Growth, Low Market Share)
- 4.3.4. Dogs (Low Growth, Low Market Share)
- 4.4. Ansoff Matrix Analysis
- 4.5. Supply Chain Analysis
- 4.6. Regulatory Landscape
- 4.7. Current Market Potential and Opportunity Assessment (TAM–SAM–SOM Framework)
- 4.8. RAX Analyst Note
- 4.1. Porters Five Forces
- 5. Market Analysis, Insights and Forecast 2021-2033
- 5.1. Market Analysis, Insights and Forecast - by Propulsion Tech
- 5.1.1. Electric
- 5.1.2. Gas based
- 5.1.3. Liquid Fuel
- 5.2. Market Analysis, Insights and Forecast - by Region
- 5.2.1. North America
- 5.2.2. South America
- 5.2.3. Europe
- 5.2.4. Middle East & Africa
- 5.2.5. Asia Pacific
- 5.1. Market Analysis, Insights and Forecast - by Propulsion Tech
- 6. Global Satellite Propulsion Systems Industry Analysis, Insights and Forecast, 2021-2033
- 6.1. Market Analysis, Insights and Forecast - by Propulsion Tech
- 6.1.1. Electric
- 6.1.2. Gas based
- 6.1.3. Liquid Fuel
- 6.1. Market Analysis, Insights and Forecast - by Propulsion Tech
- 7. North America Satellite Propulsion Systems Industry Analysis, Insights and Forecast, 2020-2032
- 7.1. Market Analysis, Insights and Forecast - by Propulsion Tech
- 7.1.1. Electric
- 7.1.2. Gas based
- 7.1.3. Liquid Fuel
- 7.1. Market Analysis, Insights and Forecast - by Propulsion Tech
- 8. South America Satellite Propulsion Systems Industry Analysis, Insights and Forecast, 2020-2032
- 8.1. Market Analysis, Insights and Forecast - by Propulsion Tech
- 8.1.1. Electric
- 8.1.2. Gas based
- 8.1.3. Liquid Fuel
- 8.1. Market Analysis, Insights and Forecast - by Propulsion Tech
- 9. Europe Satellite Propulsion Systems Industry Analysis, Insights and Forecast, 2020-2032
- 9.1. Market Analysis, Insights and Forecast - by Propulsion Tech
- 9.1.1. Electric
- 9.1.2. Gas based
- 9.1.3. Liquid Fuel
- 9.1. Market Analysis, Insights and Forecast - by Propulsion Tech
- 10. Middle East & Africa Satellite Propulsion Systems Industry Analysis, Insights and Forecast, 2020-2032
- 10.1. Market Analysis, Insights and Forecast - by Propulsion Tech
- 10.1.1. Electric
- 10.1.2. Gas based
- 10.1.3. Liquid Fuel
- 10.1. Market Analysis, Insights and Forecast - by Propulsion Tech
- 11. Asia Pacific Satellite Propulsion Systems Industry Analysis, Insights and Forecast, 2020-2032
- 11.1. Market Analysis, Insights and Forecast - by Propulsion Tech
- 11.1.1. Electric
- 11.1.2. Gas based
- 11.1.3. Liquid Fuel
- 11.1. Market Analysis, Insights and Forecast - by Propulsion Tech
- 12. Competitive Analysis
- 12.1. Company Profiles
- 12.1.1 Space Exploration Technologies Corp
- 12.1.1.1. Company Overview
- 12.1.1.2. Products
- 12.1.1.3. Company Financials
- 12.1.1.4. SWOT Analysis
- 12.1.2 Honeywell International Inc
- 12.1.2.1. Company Overview
- 12.1.2.2. Products
- 12.1.2.3. Company Financials
- 12.1.2.4. SWOT Analysis
- 12.1.3 Blue Origin
- 12.1.3.1. Company Overview
- 12.1.3.2. Products
- 12.1.3.3. Company Financials
- 12.1.3.4. SWOT Analysis
- 12.1.4 Sierra Nevada Corporation
- 12.1.4.1. Company Overview
- 12.1.4.2. Products
- 12.1.4.3. Company Financials
- 12.1.4.4. SWOT Analysis
- 12.1.5 Avio
- 12.1.5.1. Company Overview
- 12.1.5.2. Products
- 12.1.5.3. Company Financials
- 12.1.5.4. SWOT Analysis
- 12.1.6 Moog Inc
- 12.1.6.1. Company Overview
- 12.1.6.2. Products
- 12.1.6.3. Company Financials
- 12.1.6.4. SWOT Analysis
- 12.1.7 Ariane Group
- 12.1.7.1. Company Overview
- 12.1.7.2. Products
- 12.1.7.3. Company Financials
- 12.1.7.4. SWOT Analysis
- 12.1.8 OHB SE
- 12.1.8.1. Company Overview
- 12.1.8.2. Products
- 12.1.8.3. Company Financials
- 12.1.8.4. SWOT Analysis
- 12.1.9 Sitael S p A
- 12.1.9.1. Company Overview
- 12.1.9.2. Products
- 12.1.9.3. Company Financials
- 12.1.9.4. SWOT Analysis
- 12.1.10 Thale
- 12.1.10.1. Company Overview
- 12.1.10.2. Products
- 12.1.10.3. Company Financials
- 12.1.10.4. SWOT Analysis
- 12.1.11 Northrop Grumman Corporation
- 12.1.11.1. Company Overview
- 12.1.11.2. Products
- 12.1.11.3. Company Financials
- 12.1.11.4. SWOT Analysis
- 12.1.12 IHI Corporation
- 12.1.12.1. Company Overview
- 12.1.12.2. Products
- 12.1.12.3. Company Financials
- 12.1.12.4. SWOT Analysis
- 12.1.1 Space Exploration Technologies Corp
- 12.2. Market Entropy
- 12.2.1 Company's Key Areas Served
- 12.2.2 Recent Developments
- 12.3. Company Market Share Analysis 2025
- 12.3.1 Top 5 Companies Market Share Analysis
- 12.3.2 Top 3 Companies Market Share Analysis
- 12.4. List of Potential Customers
- 13. Research Methodology
List of Figures
- Figure 1: Global Satellite Propulsion Systems Industry Revenue Breakdown (Million, %) by Region 2025 & 2033
- Figure 2: North America Satellite Propulsion Systems Industry Revenue (Million), by Propulsion Tech 2025 & 2033
- Figure 3: North America Satellite Propulsion Systems Industry Revenue Share (%), by Propulsion Tech 2025 & 2033
- Figure 4: North America Satellite Propulsion Systems Industry Revenue (Million), by Country 2025 & 2033
- Figure 5: North America Satellite Propulsion Systems Industry Revenue Share (%), by Country 2025 & 2033
- Figure 6: South America Satellite Propulsion Systems Industry Revenue (Million), by Propulsion Tech 2025 & 2033
- Figure 7: South America Satellite Propulsion Systems Industry Revenue Share (%), by Propulsion Tech 2025 & 2033
- Figure 8: South America Satellite Propulsion Systems Industry Revenue (Million), by Country 2025 & 2033
- Figure 9: South America Satellite Propulsion Systems Industry Revenue Share (%), by Country 2025 & 2033
- Figure 10: Europe Satellite Propulsion Systems Industry Revenue (Million), by Propulsion Tech 2025 & 2033
- Figure 11: Europe Satellite Propulsion Systems Industry Revenue Share (%), by Propulsion Tech 2025 & 2033
- Figure 12: Europe Satellite Propulsion Systems Industry Revenue (Million), by Country 2025 & 2033
- Figure 13: Europe Satellite Propulsion Systems Industry Revenue Share (%), by Country 2025 & 2033
- Figure 14: Middle East & Africa Satellite Propulsion Systems Industry Revenue (Million), by Propulsion Tech 2025 & 2033
- Figure 15: Middle East & Africa Satellite Propulsion Systems Industry Revenue Share (%), by Propulsion Tech 2025 & 2033
- Figure 16: Middle East & Africa Satellite Propulsion Systems Industry Revenue (Million), by Country 2025 & 2033
- Figure 17: Middle East & Africa Satellite Propulsion Systems Industry Revenue Share (%), by Country 2025 & 2033
- Figure 18: Asia Pacific Satellite Propulsion Systems Industry Revenue (Million), by Propulsion Tech 2025 & 2033
- Figure 19: Asia Pacific Satellite Propulsion Systems Industry Revenue Share (%), by Propulsion Tech 2025 & 2033
- Figure 20: Asia Pacific Satellite Propulsion Systems Industry Revenue (Million), by Country 2025 & 2033
- Figure 21: Asia Pacific Satellite Propulsion Systems Industry Revenue Share (%), by Country 2025 & 2033
List of Tables
- Table 1: Global Satellite Propulsion Systems Industry Revenue Million Forecast, by Propulsion Tech 2020 & 2033
- Table 2: Global Satellite Propulsion Systems Industry Revenue Million Forecast, by Region 2020 & 2033
- Table 3: Global Satellite Propulsion Systems Industry Revenue Million Forecast, by Propulsion Tech 2020 & 2033
- Table 4: Global Satellite Propulsion Systems Industry Revenue Million Forecast, by Country 2020 & 2033
- Table 5: United States Satellite Propulsion Systems Industry Revenue (Million) Forecast, by Application 2020 & 2033
- Table 6: Canada Satellite Propulsion Systems Industry Revenue (Million) Forecast, by Application 2020 & 2033
- Table 7: Mexico Satellite Propulsion Systems Industry Revenue (Million) Forecast, by Application 2020 & 2033
- Table 8: Global Satellite Propulsion Systems Industry Revenue Million Forecast, by Propulsion Tech 2020 & 2033
- Table 9: Global Satellite Propulsion Systems Industry Revenue Million Forecast, by Country 2020 & 2033
- Table 10: Brazil Satellite Propulsion Systems Industry Revenue (Million) Forecast, by Application 2020 & 2033
- Table 11: Argentina Satellite Propulsion Systems Industry Revenue (Million) Forecast, by Application 2020 & 2033
- Table 12: Rest of South America Satellite Propulsion Systems Industry Revenue (Million) Forecast, by Application 2020 & 2033
- Table 13: Global Satellite Propulsion Systems Industry Revenue Million Forecast, by Propulsion Tech 2020 & 2033
- Table 14: Global Satellite Propulsion Systems Industry Revenue Million Forecast, by Country 2020 & 2033
- Table 15: United Kingdom Satellite Propulsion Systems Industry Revenue (Million) Forecast, by Application 2020 & 2033
- Table 16: Germany Satellite Propulsion Systems Industry Revenue (Million) Forecast, by Application 2020 & 2033
- Table 17: France Satellite Propulsion Systems Industry Revenue (Million) Forecast, by Application 2020 & 2033
- Table 18: Italy Satellite Propulsion Systems Industry Revenue (Million) Forecast, by Application 2020 & 2033
- Table 19: Spain Satellite Propulsion Systems Industry Revenue (Million) Forecast, by Application 2020 & 2033
- Table 20: Russia Satellite Propulsion Systems Industry Revenue (Million) Forecast, by Application 2020 & 2033
- Table 21: Benelux Satellite Propulsion Systems Industry Revenue (Million) Forecast, by Application 2020 & 2033
- Table 22: Nordics Satellite Propulsion Systems Industry Revenue (Million) Forecast, by Application 2020 & 2033
- Table 23: Rest of Europe Satellite Propulsion Systems Industry Revenue (Million) Forecast, by Application 2020 & 2033
- Table 24: Global Satellite Propulsion Systems Industry Revenue Million Forecast, by Propulsion Tech 2020 & 2033
- Table 25: Global Satellite Propulsion Systems Industry Revenue Million Forecast, by Country 2020 & 2033
- Table 26: Turkey Satellite Propulsion Systems Industry Revenue (Million) Forecast, by Application 2020 & 2033
- Table 27: Israel Satellite Propulsion Systems Industry Revenue (Million) Forecast, by Application 2020 & 2033
- Table 28: GCC Satellite Propulsion Systems Industry Revenue (Million) Forecast, by Application 2020 & 2033
- Table 29: North Africa Satellite Propulsion Systems Industry Revenue (Million) Forecast, by Application 2020 & 2033
- Table 30: South Africa Satellite Propulsion Systems Industry Revenue (Million) Forecast, by Application 2020 & 2033
- Table 31: Rest of Middle East & Africa Satellite Propulsion Systems Industry Revenue (Million) Forecast, by Application 2020 & 2033
- Table 32: Global Satellite Propulsion Systems Industry Revenue Million Forecast, by Propulsion Tech 2020 & 2033
- Table 33: Global Satellite Propulsion Systems Industry Revenue Million Forecast, by Country 2020 & 2033
- Table 34: China Satellite Propulsion Systems Industry Revenue (Million) Forecast, by Application 2020 & 2033
- Table 35: India Satellite Propulsion Systems Industry Revenue (Million) Forecast, by Application 2020 & 2033
- Table 36: Japan Satellite Propulsion Systems Industry Revenue (Million) Forecast, by Application 2020 & 2033
- Table 37: South Korea Satellite Propulsion Systems Industry Revenue (Million) Forecast, by Application 2020 & 2033
- Table 38: ASEAN Satellite Propulsion Systems Industry Revenue (Million) Forecast, by Application 2020 & 2033
- Table 39: Oceania Satellite Propulsion Systems Industry Revenue (Million) Forecast, by Application 2020 & 2033
- Table 40: Rest of Asia Pacific Satellite Propulsion Systems Industry Revenue (Million) Forecast, by Application 2020 & 2033
Frequently Asked Questions
1. What is the projected Compound Annual Growth Rate (CAGR) of the Satellite Propulsion Systems Industry?
The projected CAGR is approximately 11.90%.
2. Which companies are prominent players in the Satellite Propulsion Systems Industry?
Key companies in the market include Space Exploration Technologies Corp, Honeywell International Inc, Blue Origin, Sierra Nevada Corporation, Avio, Moog Inc, Ariane Group, OHB SE, Sitael S p A, Thale, Northrop Grumman Corporation, IHI Corporation.
3. What are the main segments of the Satellite Propulsion Systems Industry?
The market segments include Propulsion Tech.
4. Can you provide details about the market size?
The market size is estimated to be USD XX Million as of 2022.
5. What are some drivers contributing to market growth?
N/A
6. What are the notable trends driving market growth?
The growing interest of governments and private players in space exploration have fueled the expansion of this market.
7. Are there any restraints impacting market growth?
N/A
8. Can you provide examples of recent developments in the market?
December 2023: NASA awarded Blue Origin a NASA Launch Services II Indefinite Delivery Indefinite Quantity (IDIQ) contract to launch planetary, Earth observation, exploration, and scientific satellites for the agency aboard New Glenn, Blue Origin's orbital reusable launch vehicle.February 2023: NASA's Launch Services Program (LSP) awarded Blue Origin the Escape and Plasma Acceleration and Dynamics Explorers (ESCAPADE) contract. Under the contract Blue Origin will provide its New Glenn reusable technology for the mission.February 2023: Thales Alenia Space has contracted with the Korea Aerospace Research Institute (KARI) to provide the integrated electric propulsion on their GEO-KOMPSAT-3 (GK3) satellite.
9. What pricing options are available for accessing the report?
Pricing options include single-user, multi-user, and enterprise licenses priced at USD 3800, USD 4500, and USD 5800 respectively.
10. Is the market size provided in terms of value or volume?
The market size is provided in terms of value, measured in Million.
11. Are there any specific market keywords associated with the report?
Yes, the market keyword associated with the report is "Satellite Propulsion Systems Industry," which aids in identifying and referencing the specific market segment covered.
12. How do I determine which pricing option suits my needs best?
The pricing options vary based on user requirements and access needs. Individual users may opt for single-user licenses, while businesses requiring broader access may choose multi-user or enterprise licenses for cost-effective access to the report.
13. Are there any additional resources or data provided in the Satellite Propulsion Systems Industry report?
While the report offers comprehensive insights, it's advisable to review the specific contents or supplementary materials provided to ascertain if additional resources or data are available.
14. How can I stay updated on further developments or reports in the Satellite Propulsion Systems Industry?
To stay informed about further developments, trends, and reports in the Satellite Propulsion Systems Industry, consider subscribing to industry newsletters, following relevant companies and organizations, or regularly checking reputable industry news sources and publications.
Methodology
Step 1 - Identification of Relevant Samples Size from Population Database


Step 2 - Approaches for Defining Global Market Size (Value, Volume* & Price*)

Note*: In applicable scenarios
Step 3 - Data Sources
Primary Research
- Web Analytics
- Survey Reports
- Research Institute
- Latest Research Reports
- Opinion Leaders
Secondary Research
- Annual Reports
- White Paper
- Latest Press Release
- Industry Association
- Paid Database
- Investor Presentations

Step 4 - Data Triangulation
Involves using different sources of information in order to increase the validity of a study
These sources are likely to be stakeholders in a program - participants, other researchers, program staff, other community members, and so on.
Then we put all data in single framework & apply various statistical tools to find out the dynamic on the market.
During the analysis stage, feedback from the stakeholder groups would be compared to determine areas of agreement as well as areas of divergence