
Key Insights
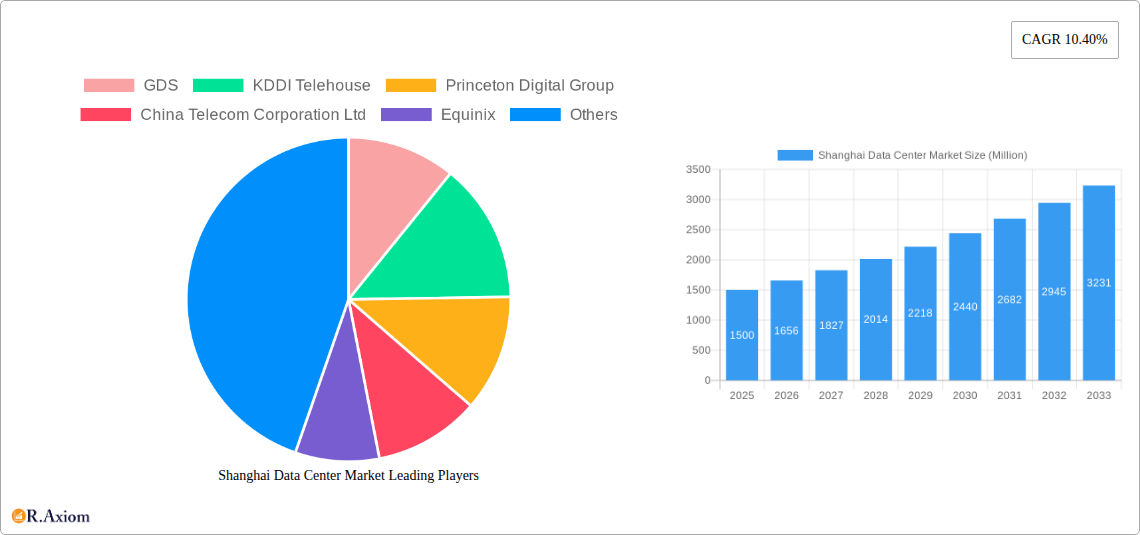
The Shanghai data center market, exhibiting a robust Compound Annual Growth Rate (CAGR) of 10.40%, presents a compelling investment opportunity. Driven by the burgeoning e-commerce sector, rapid digital transformation across industries like BFSI and manufacturing, and the increasing adoption of cloud computing and AI, the market is projected to experience significant expansion over the forecast period (2025-2033). The prevalence of hyperscale colocation facilities caters to the demands of large cloud providers and enterprises seeking scalable infrastructure. While retail colocation continues to play a significant role, the wholesale segment is gaining traction, driven by the need for customized solutions and long-term contracts. Growth is further fueled by government initiatives promoting digital infrastructure development and the city's strategic position as a global technology hub. However, challenges such as land scarcity and high energy costs could potentially restrain market growth. Segmentation by data center size (small, medium, large, massive, mega) reveals a growing preference for larger facilities offering greater capacity and efficiency. Tier 1 and Tier 2 data centers are expected to dominate the market, driven by their robust infrastructure and reliability. Key players like Equinix, NTT Ltd., and China Telecom Corporation Ltd. are strategically positioning themselves to capitalize on the market's potential, intensifying competition and fostering innovation.
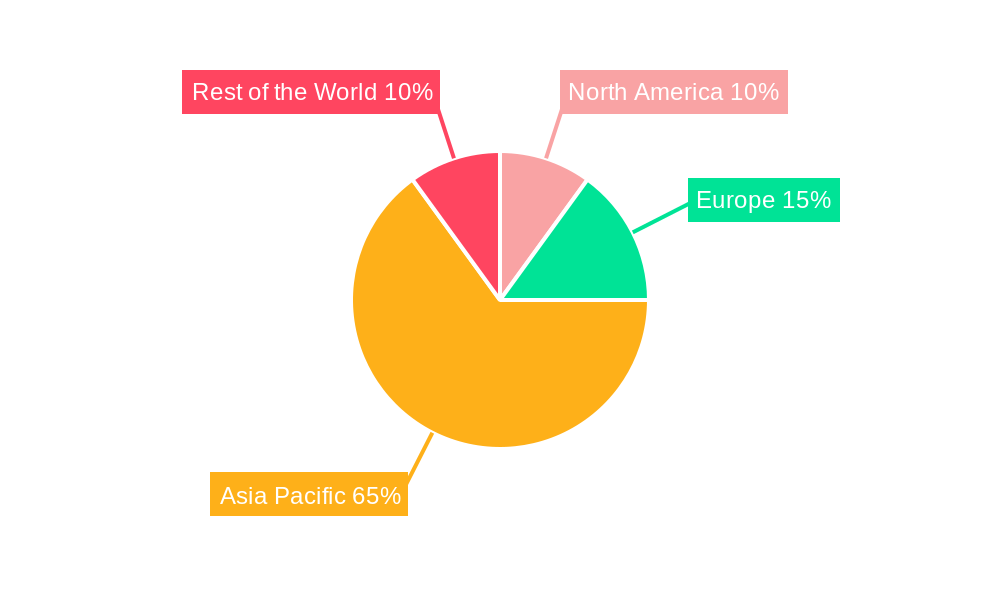
The competitive landscape is marked by a blend of global giants and local providers. While established international players leverage their expertise and global reach, local providers benefit from in-depth market knowledge and strong government relationships. This competition fosters innovation in service offerings, pricing strategies, and infrastructure development. The market’s geographical spread shows strong growth within the Asia-Pacific region, with Shanghai being a central hub. The historical period (2019-2024) likely witnessed a steady growth trajectory, setting the stage for the accelerated expansion projected for the forecast period. This expansion is likely to be fueled by continued investment in 5G infrastructure and the expansion of cloud services within the region. The increasing demand for edge computing and the need for low latency data processing are likely contributing factors to the rapid growth. Analyzing the historical data and considering the current market trends allow for a confident projection of the Shanghai data center market's continued upward trajectory.
Shanghai Data Center Market: A Comprehensive Report (2019-2033)
This comprehensive report provides an in-depth analysis of the Shanghai data center market, offering invaluable insights for stakeholders including investors, operators, vendors, and government agencies. Spanning the period from 2019 to 2033, with a base year of 2025 and a forecast period of 2025-2033, this report leverages rigorous research methodologies to deliver actionable intelligence on market size, segmentation, growth drivers, challenges, and future opportunities. The study meticulously analyzes various segments, including colocation types, end-user verticals, data center sizes, and tier classifications. Key market players like GDS, KDDI Telehouse, Princeton Digital Group, China Telecom Corporation Ltd, Equinix, Chayora Ltd, and NTT Ltd are profiled, providing a competitive landscape assessment.
Shanghai Data Center Market Concentration & Innovation
The Shanghai data center market exhibits a moderately concentrated landscape, with a few major players holding significant market share. GDS, Equinix, and China Telecom Corporation Ltd are key players, commanding a combined xx% of the market in 2025 (estimated). However, the market also shows signs of increasing competition, particularly from smaller, agile providers focusing on niche segments. Innovation is driven by the burgeoning demand for hyperscale facilities, advancements in cloud computing, and the growing adoption of edge computing technologies. Stringent regulatory frameworks governing data security and privacy influence market dynamics. The market experiences continuous product substitution, with newer technologies (e.g., liquid cooling) replacing older, less efficient solutions. End-user trends favor higher-tier facilities offering enhanced resilience and security. M&A activity remains significant, with deal values totaling an estimated xx Million in 2024, reflecting strategic consolidation and expansion within the sector.
- Market Share (Estimated 2025): GDS (xx%), Equinix (xx%), China Telecom Corporation Ltd (xx%), Others (xx%)
- M&A Deal Value (2024): xx Million
- Key Innovation Drivers: Hyperscale adoption, Cloud computing, Edge computing, Liquid cooling
Shanghai Data Center Market Industry Trends & Insights
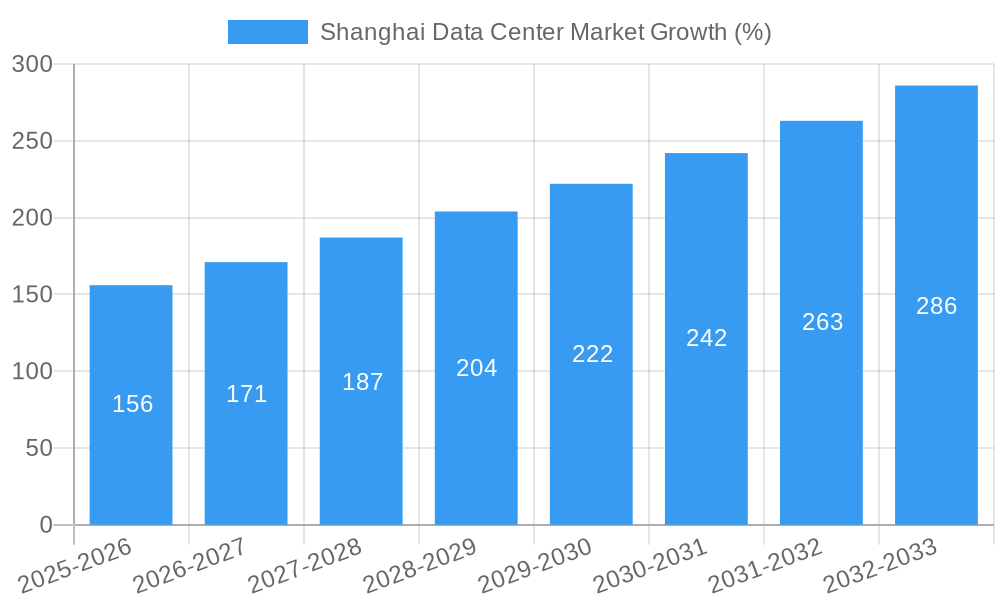
The Shanghai data center market is experiencing robust growth, driven by the rapid expansion of the digital economy, increasing cloud adoption rates, and government initiatives promoting digital transformation. The market is estimated to reach xx Million by 2033, exhibiting a Compound Annual Growth Rate (CAGR) of xx% during the forecast period. Technological disruptions, including the rise of AI and IoT, are fueling demand for higher capacity and more sophisticated data center infrastructure. Consumer preferences increasingly favor environmentally sustainable and energy-efficient solutions. Competitive dynamics are characterized by intense competition on pricing, service offerings, and innovation. Market penetration of hyperscale data centers is steadily increasing, driven by the needs of large cloud providers. The market is also witnessing a shift towards higher-tier facilities, reflecting the demand for enhanced reliability and security.
Dominant Markets & Segments in Shanghai Data Center Market
The Shanghai metropolitan area dominates the data center market within the region, driven by its robust infrastructure, skilled workforce, and proximity to major businesses. Within the segmentation, the Utilized Absorption segment leads significantly over Non-Utilized, reflecting the strong demand. The Hyperscale colocation type is experiencing the fastest growth due to increasing cloud adoption. The Cloud & IT end-user segment accounts for the largest market share, followed by the E-Commerce and BFSI sectors. Large and Mega data centers constitute the bulk of the market capacity, while Tier III and Tier IV facilities are becoming increasingly prevalent.
Key Drivers of Dominance:
- Robust Infrastructure
- Skilled Workforce
- Government Support
- Strong Economic Activity
- Proximity to Key Businesses
Dominant Segments:
- Absorption: Utilized
- Colocation Type: Hyperscale
- End-User: Cloud & IT
- DC Size: Large, Mega
- Tier Type: Tier III & IV
Shanghai Data Center Market Product Developments
Recent product innovations include advancements in cooling technologies (e.g., liquid cooling, free air cooling), modular data center designs, and enhanced security features. These developments address the growing need for energy efficiency, scalability, and improved security. The market also witnesses increased adoption of AI-powered data center management systems that optimize operations and reduce costs. These innovations improve market fit by providing customers with better performance, reduced operational costs, and enhanced security.
Report Scope & Segmentation Analysis
This report comprehensively segments the Shanghai data center market based on various parameters:
- Absorption: Utilized and Non-Utilized – Market size and growth projections are provided for each segment.
- Colocation Type: Retail, Wholesale, and Hyperscale – Competitive dynamics within each type are analyzed.
- End-User: Cloud & IT, Telecom, Media & Entertainment, Government, BFSI, Manufacturing, E-commerce, and Other – Market share and growth projections are given for each vertical.
- DC Size: Small, Medium, Large, Massive, and Mega – Capacity trends and growth projections for each size are included.
- Tier Type: Tier I, Tier II, Tier III, and Tier IV – Market penetration and competitive landscapes are analyzed for each tier.
Key Drivers of Shanghai Data Center Market Growth
The Shanghai data center market's growth is fueled by several factors: the rapid expansion of the digital economy, increasing cloud adoption across various industries, the government's strong support for digital infrastructure development, and the increasing demand for data storage and processing due to the rise of Big Data and IoT applications. The availability of skilled IT professionals in Shanghai further supports this growth.
Challenges in the Shanghai Data Center Market Sector
The Shanghai data center market faces challenges, including high land costs leading to increased infrastructure expenses, intense competition among providers resulting in price pressure, and regulatory complexities associated with data privacy and security. Power supply limitations and potential energy price fluctuations represent further concerns for operational costs.
Emerging Opportunities in Shanghai Data Center Market
The market presents opportunities related to the growing adoption of edge computing to reduce latency, the increasing demand for sustainable and energy-efficient data centers, and the potential for expansion into specialized segments like AI and blockchain technologies. Furthermore, the integration of advanced security features is an increasingly significant opportunity.
Leading Players in the Shanghai Data Center Market Market
- GDS
- KDDI Telehouse
- Princeton Digital Group
- China Telecom Corporation Ltd
- Equinix
- Chayora Ltd
- NTT Ltd
Key Developments in Shanghai Data Center Market Industry
- June 2023: GDS announces expansion of its Shanghai data center campus.
- October 2022: Equinix acquires a local data center provider, further expanding its footprint.
- March 2021: New regulations concerning data localization are introduced.
Strategic Outlook for Shanghai Data Center Market Market
The Shanghai data center market is poised for continued growth, driven by long-term trends in digital transformation and the expansion of cloud services. Opportunities exist for providers to focus on specialized solutions, sustainable practices, and strategic partnerships to capture market share in this dynamic environment. The market's future trajectory will be heavily influenced by government policies and technological advancements.
Shanghai Data Center Market Segmentation
-
1. DC Size
- 1.1. Small
- 1.2. Medium
- 1.3. Large
- 1.4. Massive
- 1.5. Mega
-
2. Tier Type
- 2.1. Tier 1 & 2
- 2.2. Tier 3
- 2.3. Tier 4
-
3. Absorption
-
3.1. Utilized
-
3.1.1. Colocation Type
- 3.1.1.1. Retail
- 3.1.1.2. Wholesale
- 3.1.1.3. Hyperscale
-
3.1.2. End User
- 3.1.2.1. Cloud & IT
- 3.1.2.2. Telecom
- 3.1.2.3. Media & Entertainment
- 3.1.2.4. Government
- 3.1.2.5. BFSI
- 3.1.2.6. Manufacturing
- 3.1.2.7. E-Commerce
- 3.1.2.8. Other End User
-
3.1.1. Colocation Type
- 3.2. Non-Utilized
-
3.1. Utilized
Shanghai Data Center Market Segmentation By Geography
-
1. North America
- 1.1. United States
- 1.2. Canada
- 1.3. Mexico
-
2. South America
- 2.1. Brazil
- 2.2. Argentina
- 2.3. Rest of South America
-
3. Europe
- 3.1. United Kingdom
- 3.2. Germany
- 3.3. France
- 3.4. Italy
- 3.5. Spain
- 3.6. Russia
- 3.7. Benelux
- 3.8. Nordics
- 3.9. Rest of Europe
-
4. Middle East & Africa
- 4.1. Turkey
- 4.2. Israel
- 4.3. GCC
- 4.4. North Africa
- 4.5. South Africa
- 4.6. Rest of Middle East & Africa
-
5. Asia Pacific
- 5.1. China
- 5.2. India
- 5.3. Japan
- 5.4. South Korea
- 5.5. ASEAN
- 5.6. Oceania
- 5.7. Rest of Asia Pacific
Shanghai Data Center Market REPORT HIGHLIGHTS
| Aspects | Details |
|---|---|
| Study Period | 2019-2033 |
| Base Year | 2024 |
| Estimated Year | 2025 |
| Forecast Period | 2025-2033 |
| Historical Period | 2019-2024 |
| Growth Rate | CAGR of 10.40% from 2019-2033 |
| Segmentation |
|
Table of Contents
- 1. Introduction
- 1.1. Research Scope
- 1.2. Market Segmentation
- 1.3. Research Methodology
- 1.4. Definitions and Assumptions
- 2. Executive Summary
- 2.1. Introduction
- 3. Market Dynamics
- 3.1. Introduction
- 3.2. Market Drivers
- 3.2.1. Continuous roll out of 5G; Growth of high-quality defensive companies; Demand for new digital services
- 3.3. Market Restrains
- 3.3.1. High Cost of Satellite Imaging Data Acquisition and Processing; High-resolution Images Offered by Other Imaging Technologies
- 3.4. Market Trends
- 3.4.1. Increasing cloud and colocation services are anticipated to drive the growth of data center market in the Shanghai.
- 4. Market Factor Analysis
- 4.1. Porters Five Forces
- 4.2. Supply/Value Chain
- 4.3. PESTEL analysis
- 4.4. Market Entropy
- 4.5. Patent/Trademark Analysis
- 5. Global Shanghai Data Center Market Analysis, Insights and Forecast, 2019-2031
- 5.1. Market Analysis, Insights and Forecast - by DC Size
- 5.1.1. Small
- 5.1.2. Medium
- 5.1.3. Large
- 5.1.4. Massive
- 5.1.5. Mega
- 5.2. Market Analysis, Insights and Forecast - by Tier Type
- 5.2.1. Tier 1 & 2
- 5.2.2. Tier 3
- 5.2.3. Tier 4
- 5.3. Market Analysis, Insights and Forecast - by Absorption
- 5.3.1. Utilized
- 5.3.1.1. Colocation Type
- 5.3.1.1.1. Retail
- 5.3.1.1.2. Wholesale
- 5.3.1.1.3. Hyperscale
- 5.3.1.2. End User
- 5.3.1.2.1. Cloud & IT
- 5.3.1.2.2. Telecom
- 5.3.1.2.3. Media & Entertainment
- 5.3.1.2.4. Government
- 5.3.1.2.5. BFSI
- 5.3.1.2.6. Manufacturing
- 5.3.1.2.7. E-Commerce
- 5.3.1.2.8. Other End User
- 5.3.1.1. Colocation Type
- 5.3.2. Non-Utilized
- 5.3.1. Utilized
- 5.4. Market Analysis, Insights and Forecast - by Region
- 5.4.1. North America
- 5.4.2. South America
- 5.4.3. Europe
- 5.4.4. Middle East & Africa
- 5.4.5. Asia Pacific
- 5.1. Market Analysis, Insights and Forecast - by DC Size
- 6. North America Shanghai Data Center Market Analysis, Insights and Forecast, 2019-2031
- 6.1. Market Analysis, Insights and Forecast - by DC Size
- 6.1.1. Small
- 6.1.2. Medium
- 6.1.3. Large
- 6.1.4. Massive
- 6.1.5. Mega
- 6.2. Market Analysis, Insights and Forecast - by Tier Type
- 6.2.1. Tier 1 & 2
- 6.2.2. Tier 3
- 6.2.3. Tier 4
- 6.3. Market Analysis, Insights and Forecast - by Absorption
- 6.3.1. Utilized
- 6.3.1.1. Colocation Type
- 6.3.1.1.1. Retail
- 6.3.1.1.2. Wholesale
- 6.3.1.1.3. Hyperscale
- 6.3.1.2. End User
- 6.3.1.2.1. Cloud & IT
- 6.3.1.2.2. Telecom
- 6.3.1.2.3. Media & Entertainment
- 6.3.1.2.4. Government
- 6.3.1.2.5. BFSI
- 6.3.1.2.6. Manufacturing
- 6.3.1.2.7. E-Commerce
- 6.3.1.2.8. Other End User
- 6.3.1.1. Colocation Type
- 6.3.2. Non-Utilized
- 6.3.1. Utilized
- 6.1. Market Analysis, Insights and Forecast - by DC Size
- 7. South America Shanghai Data Center Market Analysis, Insights and Forecast, 2019-2031
- 7.1. Market Analysis, Insights and Forecast - by DC Size
- 7.1.1. Small
- 7.1.2. Medium
- 7.1.3. Large
- 7.1.4. Massive
- 7.1.5. Mega
- 7.2. Market Analysis, Insights and Forecast - by Tier Type
- 7.2.1. Tier 1 & 2
- 7.2.2. Tier 3
- 7.2.3. Tier 4
- 7.3. Market Analysis, Insights and Forecast - by Absorption
- 7.3.1. Utilized
- 7.3.1.1. Colocation Type
- 7.3.1.1.1. Retail
- 7.3.1.1.2. Wholesale
- 7.3.1.1.3. Hyperscale
- 7.3.1.2. End User
- 7.3.1.2.1. Cloud & IT
- 7.3.1.2.2. Telecom
- 7.3.1.2.3. Media & Entertainment
- 7.3.1.2.4. Government
- 7.3.1.2.5. BFSI
- 7.3.1.2.6. Manufacturing
- 7.3.1.2.7. E-Commerce
- 7.3.1.2.8. Other End User
- 7.3.1.1. Colocation Type
- 7.3.2. Non-Utilized
- 7.3.1. Utilized
- 7.1. Market Analysis, Insights and Forecast - by DC Size
- 8. Europe Shanghai Data Center Market Analysis, Insights and Forecast, 2019-2031
- 8.1. Market Analysis, Insights and Forecast - by DC Size
- 8.1.1. Small
- 8.1.2. Medium
- 8.1.3. Large
- 8.1.4. Massive
- 8.1.5. Mega
- 8.2. Market Analysis, Insights and Forecast - by Tier Type
- 8.2.1. Tier 1 & 2
- 8.2.2. Tier 3
- 8.2.3. Tier 4
- 8.3. Market Analysis, Insights and Forecast - by Absorption
- 8.3.1. Utilized
- 8.3.1.1. Colocation Type
- 8.3.1.1.1. Retail
- 8.3.1.1.2. Wholesale
- 8.3.1.1.3. Hyperscale
- 8.3.1.2. End User
- 8.3.1.2.1. Cloud & IT
- 8.3.1.2.2. Telecom
- 8.3.1.2.3. Media & Entertainment
- 8.3.1.2.4. Government
- 8.3.1.2.5. BFSI
- 8.3.1.2.6. Manufacturing
- 8.3.1.2.7. E-Commerce
- 8.3.1.2.8. Other End User
- 8.3.1.1. Colocation Type
- 8.3.2. Non-Utilized
- 8.3.1. Utilized
- 8.1. Market Analysis, Insights and Forecast - by DC Size
- 9. Middle East & Africa Shanghai Data Center Market Analysis, Insights and Forecast, 2019-2031
- 9.1. Market Analysis, Insights and Forecast - by DC Size
- 9.1.1. Small
- 9.1.2. Medium
- 9.1.3. Large
- 9.1.4. Massive
- 9.1.5. Mega
- 9.2. Market Analysis, Insights and Forecast - by Tier Type
- 9.2.1. Tier 1 & 2
- 9.2.2. Tier 3
- 9.2.3. Tier 4
- 9.3. Market Analysis, Insights and Forecast - by Absorption
- 9.3.1. Utilized
- 9.3.1.1. Colocation Type
- 9.3.1.1.1. Retail
- 9.3.1.1.2. Wholesale
- 9.3.1.1.3. Hyperscale
- 9.3.1.2. End User
- 9.3.1.2.1. Cloud & IT
- 9.3.1.2.2. Telecom
- 9.3.1.2.3. Media & Entertainment
- 9.3.1.2.4. Government
- 9.3.1.2.5. BFSI
- 9.3.1.2.6. Manufacturing
- 9.3.1.2.7. E-Commerce
- 9.3.1.2.8. Other End User
- 9.3.1.1. Colocation Type
- 9.3.2. Non-Utilized
- 9.3.1. Utilized
- 9.1. Market Analysis, Insights and Forecast - by DC Size
- 10. Asia Pacific Shanghai Data Center Market Analysis, Insights and Forecast, 2019-2031
- 10.1. Market Analysis, Insights and Forecast - by DC Size
- 10.1.1. Small
- 10.1.2. Medium
- 10.1.3. Large
- 10.1.4. Massive
- 10.1.5. Mega
- 10.2. Market Analysis, Insights and Forecast - by Tier Type
- 10.2.1. Tier 1 & 2
- 10.2.2. Tier 3
- 10.2.3. Tier 4
- 10.3. Market Analysis, Insights and Forecast - by Absorption
- 10.3.1. Utilized
- 10.3.1.1. Colocation Type
- 10.3.1.1.1. Retail
- 10.3.1.1.2. Wholesale
- 10.3.1.1.3. Hyperscale
- 10.3.1.2. End User
- 10.3.1.2.1. Cloud & IT
- 10.3.1.2.2. Telecom
- 10.3.1.2.3. Media & Entertainment
- 10.3.1.2.4. Government
- 10.3.1.2.5. BFSI
- 10.3.1.2.6. Manufacturing
- 10.3.1.2.7. E-Commerce
- 10.3.1.2.8. Other End User
- 10.3.1.1. Colocation Type
- 10.3.2. Non-Utilized
- 10.3.1. Utilized
- 10.1. Market Analysis, Insights and Forecast - by DC Size
- 11. North America Shanghai Data Center Market Analysis, Insights and Forecast, 2019-2031
- 11.1. Market Analysis, Insights and Forecast - By Country/Sub-region
- 11.1.1.
- 12. Europe Shanghai Data Center Market Analysis, Insights and Forecast, 2019-2031
- 12.1. Market Analysis, Insights and Forecast - By Country/Sub-region
- 12.1.1.
- 13. Asia Pacific Shanghai Data Center Market Analysis, Insights and Forecast, 2019-2031
- 13.1. Market Analysis, Insights and Forecast - By Country/Sub-region
- 13.1.1.
- 14. Rest of the World Shanghai Data Center Market Analysis, Insights and Forecast, 2019-2031
- 14.1. Market Analysis, Insights and Forecast - By Country/Sub-region
- 14.1.1.
- 15. Competitive Analysis
- 15.1. Global Market Share Analysis 2024
- 15.2. Company Profiles
- 15.2.1 GDS
- 15.2.1.1. Overview
- 15.2.1.2. Products
- 15.2.1.3. SWOT Analysis
- 15.2.1.4. Recent Developments
- 15.2.1.5. Financials (Based on Availability)
- 15.2.2 KDDI Telehouse
- 15.2.2.1. Overview
- 15.2.2.2. Products
- 15.2.2.3. SWOT Analysis
- 15.2.2.4. Recent Developments
- 15.2.2.5. Financials (Based on Availability)
- 15.2.3 Princeton Digital Group
- 15.2.3.1. Overview
- 15.2.3.2. Products
- 15.2.3.3. SWOT Analysis
- 15.2.3.4. Recent Developments
- 15.2.3.5. Financials (Based on Availability)
- 15.2.4 China Telecom Corporation Ltd
- 15.2.4.1. Overview
- 15.2.4.2. Products
- 15.2.4.3. SWOT Analysis
- 15.2.4.4. Recent Developments
- 15.2.4.5. Financials (Based on Availability)
- 15.2.5 Equinix
- 15.2.5.1. Overview
- 15.2.5.2. Products
- 15.2.5.3. SWOT Analysis
- 15.2.5.4. Recent Developments
- 15.2.5.5. Financials (Based on Availability)
- 15.2.6 Chayora Lt
- 15.2.6.1. Overview
- 15.2.6.2. Products
- 15.2.6.3. SWOT Analysis
- 15.2.6.4. Recent Developments
- 15.2.6.5. Financials (Based on Availability)
- 15.2.7 NTT Ltd
- 15.2.7.1. Overview
- 15.2.7.2. Products
- 15.2.7.3. SWOT Analysis
- 15.2.7.4. Recent Developments
- 15.2.7.5. Financials (Based on Availability)
- 15.2.1 GDS
List of Figures
- Figure 1: Global Shanghai Data Center Market Revenue Breakdown (Million, %) by Region 2024 & 2032
- Figure 2: North America Shanghai Data Center Market Revenue (Million), by Country 2024 & 2032
- Figure 3: North America Shanghai Data Center Market Revenue Share (%), by Country 2024 & 2032
- Figure 4: Europe Shanghai Data Center Market Revenue (Million), by Country 2024 & 2032
- Figure 5: Europe Shanghai Data Center Market Revenue Share (%), by Country 2024 & 2032
- Figure 6: Asia Pacific Shanghai Data Center Market Revenue (Million), by Country 2024 & 2032
- Figure 7: Asia Pacific Shanghai Data Center Market Revenue Share (%), by Country 2024 & 2032
- Figure 8: Rest of the World Shanghai Data Center Market Revenue (Million), by Country 2024 & 2032
- Figure 9: Rest of the World Shanghai Data Center Market Revenue Share (%), by Country 2024 & 2032
- Figure 10: North America Shanghai Data Center Market Revenue (Million), by DC Size 2024 & 2032
- Figure 11: North America Shanghai Data Center Market Revenue Share (%), by DC Size 2024 & 2032
- Figure 12: North America Shanghai Data Center Market Revenue (Million), by Tier Type 2024 & 2032
- Figure 13: North America Shanghai Data Center Market Revenue Share (%), by Tier Type 2024 & 2032
- Figure 14: North America Shanghai Data Center Market Revenue (Million), by Absorption 2024 & 2032
- Figure 15: North America Shanghai Data Center Market Revenue Share (%), by Absorption 2024 & 2032
- Figure 16: North America Shanghai Data Center Market Revenue (Million), by Country 2024 & 2032
- Figure 17: North America Shanghai Data Center Market Revenue Share (%), by Country 2024 & 2032
- Figure 18: South America Shanghai Data Center Market Revenue (Million), by DC Size 2024 & 2032
- Figure 19: South America Shanghai Data Center Market Revenue Share (%), by DC Size 2024 & 2032
- Figure 20: South America Shanghai Data Center Market Revenue (Million), by Tier Type 2024 & 2032
- Figure 21: South America Shanghai Data Center Market Revenue Share (%), by Tier Type 2024 & 2032
- Figure 22: South America Shanghai Data Center Market Revenue (Million), by Absorption 2024 & 2032
- Figure 23: South America Shanghai Data Center Market Revenue Share (%), by Absorption 2024 & 2032
- Figure 24: South America Shanghai Data Center Market Revenue (Million), by Country 2024 & 2032
- Figure 25: South America Shanghai Data Center Market Revenue Share (%), by Country 2024 & 2032
- Figure 26: Europe Shanghai Data Center Market Revenue (Million), by DC Size 2024 & 2032
- Figure 27: Europe Shanghai Data Center Market Revenue Share (%), by DC Size 2024 & 2032
- Figure 28: Europe Shanghai Data Center Market Revenue (Million), by Tier Type 2024 & 2032
- Figure 29: Europe Shanghai Data Center Market Revenue Share (%), by Tier Type 2024 & 2032
- Figure 30: Europe Shanghai Data Center Market Revenue (Million), by Absorption 2024 & 2032
- Figure 31: Europe Shanghai Data Center Market Revenue Share (%), by Absorption 2024 & 2032
- Figure 32: Europe Shanghai Data Center Market Revenue (Million), by Country 2024 & 2032
- Figure 33: Europe Shanghai Data Center Market Revenue Share (%), by Country 2024 & 2032
- Figure 34: Middle East & Africa Shanghai Data Center Market Revenue (Million), by DC Size 2024 & 2032
- Figure 35: Middle East & Africa Shanghai Data Center Market Revenue Share (%), by DC Size 2024 & 2032
- Figure 36: Middle East & Africa Shanghai Data Center Market Revenue (Million), by Tier Type 2024 & 2032
- Figure 37: Middle East & Africa Shanghai Data Center Market Revenue Share (%), by Tier Type 2024 & 2032
- Figure 38: Middle East & Africa Shanghai Data Center Market Revenue (Million), by Absorption 2024 & 2032
- Figure 39: Middle East & Africa Shanghai Data Center Market Revenue Share (%), by Absorption 2024 & 2032
- Figure 40: Middle East & Africa Shanghai Data Center Market Revenue (Million), by Country 2024 & 2032
- Figure 41: Middle East & Africa Shanghai Data Center Market Revenue Share (%), by Country 2024 & 2032
- Figure 42: Asia Pacific Shanghai Data Center Market Revenue (Million), by DC Size 2024 & 2032
- Figure 43: Asia Pacific Shanghai Data Center Market Revenue Share (%), by DC Size 2024 & 2032
- Figure 44: Asia Pacific Shanghai Data Center Market Revenue (Million), by Tier Type 2024 & 2032
- Figure 45: Asia Pacific Shanghai Data Center Market Revenue Share (%), by Tier Type 2024 & 2032
- Figure 46: Asia Pacific Shanghai Data Center Market Revenue (Million), by Absorption 2024 & 2032
- Figure 47: Asia Pacific Shanghai Data Center Market Revenue Share (%), by Absorption 2024 & 2032
- Figure 48: Asia Pacific Shanghai Data Center Market Revenue (Million), by Country 2024 & 2032
- Figure 49: Asia Pacific Shanghai Data Center Market Revenue Share (%), by Country 2024 & 2032
List of Tables
- Table 1: Global Shanghai Data Center Market Revenue Million Forecast, by Region 2019 & 2032
- Table 2: Global Shanghai Data Center Market Revenue Million Forecast, by DC Size 2019 & 2032
- Table 3: Global Shanghai Data Center Market Revenue Million Forecast, by Tier Type 2019 & 2032
- Table 4: Global Shanghai Data Center Market Revenue Million Forecast, by Absorption 2019 & 2032
- Table 5: Global Shanghai Data Center Market Revenue Million Forecast, by Region 2019 & 2032
- Table 6: Global Shanghai Data Center Market Revenue Million Forecast, by Country 2019 & 2032
- Table 7: Shanghai Data Center Market Revenue (Million) Forecast, by Application 2019 & 2032
- Table 8: Global Shanghai Data Center Market Revenue Million Forecast, by Country 2019 & 2032
- Table 9: Shanghai Data Center Market Revenue (Million) Forecast, by Application 2019 & 2032
- Table 10: Global Shanghai Data Center Market Revenue Million Forecast, by Country 2019 & 2032
- Table 11: Shanghai Data Center Market Revenue (Million) Forecast, by Application 2019 & 2032
- Table 12: Global Shanghai Data Center Market Revenue Million Forecast, by Country 2019 & 2032
- Table 13: Shanghai Data Center Market Revenue (Million) Forecast, by Application 2019 & 2032
- Table 14: Global Shanghai Data Center Market Revenue Million Forecast, by DC Size 2019 & 2032
- Table 15: Global Shanghai Data Center Market Revenue Million Forecast, by Tier Type 2019 & 2032
- Table 16: Global Shanghai Data Center Market Revenue Million Forecast, by Absorption 2019 & 2032
- Table 17: Global Shanghai Data Center Market Revenue Million Forecast, by Country 2019 & 2032
- Table 18: United States Shanghai Data Center Market Revenue (Million) Forecast, by Application 2019 & 2032
- Table 19: Canada Shanghai Data Center Market Revenue (Million) Forecast, by Application 2019 & 2032
- Table 20: Mexico Shanghai Data Center Market Revenue (Million) Forecast, by Application 2019 & 2032
- Table 21: Global Shanghai Data Center Market Revenue Million Forecast, by DC Size 2019 & 2032
- Table 22: Global Shanghai Data Center Market Revenue Million Forecast, by Tier Type 2019 & 2032
- Table 23: Global Shanghai Data Center Market Revenue Million Forecast, by Absorption 2019 & 2032
- Table 24: Global Shanghai Data Center Market Revenue Million Forecast, by Country 2019 & 2032
- Table 25: Brazil Shanghai Data Center Market Revenue (Million) Forecast, by Application 2019 & 2032
- Table 26: Argentina Shanghai Data Center Market Revenue (Million) Forecast, by Application 2019 & 2032
- Table 27: Rest of South America Shanghai Data Center Market Revenue (Million) Forecast, by Application 2019 & 2032
- Table 28: Global Shanghai Data Center Market Revenue Million Forecast, by DC Size 2019 & 2032
- Table 29: Global Shanghai Data Center Market Revenue Million Forecast, by Tier Type 2019 & 2032
- Table 30: Global Shanghai Data Center Market Revenue Million Forecast, by Absorption 2019 & 2032
- Table 31: Global Shanghai Data Center Market Revenue Million Forecast, by Country 2019 & 2032
- Table 32: United Kingdom Shanghai Data Center Market Revenue (Million) Forecast, by Application 2019 & 2032
- Table 33: Germany Shanghai Data Center Market Revenue (Million) Forecast, by Application 2019 & 2032
- Table 34: France Shanghai Data Center Market Revenue (Million) Forecast, by Application 2019 & 2032
- Table 35: Italy Shanghai Data Center Market Revenue (Million) Forecast, by Application 2019 & 2032
- Table 36: Spain Shanghai Data Center Market Revenue (Million) Forecast, by Application 2019 & 2032
- Table 37: Russia Shanghai Data Center Market Revenue (Million) Forecast, by Application 2019 & 2032
- Table 38: Benelux Shanghai Data Center Market Revenue (Million) Forecast, by Application 2019 & 2032
- Table 39: Nordics Shanghai Data Center Market Revenue (Million) Forecast, by Application 2019 & 2032
- Table 40: Rest of Europe Shanghai Data Center Market Revenue (Million) Forecast, by Application 2019 & 2032
- Table 41: Global Shanghai Data Center Market Revenue Million Forecast, by DC Size 2019 & 2032
- Table 42: Global Shanghai Data Center Market Revenue Million Forecast, by Tier Type 2019 & 2032
- Table 43: Global Shanghai Data Center Market Revenue Million Forecast, by Absorption 2019 & 2032
- Table 44: Global Shanghai Data Center Market Revenue Million Forecast, by Country 2019 & 2032
- Table 45: Turkey Shanghai Data Center Market Revenue (Million) Forecast, by Application 2019 & 2032
- Table 46: Israel Shanghai Data Center Market Revenue (Million) Forecast, by Application 2019 & 2032
- Table 47: GCC Shanghai Data Center Market Revenue (Million) Forecast, by Application 2019 & 2032
- Table 48: North Africa Shanghai Data Center Market Revenue (Million) Forecast, by Application 2019 & 2032
- Table 49: South Africa Shanghai Data Center Market Revenue (Million) Forecast, by Application 2019 & 2032
- Table 50: Rest of Middle East & Africa Shanghai Data Center Market Revenue (Million) Forecast, by Application 2019 & 2032
- Table 51: Global Shanghai Data Center Market Revenue Million Forecast, by DC Size 2019 & 2032
- Table 52: Global Shanghai Data Center Market Revenue Million Forecast, by Tier Type 2019 & 2032
- Table 53: Global Shanghai Data Center Market Revenue Million Forecast, by Absorption 2019 & 2032
- Table 54: Global Shanghai Data Center Market Revenue Million Forecast, by Country 2019 & 2032
- Table 55: China Shanghai Data Center Market Revenue (Million) Forecast, by Application 2019 & 2032
- Table 56: India Shanghai Data Center Market Revenue (Million) Forecast, by Application 2019 & 2032
- Table 57: Japan Shanghai Data Center Market Revenue (Million) Forecast, by Application 2019 & 2032
- Table 58: South Korea Shanghai Data Center Market Revenue (Million) Forecast, by Application 2019 & 2032
- Table 59: ASEAN Shanghai Data Center Market Revenue (Million) Forecast, by Application 2019 & 2032
- Table 60: Oceania Shanghai Data Center Market Revenue (Million) Forecast, by Application 2019 & 2032
- Table 61: Rest of Asia Pacific Shanghai Data Center Market Revenue (Million) Forecast, by Application 2019 & 2032
Frequently Asked Questions
1. What is the projected Compound Annual Growth Rate (CAGR) of the Shanghai Data Center Market?
The projected CAGR is approximately 10.40%.
2. Which companies are prominent players in the Shanghai Data Center Market?
Key companies in the market include GDS, KDDI Telehouse, Princeton Digital Group, China Telecom Corporation Ltd, Equinix, Chayora Lt, NTT Ltd.
3. What are the main segments of the Shanghai Data Center Market?
The market segments include DC Size, Tier Type, Absorption.
4. Can you provide details about the market size?
The market size is estimated to be USD XX Million as of 2022.
5. What are some drivers contributing to market growth?
Continuous roll out of 5G; Growth of high-quality defensive companies; Demand for new digital services.
6. What are the notable trends driving market growth?
Increasing cloud and colocation services are anticipated to drive the growth of data center market in the Shanghai..
7. Are there any restraints impacting market growth?
High Cost of Satellite Imaging Data Acquisition and Processing; High-resolution Images Offered by Other Imaging Technologies.
8. Can you provide examples of recent developments in the market?
N/A
9. What pricing options are available for accessing the report?
Pricing options include single-user, multi-user, and enterprise licenses priced at USD 3800, USD 4500, and USD 5800 respectively.
10. Is the market size provided in terms of value or volume?
The market size is provided in terms of value, measured in Million.
11. Are there any specific market keywords associated with the report?
Yes, the market keyword associated with the report is "Shanghai Data Center Market," which aids in identifying and referencing the specific market segment covered.
12. How do I determine which pricing option suits my needs best?
The pricing options vary based on user requirements and access needs. Individual users may opt for single-user licenses, while businesses requiring broader access may choose multi-user or enterprise licenses for cost-effective access to the report.
13. Are there any additional resources or data provided in the Shanghai Data Center Market report?
While the report offers comprehensive insights, it's advisable to review the specific contents or supplementary materials provided to ascertain if additional resources or data are available.
14. How can I stay updated on further developments or reports in the Shanghai Data Center Market?
To stay informed about further developments, trends, and reports in the Shanghai Data Center Market, consider subscribing to industry newsletters, following relevant companies and organizations, or regularly checking reputable industry news sources and publications.
Methodology
Step 1 - Identification of Relevant Samples Size from Population Database


Step 2 - Approaches for Defining Global Market Size (Value, Volume* & Price*)

Note*: In applicable scenarios
Step 3 - Data Sources
Primary Research
- Web Analytics
- Survey Reports
- Research Institute
- Latest Research Reports
- Opinion Leaders
Secondary Research
- Annual Reports
- White Paper
- Latest Press Release
- Industry Association
- Paid Database
- Investor Presentations

Step 4 - Data Triangulation
Involves using different sources of information in order to increase the validity of a study
These sources are likely to be stakeholders in a program - participants, other researchers, program staff, other community members, and so on.
Then we put all data in single framework & apply various statistical tools to find out the dynamic on the market.
During the analysis stage, feedback from the stakeholder groups would be compared to determine areas of agreement as well as areas of divergence


