

Key Insights
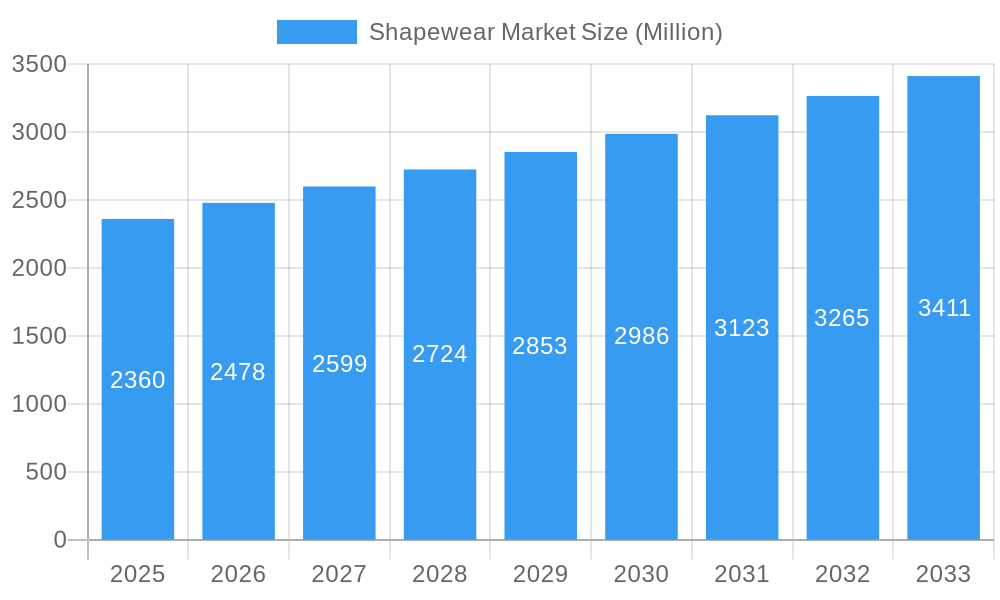
The global shapewear market, valued at $2.36 billion in 2025, is projected to experience robust growth, driven by several key factors. Increasing awareness of body positivity and the desire for comfortable yet figure-flattering apparel are fueling demand across various demographics. The rise of athleisure and bodycon fashion trends further contributes to the market's expansion, as shapewear provides a seamless base layer for these styles. Technological advancements in fabric manufacturing are leading to the development of more comfortable, breathable, and durable shapewear options, enhancing consumer experience and satisfaction. E-commerce platforms play a crucial role in market penetration, offering wider product selection and convenience to consumers. While pricing remains a potential restraint for some consumers, the increasing availability of affordable options and promotional offers is mitigating this factor. Furthermore, the market is witnessing diversification in product offerings, including innovative designs catering to different body types and specific needs, boosting market growth.
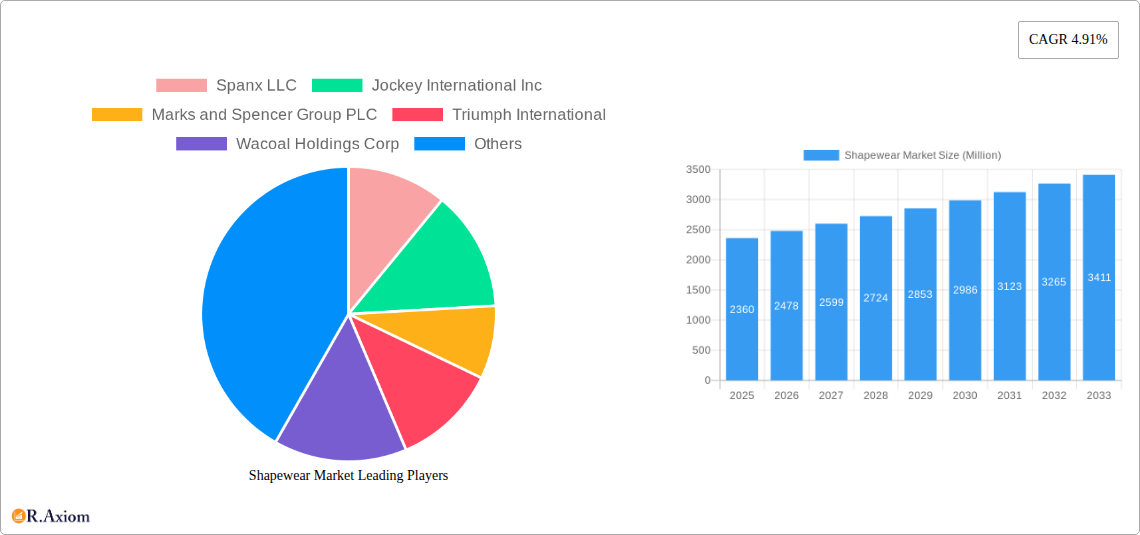
Shapewear Market Market Size (In Billion)
The market's Compound Annual Growth Rate (CAGR) of 4.91% from 2019 to 2025 suggests a consistent upward trajectory. This growth is expected to continue throughout the forecast period (2025-2033), although the pace might fluctuate slightly due to macroeconomic factors and changing consumer preferences. Key players like Spanx, Jockey International, and Triumph International are expected to remain dominant, leveraging their established brands and distribution networks. However, the market is also witnessing the emergence of smaller, specialized brands that focus on niche segments, such as sustainable or inclusive shapewear. These innovative brands are leveraging digital marketing strategies to capture market share and cater to specific customer needs. Geographic expansion into emerging markets with growing middle classes is expected to further drive market growth in the coming years.
Shapewear Market Company Market Share
Shapewear Market: A Comprehensive Report (2019-2033)
This in-depth report provides a comprehensive analysis of the global shapewear market, offering invaluable insights for industry stakeholders, investors, and market entrants. The study period covers 2019-2033, with a base year of 2025 and a forecast period of 2025-2033. The report leverages extensive market research and data analysis to deliver actionable intelligence, focusing on market size (in Millions), growth drivers, emerging trends, and competitive dynamics.
Shapewear Market Concentration & Innovation
The shapewear market exhibits a moderately concentrated landscape, with key players like Spanx LLC, Jockey International Inc., and Triumph International holding significant market share. However, the emergence of innovative brands and direct-to-consumer models is fostering increased competition. Market share data for 2024 estimates Spanx LLC at approximately 15%, Jockey International Inc. at 10%, and Triumph International at 8%, with the remaining share distributed among numerous players. The market's innovation is driven by factors such as technological advancements in fabric technology (e.g., breathable, seamless materials), body-positive marketing campaigns, and the incorporation of smart technologies. Regulatory frameworks concerning labeling and material safety play a role, while product substitutes, such as high-waisted leggings and bodycon dresses, pose a competitive challenge. End-user trends towards comfort, inclusivity, and sustainability influence product development. M&A activity has been moderate, with deal values averaging approximately xx Million in the past five years, mostly focusing on smaller companies being acquired by larger players to expand their product portfolios or gain access to new technologies.
Shapewear Market Industry Trends & Insights
The global shapewear market is experiencing robust growth, with a projected Compound Annual Growth Rate (CAGR) of xx% during the forecast period (2025-2033). This growth is fueled by rising disposable incomes, increasing health consciousness, and a growing awareness of body positivity and self-care. Technological advancements in fabric technology, such as the development of more comfortable, breathable, and sustainable materials, are significantly impacting market dynamics. Consumer preferences are shifting towards seamless designs, versatile styles, and inclusive sizing, pushing brands to offer a wider range of options. The market penetration of shapewear continues to increase, particularly in developing economies, as more consumers adopt this product category. Competitive dynamics are marked by both established players focusing on brand building and innovation, and the emergence of disruptive startups offering unique selling propositions and innovative business models. The market is witnessing a trend towards increased transparency and sustainability, with consumers demanding eco-friendly and ethically sourced products.
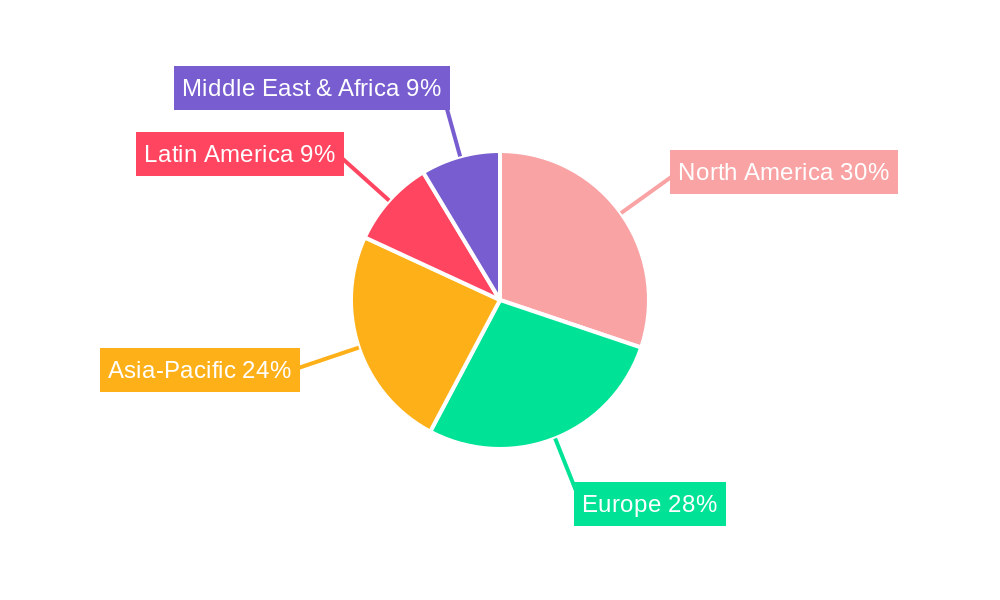
Dominant Markets & Segments in Shapewear Market
The North American market currently holds the dominant position in the global shapewear market, driven by high consumer spending, established brand presence, and a strong fashion-forward culture. This dominance is further reinforced by factors such as strong e-commerce infrastructure, readily available information on products, and a high level of consumer awareness.
- Key Drivers for North American Dominance:
- High disposable incomes
- Strong brand presence of major players
- Sophisticated e-commerce infrastructure
- High level of consumer awareness and acceptance of shapewear
- Focus on body positivity marketing campaigns
- A strong fashion-forward culture that embraces shapewear as a staple item of clothing
However, the Asia-Pacific region is projected to experience the fastest growth rate during the forecast period, driven by increasing urbanization, rising disposable incomes, and changing lifestyles. The European market maintains a significant share, characterized by a more established consumer base and a developed fashion industry.
Shapewear Market Product Developments
Recent product innovations in the shapewear market focus on improving comfort, breathability, and functionality. This includes the use of advanced materials like seamless, lightweight fabrics and innovative designs that enhance body shaping capabilities without compromising comfort. Technological advancements are enabling the incorporation of smart features and personalized fit solutions. Competitive advantages are increasingly derived from offering superior comfort, sustainability, inclusivity, and unique technological features. The market is seeing a move away from traditional, restrictive designs towards more comfortable and body-positive options.
Report Scope & Segmentation Analysis
This report segments the shapewear market based on product type (e.g., bodysuits, slips, shorts, briefs, camisoles), material (e.g., nylon, spandex, cotton blends), price range (e.g., economy, premium, luxury), distribution channel (e.g., online, retail stores), and geography (covering key regions and countries). Each segment's growth projections, market size, and competitive landscape are analyzed in detail, providing granular insights for strategic decision-making. Market size varies widely across segments, with the bodysuit segment currently dominating, followed by slips and shorts. The premium segment shows highest growth potential.
Key Drivers of Shapewear Market Growth
Several key factors propel the growth of the shapewear market. Technological advancements lead to improved comfort, breathability, and design. The rise of body positivity movements and increased awareness of self-care contribute to demand. Strong marketing and brand building efforts by key players have increased visibility and adoption. Growing disposable incomes, particularly in emerging economies, fuel demand. The shift toward online shopping makes purchasing shapewear more accessible and convenient.
Challenges in the Shapewear Market Sector
The shapewear market faces challenges, including intense competition from both established brands and new entrants. Supply chain disruptions can impact production and availability. Consumer preferences are dynamic, requiring continuous innovation and adaptation. Concerns regarding sustainability and ethical sourcing can affect brand perception. Furthermore, fluctuating raw material prices increase manufacturing costs.
Emerging Opportunities in Shapewear Market
The shapewear market presents exciting opportunities. The increasing demand for sustainable and ethically sourced products creates an opportunity for brands prioritizing eco-friendly materials and manufacturing processes. Expansion into new markets, particularly in developing economies with growing middle classes, promises significant potential. Integrating smart technologies into shapewear, such as wearables for health monitoring, could unlock new revenue streams. Personalized fit solutions and custom-made shapewear are also gaining traction.
Leading Players in the Shapewear Market
- Spanx LLC
- Jockey International Inc.
- Marks and Spencer Group PLC
- Triumph International
- Wacoal Holdings Corp
- Hunkemöller International B V
- Hanesbrands Inc
- Tennor Holding BV
- Honeylove Sculptwear Inc
- Skim
Key Developments in Shapewear Market Industry
- November 2023: Knix launched Leakproof Shapewear, expanding its product line with innovative technology.
- February 2024: Spanx launched a major brand campaign in London, enhancing brand visibility.
- June 2024: The 'Bodywear Collective' was launched at Performance Days, highlighting shapewear trends.
- July 2024: Boody introduced a new shapewear line, emphasizing comfort and breathability.
Strategic Outlook for Shapewear Market
The shapewear market is poised for continued growth, driven by ongoing innovation, evolving consumer preferences, and expanding market penetration. Focusing on sustainability, inclusivity, and technological advancements will be crucial for success. Brands that effectively leverage e-commerce and build strong brand identities will gain a competitive edge. Exploring new market segments and geographical areas will further fuel growth. Strategic partnerships and collaborations will also play a significant role in shaping the future of the market.
Shapewear Market Segmentation
-
1. Product Type
- 1.1. Full-body Shapers
- 1.2. High-waist Shapers
- 1.3. Shapewear Panties
- 1.4. Other Product Types
-
2. Distribution Channel
- 2.1. Supermarkets/Hypermarkets
- 2.2. Specialty Stores
- 2.3. Online Retail Stores
- 2.4. Other Distribution Channels
Shapewear Market Segmentation By Geography
-
1. North America
- 1.1. United States
- 1.2. Canada
- 1.3. Mexico
- 1.4. Rest of North America
-
2. Europe
- 2.1. United Kingdom
- 2.2. Germany
- 2.3. Spain
- 2.4. France
- 2.5. Italy
- 2.6. Russia
- 2.7. Rest of Europe
-
3. Asia Pacific
- 3.1. China
- 3.2. Japan
- 3.3. India
- 3.4. Australia
- 3.5. Rest of Asia Pacific
-
4. South America
- 4.1. Brazil
- 4.2. Argentina
- 4.3. Rest of South America
-
5. Middle East and Africa
- 5.1. South Africa
- 5.2. United Arab Emirates
- 5.3. Rest of Middle East and Africa
Shapewear Market Regional Market Share
Geographic Coverage of Shapewear Market
Shapewear Market REPORT HIGHLIGHTS
| Aspects | Details |
|---|---|
| Study Period | 2020-2034 |
| Base Year | 2025 |
| Estimated Year | 2026 |
| Forecast Period | 2026-2034 |
| Historical Period | 2020-2025 |
| Growth Rate | CAGR of 4.91% from 2020-2034 |
| Segmentation |
|
Table of Contents
- 1. Introduction
- 1.1. Research Scope
- 1.2. Market Segmentation
- 1.3. Research Objective
- 1.4. Definitions and Assumptions
- 2. Executive Summary
- 2.1. Market Snapshot
- 3. Market Dynamics
- 3.1. Market Drivers
- 3.2. Market Restrains
- 3.3. Market Trends
- 3.4. Market Opportunities
- 4. Market Factor Analysis
- 4.1. Porters Five Forces
- 4.1.1. Bargaining Power of Suppliers
- 4.1.2. Bargaining Power of Buyers
- 4.1.3. Threat of New Entrants
- 4.1.4. Threat of Substitutes
- 4.1.5. Competitive Rivalry
- 4.2. PESTEL analysis
- 4.3. BCG Analysis
- 4.3.1. Stars (High Growth, High Market Share)
- 4.3.2. Cash Cows (Low Growth, High Market Share)
- 4.3.3. Question Mark (High Growth, Low Market Share)
- 4.3.4. Dogs (Low Growth, Low Market Share)
- 4.4. Ansoff Matrix Analysis
- 4.5. Supply Chain Analysis
- 4.6. Regulatory Landscape
- 4.7. Current Market Potential and Opportunity Assessment (TAM–SAM–SOM Framework)
- 4.8. RAX Analyst Note
- 4.1. Porters Five Forces
- 5. Market Analysis, Insights and Forecast 2021-2033
- 5.1. Market Analysis, Insights and Forecast - by Product Type
- 5.1.1. Full-body Shapers
- 5.1.2. High-waist Shapers
- 5.1.3. Shapewear Panties
- 5.1.4. Other Product Types
- 5.2. Market Analysis, Insights and Forecast - by Distribution Channel
- 5.2.1. Supermarkets/Hypermarkets
- 5.2.2. Specialty Stores
- 5.2.3. Online Retail Stores
- 5.2.4. Other Distribution Channels
- 5.3. Market Analysis, Insights and Forecast - by Region
- 5.3.1. North America
- 5.3.2. Europe
- 5.3.3. Asia Pacific
- 5.3.4. South America
- 5.3.5. Middle East and Africa
- 5.1. Market Analysis, Insights and Forecast - by Product Type
- 6. Global Shapewear Market Analysis, Insights and Forecast, 2021-2033
- 6.1. Market Analysis, Insights and Forecast - by Product Type
- 6.1.1. Full-body Shapers
- 6.1.2. High-waist Shapers
- 6.1.3. Shapewear Panties
- 6.1.4. Other Product Types
- 6.2. Market Analysis, Insights and Forecast - by Distribution Channel
- 6.2.1. Supermarkets/Hypermarkets
- 6.2.2. Specialty Stores
- 6.2.3. Online Retail Stores
- 6.2.4. Other Distribution Channels
- 6.1. Market Analysis, Insights and Forecast - by Product Type
- 7. North America Shapewear Market Analysis, Insights and Forecast, 2020-2032
- 7.1. Market Analysis, Insights and Forecast - by Product Type
- 7.1.1. Full-body Shapers
- 7.1.2. High-waist Shapers
- 7.1.3. Shapewear Panties
- 7.1.4. Other Product Types
- 7.2. Market Analysis, Insights and Forecast - by Distribution Channel
- 7.2.1. Supermarkets/Hypermarkets
- 7.2.2. Specialty Stores
- 7.2.3. Online Retail Stores
- 7.2.4. Other Distribution Channels
- 7.1. Market Analysis, Insights and Forecast - by Product Type
- 8. Europe Shapewear Market Analysis, Insights and Forecast, 2020-2032
- 8.1. Market Analysis, Insights and Forecast - by Product Type
- 8.1.1. Full-body Shapers
- 8.1.2. High-waist Shapers
- 8.1.3. Shapewear Panties
- 8.1.4. Other Product Types
- 8.2. Market Analysis, Insights and Forecast - by Distribution Channel
- 8.2.1. Supermarkets/Hypermarkets
- 8.2.2. Specialty Stores
- 8.2.3. Online Retail Stores
- 8.2.4. Other Distribution Channels
- 8.1. Market Analysis, Insights and Forecast - by Product Type
- 9. Asia Pacific Shapewear Market Analysis, Insights and Forecast, 2020-2032
- 9.1. Market Analysis, Insights and Forecast - by Product Type
- 9.1.1. Full-body Shapers
- 9.1.2. High-waist Shapers
- 9.1.3. Shapewear Panties
- 9.1.4. Other Product Types
- 9.2. Market Analysis, Insights and Forecast - by Distribution Channel
- 9.2.1. Supermarkets/Hypermarkets
- 9.2.2. Specialty Stores
- 9.2.3. Online Retail Stores
- 9.2.4. Other Distribution Channels
- 9.1. Market Analysis, Insights and Forecast - by Product Type
- 10. South America Shapewear Market Analysis, Insights and Forecast, 2020-2032
- 10.1. Market Analysis, Insights and Forecast - by Product Type
- 10.1.1. Full-body Shapers
- 10.1.2. High-waist Shapers
- 10.1.3. Shapewear Panties
- 10.1.4. Other Product Types
- 10.2. Market Analysis, Insights and Forecast - by Distribution Channel
- 10.2.1. Supermarkets/Hypermarkets
- 10.2.2. Specialty Stores
- 10.2.3. Online Retail Stores
- 10.2.4. Other Distribution Channels
- 10.1. Market Analysis, Insights and Forecast - by Product Type
- 11. Middle East and Africa Shapewear Market Analysis, Insights and Forecast, 2020-2032
- 11.1. Market Analysis, Insights and Forecast - by Product Type
- 11.1.1. Full-body Shapers
- 11.1.2. High-waist Shapers
- 11.1.3. Shapewear Panties
- 11.1.4. Other Product Types
- 11.2. Market Analysis, Insights and Forecast - by Distribution Channel
- 11.2.1. Supermarkets/Hypermarkets
- 11.2.2. Specialty Stores
- 11.2.3. Online Retail Stores
- 11.2.4. Other Distribution Channels
- 11.1. Market Analysis, Insights and Forecast - by Product Type
- 12. Competitive Analysis
- 12.1. Company Profiles
- 12.1.1 Spanx LLC
- 12.1.1.1. Company Overview
- 12.1.1.2. Products
- 12.1.1.3. Company Financials
- 12.1.1.4. SWOT Analysis
- 12.1.2 Jockey International Inc
- 12.1.2.1. Company Overview
- 12.1.2.2. Products
- 12.1.2.3. Company Financials
- 12.1.2.4. SWOT Analysis
- 12.1.3 Marks and Spencer Group PLC
- 12.1.3.1. Company Overview
- 12.1.3.2. Products
- 12.1.3.3. Company Financials
- 12.1.3.4. SWOT Analysis
- 12.1.4 Triumph International
- 12.1.4.1. Company Overview
- 12.1.4.2. Products
- 12.1.4.3. Company Financials
- 12.1.4.4. SWOT Analysis
- 12.1.5 Wacoal Holdings Corp
- 12.1.5.1. Company Overview
- 12.1.5.2. Products
- 12.1.5.3. Company Financials
- 12.1.5.4. SWOT Analysis
- 12.1.6 Hunkemöller International B V
- 12.1.6.1. Company Overview
- 12.1.6.2. Products
- 12.1.6.3. Company Financials
- 12.1.6.4. SWOT Analysis
- 12.1.7 Hanesbrands Inc
- 12.1.7.1. Company Overview
- 12.1.7.2. Products
- 12.1.7.3. Company Financials
- 12.1.7.4. SWOT Analysis
- 12.1.8 Tennor Holding BV
- 12.1.8.1. Company Overview
- 12.1.8.2. Products
- 12.1.8.3. Company Financials
- 12.1.8.4. SWOT Analysis
- 12.1.9 Honeylove Sculptwear Inc
- 12.1.9.1. Company Overview
- 12.1.9.2. Products
- 12.1.9.3. Company Financials
- 12.1.9.4. SWOT Analysis
- 12.1.10 Skim
- 12.1.10.1. Company Overview
- 12.1.10.2. Products
- 12.1.10.3. Company Financials
- 12.1.10.4. SWOT Analysis
- 12.1.1 Spanx LLC
- 12.2. Market Entropy
- 12.2.1 Company's Key Areas Served
- 12.2.2 Recent Developments
- 12.3. Company Market Share Analysis 2025
- 12.3.1 Top 5 Companies Market Share Analysis
- 12.3.2 Top 3 Companies Market Share Analysis
- 12.4. List of Potential Customers
- 13. Research Methodology
List of Figures
- Figure 1: Global Shapewear Market Revenue Breakdown (Million, %) by Region 2025 & 2033
- Figure 2: Global Shapewear Market Volume Breakdown (Billion, %) by Region 2025 & 2033
- Figure 3: North America Shapewear Market Revenue (Million), by Product Type 2025 & 2033
- Figure 4: North America Shapewear Market Volume (Billion), by Product Type 2025 & 2033
- Figure 5: North America Shapewear Market Revenue Share (%), by Product Type 2025 & 2033
- Figure 6: North America Shapewear Market Volume Share (%), by Product Type 2025 & 2033
- Figure 7: North America Shapewear Market Revenue (Million), by Distribution Channel 2025 & 2033
- Figure 8: North America Shapewear Market Volume (Billion), by Distribution Channel 2025 & 2033
- Figure 9: North America Shapewear Market Revenue Share (%), by Distribution Channel 2025 & 2033
- Figure 10: North America Shapewear Market Volume Share (%), by Distribution Channel 2025 & 2033
- Figure 11: North America Shapewear Market Revenue (Million), by Country 2025 & 2033
- Figure 12: North America Shapewear Market Volume (Billion), by Country 2025 & 2033
- Figure 13: North America Shapewear Market Revenue Share (%), by Country 2025 & 2033
- Figure 14: North America Shapewear Market Volume Share (%), by Country 2025 & 2033
- Figure 15: Europe Shapewear Market Revenue (Million), by Product Type 2025 & 2033
- Figure 16: Europe Shapewear Market Volume (Billion), by Product Type 2025 & 2033
- Figure 17: Europe Shapewear Market Revenue Share (%), by Product Type 2025 & 2033
- Figure 18: Europe Shapewear Market Volume Share (%), by Product Type 2025 & 2033
- Figure 19: Europe Shapewear Market Revenue (Million), by Distribution Channel 2025 & 2033
- Figure 20: Europe Shapewear Market Volume (Billion), by Distribution Channel 2025 & 2033
- Figure 21: Europe Shapewear Market Revenue Share (%), by Distribution Channel 2025 & 2033
- Figure 22: Europe Shapewear Market Volume Share (%), by Distribution Channel 2025 & 2033
- Figure 23: Europe Shapewear Market Revenue (Million), by Country 2025 & 2033
- Figure 24: Europe Shapewear Market Volume (Billion), by Country 2025 & 2033
- Figure 25: Europe Shapewear Market Revenue Share (%), by Country 2025 & 2033
- Figure 26: Europe Shapewear Market Volume Share (%), by Country 2025 & 2033
- Figure 27: Asia Pacific Shapewear Market Revenue (Million), by Product Type 2025 & 2033
- Figure 28: Asia Pacific Shapewear Market Volume (Billion), by Product Type 2025 & 2033
- Figure 29: Asia Pacific Shapewear Market Revenue Share (%), by Product Type 2025 & 2033
- Figure 30: Asia Pacific Shapewear Market Volume Share (%), by Product Type 2025 & 2033
- Figure 31: Asia Pacific Shapewear Market Revenue (Million), by Distribution Channel 2025 & 2033
- Figure 32: Asia Pacific Shapewear Market Volume (Billion), by Distribution Channel 2025 & 2033
- Figure 33: Asia Pacific Shapewear Market Revenue Share (%), by Distribution Channel 2025 & 2033
- Figure 34: Asia Pacific Shapewear Market Volume Share (%), by Distribution Channel 2025 & 2033
- Figure 35: Asia Pacific Shapewear Market Revenue (Million), by Country 2025 & 2033
- Figure 36: Asia Pacific Shapewear Market Volume (Billion), by Country 2025 & 2033
- Figure 37: Asia Pacific Shapewear Market Revenue Share (%), by Country 2025 & 2033
- Figure 38: Asia Pacific Shapewear Market Volume Share (%), by Country 2025 & 2033
- Figure 39: South America Shapewear Market Revenue (Million), by Product Type 2025 & 2033
- Figure 40: South America Shapewear Market Volume (Billion), by Product Type 2025 & 2033
- Figure 41: South America Shapewear Market Revenue Share (%), by Product Type 2025 & 2033
- Figure 42: South America Shapewear Market Volume Share (%), by Product Type 2025 & 2033
- Figure 43: South America Shapewear Market Revenue (Million), by Distribution Channel 2025 & 2033
- Figure 44: South America Shapewear Market Volume (Billion), by Distribution Channel 2025 & 2033
- Figure 45: South America Shapewear Market Revenue Share (%), by Distribution Channel 2025 & 2033
- Figure 46: South America Shapewear Market Volume Share (%), by Distribution Channel 2025 & 2033
- Figure 47: South America Shapewear Market Revenue (Million), by Country 2025 & 2033
- Figure 48: South America Shapewear Market Volume (Billion), by Country 2025 & 2033
- Figure 49: South America Shapewear Market Revenue Share (%), by Country 2025 & 2033
- Figure 50: South America Shapewear Market Volume Share (%), by Country 2025 & 2033
- Figure 51: Middle East and Africa Shapewear Market Revenue (Million), by Product Type 2025 & 2033
- Figure 52: Middle East and Africa Shapewear Market Volume (Billion), by Product Type 2025 & 2033
- Figure 53: Middle East and Africa Shapewear Market Revenue Share (%), by Product Type 2025 & 2033
- Figure 54: Middle East and Africa Shapewear Market Volume Share (%), by Product Type 2025 & 2033
- Figure 55: Middle East and Africa Shapewear Market Revenue (Million), by Distribution Channel 2025 & 2033
- Figure 56: Middle East and Africa Shapewear Market Volume (Billion), by Distribution Channel 2025 & 2033
- Figure 57: Middle East and Africa Shapewear Market Revenue Share (%), by Distribution Channel 2025 & 2033
- Figure 58: Middle East and Africa Shapewear Market Volume Share (%), by Distribution Channel 2025 & 2033
- Figure 59: Middle East and Africa Shapewear Market Revenue (Million), by Country 2025 & 2033
- Figure 60: Middle East and Africa Shapewear Market Volume (Billion), by Country 2025 & 2033
- Figure 61: Middle East and Africa Shapewear Market Revenue Share (%), by Country 2025 & 2033
- Figure 62: Middle East and Africa Shapewear Market Volume Share (%), by Country 2025 & 2033
List of Tables
- Table 1: Global Shapewear Market Revenue Million Forecast, by Product Type 2020 & 2033
- Table 2: Global Shapewear Market Volume Billion Forecast, by Product Type 2020 & 2033
- Table 3: Global Shapewear Market Revenue Million Forecast, by Distribution Channel 2020 & 2033
- Table 4: Global Shapewear Market Volume Billion Forecast, by Distribution Channel 2020 & 2033
- Table 5: Global Shapewear Market Revenue Million Forecast, by Region 2020 & 2033
- Table 6: Global Shapewear Market Volume Billion Forecast, by Region 2020 & 2033
- Table 7: Global Shapewear Market Revenue Million Forecast, by Product Type 2020 & 2033
- Table 8: Global Shapewear Market Volume Billion Forecast, by Product Type 2020 & 2033
- Table 9: Global Shapewear Market Revenue Million Forecast, by Distribution Channel 2020 & 2033
- Table 10: Global Shapewear Market Volume Billion Forecast, by Distribution Channel 2020 & 2033
- Table 11: Global Shapewear Market Revenue Million Forecast, by Country 2020 & 2033
- Table 12: Global Shapewear Market Volume Billion Forecast, by Country 2020 & 2033
- Table 13: United States Shapewear Market Revenue (Million) Forecast, by Application 2020 & 2033
- Table 14: United States Shapewear Market Volume (Billion) Forecast, by Application 2020 & 2033
- Table 15: Canada Shapewear Market Revenue (Million) Forecast, by Application 2020 & 2033
- Table 16: Canada Shapewear Market Volume (Billion) Forecast, by Application 2020 & 2033
- Table 17: Mexico Shapewear Market Revenue (Million) Forecast, by Application 2020 & 2033
- Table 18: Mexico Shapewear Market Volume (Billion) Forecast, by Application 2020 & 2033
- Table 19: Rest of North America Shapewear Market Revenue (Million) Forecast, by Application 2020 & 2033
- Table 20: Rest of North America Shapewear Market Volume (Billion) Forecast, by Application 2020 & 2033
- Table 21: Global Shapewear Market Revenue Million Forecast, by Product Type 2020 & 2033
- Table 22: Global Shapewear Market Volume Billion Forecast, by Product Type 2020 & 2033
- Table 23: Global Shapewear Market Revenue Million Forecast, by Distribution Channel 2020 & 2033
- Table 24: Global Shapewear Market Volume Billion Forecast, by Distribution Channel 2020 & 2033
- Table 25: Global Shapewear Market Revenue Million Forecast, by Country 2020 & 2033
- Table 26: Global Shapewear Market Volume Billion Forecast, by Country 2020 & 2033
- Table 27: United Kingdom Shapewear Market Revenue (Million) Forecast, by Application 2020 & 2033
- Table 28: United Kingdom Shapewear Market Volume (Billion) Forecast, by Application 2020 & 2033
- Table 29: Germany Shapewear Market Revenue (Million) Forecast, by Application 2020 & 2033
- Table 30: Germany Shapewear Market Volume (Billion) Forecast, by Application 2020 & 2033
- Table 31: Spain Shapewear Market Revenue (Million) Forecast, by Application 2020 & 2033
- Table 32: Spain Shapewear Market Volume (Billion) Forecast, by Application 2020 & 2033
- Table 33: France Shapewear Market Revenue (Million) Forecast, by Application 2020 & 2033
- Table 34: France Shapewear Market Volume (Billion) Forecast, by Application 2020 & 2033
- Table 35: Italy Shapewear Market Revenue (Million) Forecast, by Application 2020 & 2033
- Table 36: Italy Shapewear Market Volume (Billion) Forecast, by Application 2020 & 2033
- Table 37: Russia Shapewear Market Revenue (Million) Forecast, by Application 2020 & 2033
- Table 38: Russia Shapewear Market Volume (Billion) Forecast, by Application 2020 & 2033
- Table 39: Rest of Europe Shapewear Market Revenue (Million) Forecast, by Application 2020 & 2033
- Table 40: Rest of Europe Shapewear Market Volume (Billion) Forecast, by Application 2020 & 2033
- Table 41: Global Shapewear Market Revenue Million Forecast, by Product Type 2020 & 2033
- Table 42: Global Shapewear Market Volume Billion Forecast, by Product Type 2020 & 2033
- Table 43: Global Shapewear Market Revenue Million Forecast, by Distribution Channel 2020 & 2033
- Table 44: Global Shapewear Market Volume Billion Forecast, by Distribution Channel 2020 & 2033
- Table 45: Global Shapewear Market Revenue Million Forecast, by Country 2020 & 2033
- Table 46: Global Shapewear Market Volume Billion Forecast, by Country 2020 & 2033
- Table 47: China Shapewear Market Revenue (Million) Forecast, by Application 2020 & 2033
- Table 48: China Shapewear Market Volume (Billion) Forecast, by Application 2020 & 2033
- Table 49: Japan Shapewear Market Revenue (Million) Forecast, by Application 2020 & 2033
- Table 50: Japan Shapewear Market Volume (Billion) Forecast, by Application 2020 & 2033
- Table 51: India Shapewear Market Revenue (Million) Forecast, by Application 2020 & 2033
- Table 52: India Shapewear Market Volume (Billion) Forecast, by Application 2020 & 2033
- Table 53: Australia Shapewear Market Revenue (Million) Forecast, by Application 2020 & 2033
- Table 54: Australia Shapewear Market Volume (Billion) Forecast, by Application 2020 & 2033
- Table 55: Rest of Asia Pacific Shapewear Market Revenue (Million) Forecast, by Application 2020 & 2033
- Table 56: Rest of Asia Pacific Shapewear Market Volume (Billion) Forecast, by Application 2020 & 2033
- Table 57: Global Shapewear Market Revenue Million Forecast, by Product Type 2020 & 2033
- Table 58: Global Shapewear Market Volume Billion Forecast, by Product Type 2020 & 2033
- Table 59: Global Shapewear Market Revenue Million Forecast, by Distribution Channel 2020 & 2033
- Table 60: Global Shapewear Market Volume Billion Forecast, by Distribution Channel 2020 & 2033
- Table 61: Global Shapewear Market Revenue Million Forecast, by Country 2020 & 2033
- Table 62: Global Shapewear Market Volume Billion Forecast, by Country 2020 & 2033
- Table 63: Brazil Shapewear Market Revenue (Million) Forecast, by Application 2020 & 2033
- Table 64: Brazil Shapewear Market Volume (Billion) Forecast, by Application 2020 & 2033
- Table 65: Argentina Shapewear Market Revenue (Million) Forecast, by Application 2020 & 2033
- Table 66: Argentina Shapewear Market Volume (Billion) Forecast, by Application 2020 & 2033
- Table 67: Rest of South America Shapewear Market Revenue (Million) Forecast, by Application 2020 & 2033
- Table 68: Rest of South America Shapewear Market Volume (Billion) Forecast, by Application 2020 & 2033
- Table 69: Global Shapewear Market Revenue Million Forecast, by Product Type 2020 & 2033
- Table 70: Global Shapewear Market Volume Billion Forecast, by Product Type 2020 & 2033
- Table 71: Global Shapewear Market Revenue Million Forecast, by Distribution Channel 2020 & 2033
- Table 72: Global Shapewear Market Volume Billion Forecast, by Distribution Channel 2020 & 2033
- Table 73: Global Shapewear Market Revenue Million Forecast, by Country 2020 & 2033
- Table 74: Global Shapewear Market Volume Billion Forecast, by Country 2020 & 2033
- Table 75: South Africa Shapewear Market Revenue (Million) Forecast, by Application 2020 & 2033
- Table 76: South Africa Shapewear Market Volume (Billion) Forecast, by Application 2020 & 2033
- Table 77: United Arab Emirates Shapewear Market Revenue (Million) Forecast, by Application 2020 & 2033
- Table 78: United Arab Emirates Shapewear Market Volume (Billion) Forecast, by Application 2020 & 2033
- Table 79: Rest of Middle East and Africa Shapewear Market Revenue (Million) Forecast, by Application 2020 & 2033
- Table 80: Rest of Middle East and Africa Shapewear Market Volume (Billion) Forecast, by Application 2020 & 2033
Frequently Asked Questions
1. What is the projected Compound Annual Growth Rate (CAGR) of the Shapewear Market?
The projected CAGR is approximately 4.91%.
2. Which companies are prominent players in the Shapewear Market?
Key companies in the market include Spanx LLC, Jockey International Inc, Marks and Spencer Group PLC, Triumph International, Wacoal Holdings Corp, Hunkemöller International B V, Hanesbrands Inc, Tennor Holding BV, Honeylove Sculptwear Inc, Skim.
3. What are the main segments of the Shapewear Market?
The market segments include Product Type, Distribution Channel.
4. Can you provide details about the market size?
The market size is estimated to be USD 2.36 Million as of 2022.
5. What are some drivers contributing to market growth?
Increase in Strategic Investment and Wider Product Availability; Advancement in Garment Design and Fabric Technology.
6. What are the notable trends driving market growth?
Rising Trend Of Full-body Shapewear Among Women.
7. Are there any restraints impacting market growth?
Increase in Strategic Investment and Wider Product Availability; Advancement in Garment Design and Fabric Technology.
8. Can you provide examples of recent developments in the market?
July 2024: Boody, an Australian underwear manufacturer, has launched a new shapewear product line. The Shaper Range offers improved support while maintaining comfort and breathability. Each item is engineered to accommodate body movement, incorporating a soft, wide waistband for a supportive and flattering fit.June 2024: The London Contour Experts Group (LCE), in partnership with the trade fair Performance Days, has launched the 'Bodywear Collective'. This new segment at Performance Days showcases trends in underwear, swimwear, dancewear, shapewear, and sportswear, including products such as sports bras and leggings.February 2024: Spanx, the renowned shapewear brand, debuted its inaugural brand campaign in London. The campaign, emphasizing the uniqueness of personal style, is prominently showcased at various tube stations across London, including high-traffic spots like Oxford Circus and Tottenham Court Road.November 2023: Knix, an intimate apparel company, introduced a new Leakproof technology in its shapewear product line. The Leakproof Shapewear has an absorption capacity of 0.8 to 3 teaspoons of liquid, equivalent to one to three standard tampons or one to two pantyliners. This product innovation is available in two variants: the Leakproof High Rise Shaper Short and the Leakproof High Rise Shaper Brief. Knix offers these products in a size range from XS to XXXXL.
9. What pricing options are available for accessing the report?
Pricing options include single-user, multi-user, and enterprise licenses priced at USD 4750, USD 5250, and USD 8750 respectively.
10. Is the market size provided in terms of value or volume?
The market size is provided in terms of value, measured in Million and volume, measured in Billion.
11. Are there any specific market keywords associated with the report?
Yes, the market keyword associated with the report is "Shapewear Market," which aids in identifying and referencing the specific market segment covered.
12. How do I determine which pricing option suits my needs best?
The pricing options vary based on user requirements and access needs. Individual users may opt for single-user licenses, while businesses requiring broader access may choose multi-user or enterprise licenses for cost-effective access to the report.
13. Are there any additional resources or data provided in the Shapewear Market report?
While the report offers comprehensive insights, it's advisable to review the specific contents or supplementary materials provided to ascertain if additional resources or data are available.
14. How can I stay updated on further developments or reports in the Shapewear Market?
To stay informed about further developments, trends, and reports in the Shapewear Market, consider subscribing to industry newsletters, following relevant companies and organizations, or regularly checking reputable industry news sources and publications.
Methodology
Step 1 - Identification of Relevant Samples Size from Population Database


Step 2 - Approaches for Defining Global Market Size (Value, Volume* & Price*)

Note*: In applicable scenarios
Step 3 - Data Sources
Primary Research
- Web Analytics
- Survey Reports
- Research Institute
- Latest Research Reports
- Opinion Leaders
Secondary Research
- Annual Reports
- White Paper
- Latest Press Release
- Industry Association
- Paid Database
- Investor Presentations

Step 4 - Data Triangulation
Involves using different sources of information in order to increase the validity of a study
These sources are likely to be stakeholders in a program - participants, other researchers, program staff, other community members, and so on.
Then we put all data in single framework & apply various statistical tools to find out the dynamic on the market.
During the analysis stage, feedback from the stakeholder groups would be compared to determine areas of agreement as well as areas of divergence