

Key Insights
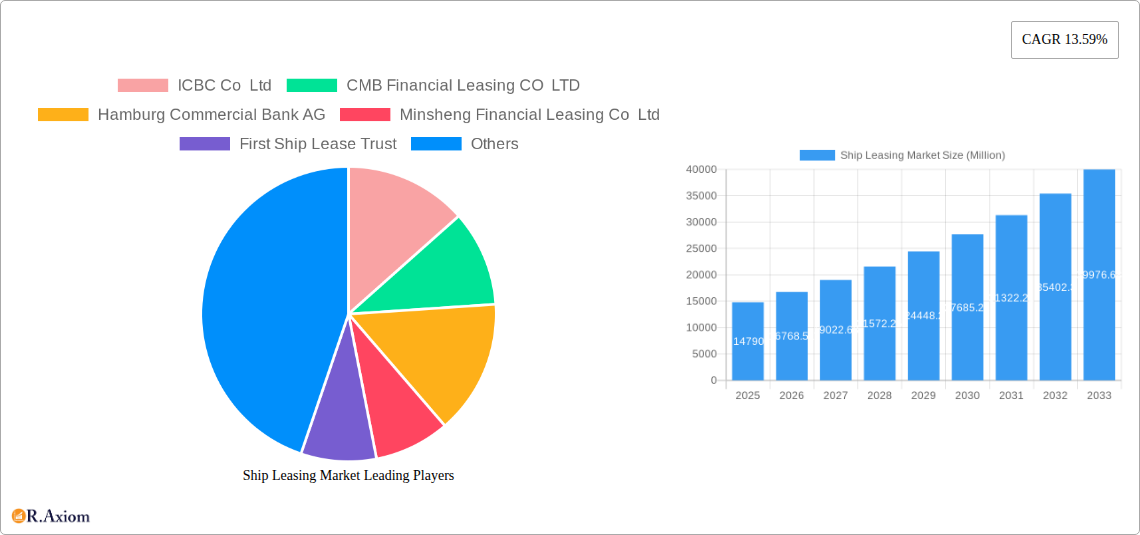
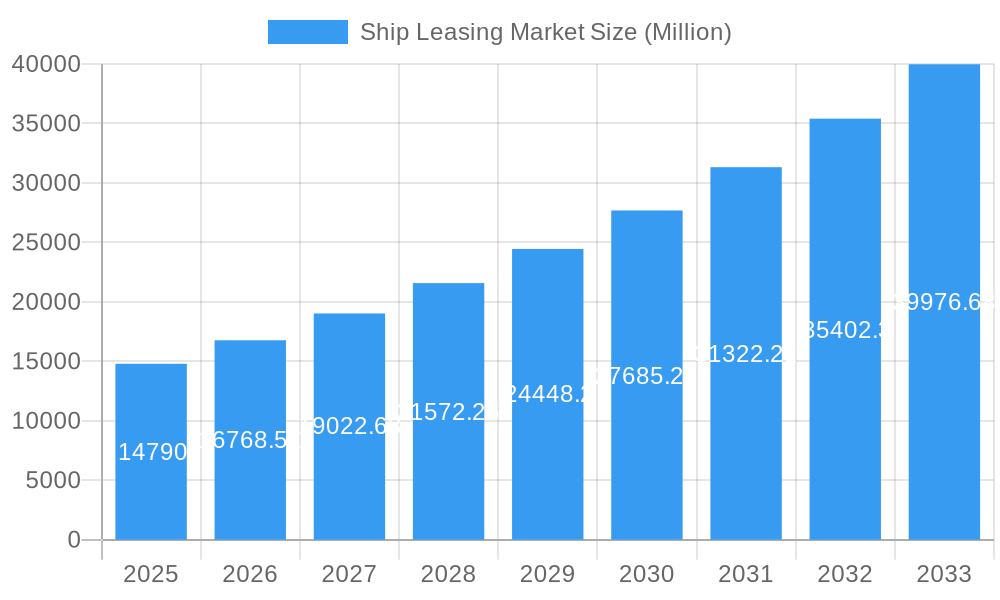
The global ship leasing market, valued at $14.79 billion in 2025, is projected to experience robust growth, exhibiting a Compound Annual Growth Rate (CAGR) of 13.59% from 2025 to 2033. This expansion is driven by several key factors. Increasing global trade volumes necessitate a larger fleet of vessels, fueling demand for leasing arrangements as a cost-effective alternative to outright ownership for shipping companies. Furthermore, the evolving preference for flexible operational models, including financial leases, full-service leases, and bareboat charters, caters to diverse business needs and risk appetites. Technological advancements, such as the implementation of real-time tracking and monitoring systems, enhance operational efficiency and transparency within lease agreements, further stimulating market growth. The Asia-Pacific region, particularly China and other Southeast Asian nations, is expected to be a major growth driver due to its expanding maritime trade activities and burgeoning demand for container and bulk carriers. However, market growth may be tempered by economic fluctuations impacting global trade and the potential for oversupply in specific vessel types, leading to pricing pressures. The diverse segmentations—lease type (financial, full-service), application (container, bulk carriers), and contract type (real-time, periodic tenancy, bareboat charter)—offer varied opportunities for market players, necessitating a nuanced understanding of the specific requirements and dynamics within each segment.
Ship Leasing Market Market Size (In Billion)
The competitive landscape is characterized by a mix of large financial institutions like ICBC Co Ltd and CMB Financial Leasing Co Ltd, alongside specialized ship leasing companies and major shipping lines like A P Møller - Mærsk A/S and Global Ship Lease Inc. These players compete on factors such as lease terms, financing options, and the breadth of their vessel portfolios. Strategic alliances and mergers and acquisitions are likely to further shape the market's competitive dynamics. The geographical distribution of leasing activity reflects global trade patterns, with North America, Europe, and Asia-Pacific regions comprising significant market shares. The continued growth in global trade, coupled with the benefits of ship leasing for both lessors and lessees, suggests a promising outlook for this market segment over the forecast period. However, careful monitoring of macroeconomic trends and potential supply-demand imbalances will be crucial for informed strategic decision-making within the industry.
Ship Leasing Market Company Market Share
Ship Leasing Market: A Comprehensive Report (2019-2033)
This in-depth report provides a comprehensive analysis of the global Ship Leasing Market, covering the period 2019-2033. It offers invaluable insights for industry stakeholders, investors, and businesses seeking to understand the market dynamics, growth drivers, and future potential. The report leverages extensive primary and secondary research, incorporating data from key players, industry experts, and reliable market sources. The study period encompasses the historical period (2019-2024), the base year (2025), and the forecast period (2025-2033). The report’s detailed segmentation enables granular analysis across various lease types, vessel applications, and lease durations, providing precise market sizing and growth projections. Key players like ICBC Co Ltd, CMB Financial Leasing CO LTD, and others are analyzed, offering a 360° view of this crucial maritime sector.
Ship Leasing Market Concentration & Innovation
This section analyzes the competitive landscape of the ship leasing market, examining market concentration, innovation drivers, and regulatory impacts. The report explores the market share held by key players like ICBC Co Ltd, CMB Financial Leasing CO LTD, and Hamburg Commercial Bank AG, assessing their individual strategies and contributions to market growth. It also investigates the role of mergers and acquisitions (M&A) activities in shaping the market, evaluating deal values and their influence on market consolidation. Innovation drivers such as technological advancements in vessel design and operational efficiency are explored, alongside the impact of regulatory frameworks and environmental concerns. The analysis also encompasses the impact of substitute products and services, evolving end-user trends (e.g., demand for larger, more efficient vessels), and other factors that drive market evolution.
- Market Concentration: The market exhibits a moderately concentrated structure, with the top five players accounting for an estimated xx% of the total market share in 2025.
- M&A Activity: The report analyzes significant M&A deals within the sector, estimating their total value at approximately xx Million during the historical period and predicting further activity with a total predicted value of xx Million in the forecast period.
- Innovation Drivers: Technological advancements, such as automation and digitalization, are driving efficiency gains and shaping future market developments.
- Regulatory Frameworks: International Maritime Organization (IMO) regulations on emissions and safety are significantly influencing market dynamics.
Ship Leasing Market Industry Trends & Insights
This section delves into the prevailing trends and insights shaping the ship leasing market. The report examines the market’s Compound Annual Growth Rate (CAGR) during the historical period and projects its future growth trajectory for the forecast period (2025-2033). Market penetration rates for various lease types and vessel applications are analyzed, showcasing market share evolution. The influence of technological disruptions, changing consumer preferences (e.g., demand for specific vessel types and leasing structures), and competitive dynamics are thoroughly explored. The report considers the impact of global trade patterns, economic growth in key regions, and technological disruptions, like the adoption of alternative fuels and autonomous vessels, on the overall market landscape. The analysis provides valuable insights into the factors driving market expansion and the challenges faced by market participants.
The global ship leasing market experienced a CAGR of xx% during 2019-2024. The forecast period (2025-2033) anticipates a CAGR of xx%, driven by increasing global trade and demand for efficient shipping solutions. Market penetration of financial leases is projected to reach xx% by 2033, indicating a significant market share.
Dominant Markets & Segments in Ship Leasing Market
This section identifies the dominant regions, countries, and market segments within the ship leasing market. It provides a detailed analysis of the leading segments across Lease Type (Financial Lease, Full-Service Lease), Application (Container Ships, Bulk Carriers), and Type (Real-Time Lease, Periodic Tenancy, Bareboat Charter, Other Types). Key drivers for dominance in each segment are highlighted, considering economic policies, infrastructure development, and regional trade patterns.
Lease Type: Financial leases dominate the market due to their tax advantages and flexibility.
Application: Container ship leasing is the largest segment, fueled by the growth in global containerized trade.
Type: Bareboat charters maintain a significant market share, driven by the flexibility they offer to charterers.
Key Drivers (Container Ship Leasing): Strong global trade growth, increasing demand for container transportation, and the economic advantages of leasing over ownership are key drivers of the segment's dominance.
Key Drivers (Financial Lease): Tax benefits, off-balance sheet financing, and flexibility offered by financial leases attract significant market participation.
Ship Leasing Market Product Developments
This section provides a comprehensive overview of recent and anticipated innovations within the ship leasing market. We explore how technological advancements, from enhanced energy efficiency to advanced automation, are reshaping leasing products. These developments are analyzed for their contribution to competitive advantages and their alignment with evolving market demands. Particular attention is paid to emerging trends in vessel technology, such as the adoption of alternative fuels (e.g., methanol, ammonia), digital twins for predictive maintenance, and smart shipping solutions, assessing their direct impact on leasing structures and customer value propositions.
Key product innovations are being spurred by advancements in vessel design focusing on reduced emissions and operational costs, alongside the integration of sophisticated digital technologies for real-time fleet monitoring, optimization, and enhanced transparency. These innovations are not only aimed at significantly lowering operational expenditures for lessees but also at increasing vessel utilization, improving safety, and attracting a broader spectrum of clients, including those prioritizing sustainability and cutting-edge operational capabilities.
Report Scope & Segmentation Analysis
This section provides a comprehensive overview of the report's scope and detailed segmentation analysis. Each segment's market size, growth projections, and competitive dynamics are presented.
- Lease Type: Financial Lease, Full-Service Lease (Market Size 2025: xx Million, Growth Projection: xx% 2025-2033)
- Application: Container Ships, Bulk Carriers (Market Size 2025: xx Million, Growth Projection: xx% 2025-2033)
- Type: Real-Time Lease, Periodic Tenancy, Bareboat Charter, Other Types (Market Size 2025: xx Million, Growth Projection: xx% 2025-2033)
Key Drivers of Ship Leasing Market Growth
This section delves into the fundamental forces propelling the expansion of the ship leasing market. We identify and analyze critical growth catalysts, including robust global trade dynamics, the relentless pursuit of operational efficiency by shipping operators, and the supportive influence of evolving regulatory landscapes. Specific examples and quantitative insights are provided to illustrate the impact of these drivers.
The sustained growth of global trade remains a primary engine for the ship leasing sector, fueling the demand for shipping capacity. Coupled with this is the increasing imperative for shipping companies to access modern, fuel-efficient, and technologically advanced vessels without the burden of significant capital expenditure. This is further amplified by favorable government policies that encourage maritime commerce, infrastructure development, and international trade agreements, creating an environment conducive to investment and expansion within the leasing market.
Challenges in the Ship Leasing Market Sector
This section addresses the challenges and constraints impacting the ship leasing market, including regulatory hurdles, supply chain disruptions, and competitive pressures. Quantifiable impacts of these challenges are discussed.
Fluctuations in fuel prices, intense competition among leasing companies, and stringent environmental regulations pose significant challenges to market players. Supply chain disruptions caused by geopolitical events or pandemics can also impact the market.
Emerging Opportunities in Ship Leasing Market
This section highlights emerging trends and opportunities in the ship leasing market, such as new market segments, technological advancements, and evolving consumer preferences.
Growing demand for specialized vessels, the adoption of innovative financing models, and expansion into new geographical markets represent promising opportunities for growth. The growing adoption of eco-friendly technologies and digital solutions offers further expansion prospects.
Leading Players in the Ship Leasing Market Market
- ICBC Co Ltd
- CMB Financial Leasing CO LTD
- Hamburg Commercial Bank AG
- Minsheng Financial Leasing Co Ltd
- First Ship Lease Trust
- MUFG Bank Ltd
- Bothra Group
- Bank of Communications Financial Leasing Co Ltd
- Galbraiths Ltd
- A P Møller - Mærsk A/S
- Global Ship Lease Inc
Key Developments in Ship Leasing Market Industry
- January 2023: Global Ship Lease Inc. secures a significant new long-term charter agreement for a cutting-edge, fuel-efficient container vessel, underscoring the demand for greener tonnage.
- June 2022: ICBC Financial Leasing Co., Ltd. announces a substantial investment in a new fleet of eco-friendly container ships, signaling a strong commitment to sustainable shipping solutions and fleet modernization.
- October 2021: CMB Financial Leasing CO LTD strategically merges with a specialized niche leasing company, expanding its service portfolio and strengthening its market position in specific shipping segments.
- March 2023: Seaspan Corporation enters into long-term agreements for the construction of newbuild LNG-fueled containerships, highlighting the growing trend towards decarbonization in vessel leasing.
- August 2022: HNA Leasing Group finalizes a large-scale financing deal for a diverse fleet of offshore support vessels, reflecting robust activity in specialized maritime asset leasing.
A more exhaustive enumeration of pivotal industry developments, including strategic partnerships and significant fleet expansions, is detailed within the complete market analysis report.
Strategic Outlook for Ship Leasing Market Market
The ship leasing market is projected for sustained and robust growth, underpinned by the enduring strength of global trade, the continuous adoption of transformative technologies, and the persistent need for efficient, reliable, and increasingly sustainable shipping solutions. The industry is expected to witness further consolidation through strategic mergers and acquisitions, as leading entities aim to broaden their market reach, diversify their asset portfolios, and enhance their comprehensive service offerings. Significant investments in pioneering technologies, such as next-generation alternative fuels, digitalization of operations, and the nascent development of autonomous vessels, are poised to redefine the future landscape of the market. The trajectory of the ship leasing market will remain intrinsically linked to global economic performance, the pace of technological innovation, and the evolution of international and regional regulatory frameworks, particularly concerning environmental standards and operational safety.
Ship Leasing Market Segmentation
-
1. Lease Type
- 1.1. Financial Lease
- 1.2. Full-Service Lease
-
2. Application
- 2.1. Container Ships
- 2.2. Bulk Carriers
-
3. Type
- 3.1. Real-Time Lease
- 3.2. Periodic Tenancy
- 3.3. Bareboat Charter
- 3.4. Other Types
Ship Leasing Market Segmentation By Geography
-
1. North America
- 1.1. United States
- 1.2. Canada
-
2. Europe
- 2.1. United Kingdom
- 2.2. France
- 2.3. Germany
- 2.4. Rest of Europe
-
3. Asia Pacific
- 3.1. China
- 3.2. India
- 3.3. Japan
- 3.4. South Korea
- 3.5. Rest of Asia Pacific
-
4. Latin America
- 4.1. Brazil
- 4.2. Rest of Latin America
-
5. Middle East and Africa
- 5.1. United Arab Emirates
- 5.2. Saudi Arabia
- 5.3. South Africa
- 5.4. Rest of Middle East and Africa
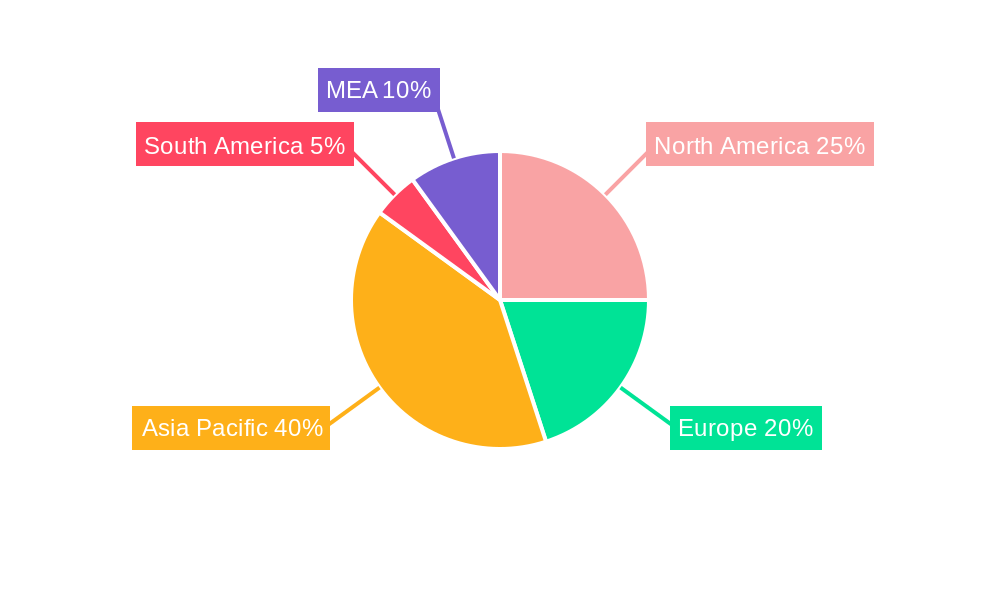
Ship Leasing Market Regional Market Share
Geographic Coverage of Ship Leasing Market
Ship Leasing Market REPORT HIGHLIGHTS
| Aspects | Details |
|---|---|
| Study Period | 2020-2034 |
| Base Year | 2025 |
| Estimated Year | 2026 |
| Forecast Period | 2026-2034 |
| Historical Period | 2020-2025 |
| Growth Rate | CAGR of 12% from 2020-2034 |
| Segmentation |
|
Table of Contents
- 1. Introduction
- 1.1. Research Scope
- 1.2. Market Segmentation
- 1.3. Research Objective
- 1.4. Definitions and Assumptions
- 2. Executive Summary
- 2.1. Market Snapshot
- 3. Market Dynamics
- 3.1. Market Drivers
- 3.2. Market Restrains
- 3.3. Market Trends
- 3.4. Market Opportunities
- 4. Market Factor Analysis
- 4.1. Porters Five Forces
- 4.1.1. Bargaining Power of Suppliers
- 4.1.2. Bargaining Power of Buyers
- 4.1.3. Threat of New Entrants
- 4.1.4. Threat of Substitutes
- 4.1.5. Competitive Rivalry
- 4.2. PESTEL analysis
- 4.3. BCG Analysis
- 4.3.1. Stars (High Growth, High Market Share)
- 4.3.2. Cash Cows (Low Growth, High Market Share)
- 4.3.3. Question Mark (High Growth, Low Market Share)
- 4.3.4. Dogs (Low Growth, Low Market Share)
- 4.4. Ansoff Matrix Analysis
- 4.5. Supply Chain Analysis
- 4.6. Regulatory Landscape
- 4.7. Current Market Potential and Opportunity Assessment (TAM–SAM–SOM Framework)
- 4.8. RAX Analyst Note
- 4.1. Porters Five Forces
- 5. Market Analysis, Insights and Forecast 2021-2033
- 5.1. Market Analysis, Insights and Forecast - by Lease Type
- 5.1.1. Financial Lease
- 5.1.2. Full-Service Lease
- 5.2. Market Analysis, Insights and Forecast - by Application
- 5.2.1. Container Ships
- 5.2.2. Bulk Carriers
- 5.3. Market Analysis, Insights and Forecast - by Type
- 5.3.1. Real-Time Lease
- 5.3.2. Periodic Tenancy
- 5.3.3. Bareboat Charter
- 5.3.4. Other Types
- 5.4. Market Analysis, Insights and Forecast - by Region
- 5.4.1. North America
- 5.4.2. Europe
- 5.4.3. Asia Pacific
- 5.4.4. Latin America
- 5.4.5. Middle East and Africa
- 5.1. Market Analysis, Insights and Forecast - by Lease Type
- 6. Global Ship Leasing Market Analysis, Insights and Forecast, 2021-2033
- 6.1. Market Analysis, Insights and Forecast - by Lease Type
- 6.1.1. Financial Lease
- 6.1.2. Full-Service Lease
- 6.2. Market Analysis, Insights and Forecast - by Application
- 6.2.1. Container Ships
- 6.2.2. Bulk Carriers
- 6.3. Market Analysis, Insights and Forecast - by Type
- 6.3.1. Real-Time Lease
- 6.3.2. Periodic Tenancy
- 6.3.3. Bareboat Charter
- 6.3.4. Other Types
- 6.1. Market Analysis, Insights and Forecast - by Lease Type
- 7. North America Ship Leasing Market Analysis, Insights and Forecast, 2020-2032
- 7.1. Market Analysis, Insights and Forecast - by Lease Type
- 7.1.1. Financial Lease
- 7.1.2. Full-Service Lease
- 7.2. Market Analysis, Insights and Forecast - by Application
- 7.2.1. Container Ships
- 7.2.2. Bulk Carriers
- 7.3. Market Analysis, Insights and Forecast - by Type
- 7.3.1. Real-Time Lease
- 7.3.2. Periodic Tenancy
- 7.3.3. Bareboat Charter
- 7.3.4. Other Types
- 7.1. Market Analysis, Insights and Forecast - by Lease Type
- 8. Europe Ship Leasing Market Analysis, Insights and Forecast, 2020-2032
- 8.1. Market Analysis, Insights and Forecast - by Lease Type
- 8.1.1. Financial Lease
- 8.1.2. Full-Service Lease
- 8.2. Market Analysis, Insights and Forecast - by Application
- 8.2.1. Container Ships
- 8.2.2. Bulk Carriers
- 8.3. Market Analysis, Insights and Forecast - by Type
- 8.3.1. Real-Time Lease
- 8.3.2. Periodic Tenancy
- 8.3.3. Bareboat Charter
- 8.3.4. Other Types
- 8.1. Market Analysis, Insights and Forecast - by Lease Type
- 9. Asia Pacific Ship Leasing Market Analysis, Insights and Forecast, 2020-2032
- 9.1. Market Analysis, Insights and Forecast - by Lease Type
- 9.1.1. Financial Lease
- 9.1.2. Full-Service Lease
- 9.2. Market Analysis, Insights and Forecast - by Application
- 9.2.1. Container Ships
- 9.2.2. Bulk Carriers
- 9.3. Market Analysis, Insights and Forecast - by Type
- 9.3.1. Real-Time Lease
- 9.3.2. Periodic Tenancy
- 9.3.3. Bareboat Charter
- 9.3.4. Other Types
- 9.1. Market Analysis, Insights and Forecast - by Lease Type
- 10. Latin America Ship Leasing Market Analysis, Insights and Forecast, 2020-2032
- 10.1. Market Analysis, Insights and Forecast - by Lease Type
- 10.1.1. Financial Lease
- 10.1.2. Full-Service Lease
- 10.2. Market Analysis, Insights and Forecast - by Application
- 10.2.1. Container Ships
- 10.2.2. Bulk Carriers
- 10.3. Market Analysis, Insights and Forecast - by Type
- 10.3.1. Real-Time Lease
- 10.3.2. Periodic Tenancy
- 10.3.3. Bareboat Charter
- 10.3.4. Other Types
- 10.1. Market Analysis, Insights and Forecast - by Lease Type
- 11. Middle East and Africa Ship Leasing Market Analysis, Insights and Forecast, 2020-2032
- 11.1. Market Analysis, Insights and Forecast - by Lease Type
- 11.1.1. Financial Lease
- 11.1.2. Full-Service Lease
- 11.2. Market Analysis, Insights and Forecast - by Application
- 11.2.1. Container Ships
- 11.2.2. Bulk Carriers
- 11.3. Market Analysis, Insights and Forecast - by Type
- 11.3.1. Real-Time Lease
- 11.3.2. Periodic Tenancy
- 11.3.3. Bareboat Charter
- 11.3.4. Other Types
- 11.1. Market Analysis, Insights and Forecast - by Lease Type
- 12. Competitive Analysis
- 12.1. Company Profiles
- 12.1.1 ICBC Co Ltd
- 12.1.1.1. Company Overview
- 12.1.1.2. Products
- 12.1.1.3. Company Financials
- 12.1.1.4. SWOT Analysis
- 12.1.2 CMB Financial Leasing CO LTD
- 12.1.2.1. Company Overview
- 12.1.2.2. Products
- 12.1.2.3. Company Financials
- 12.1.2.4. SWOT Analysis
- 12.1.3 Hamburg Commercial Bank AG
- 12.1.3.1. Company Overview
- 12.1.3.2. Products
- 12.1.3.3. Company Financials
- 12.1.3.4. SWOT Analysis
- 12.1.4 Minsheng Financial Leasing Co Ltd
- 12.1.4.1. Company Overview
- 12.1.4.2. Products
- 12.1.4.3. Company Financials
- 12.1.4.4. SWOT Analysis
- 12.1.5 First Ship Lease Trust
- 12.1.5.1. Company Overview
- 12.1.5.2. Products
- 12.1.5.3. Company Financials
- 12.1.5.4. SWOT Analysis
- 12.1.6 MUFG Bank Ltd
- 12.1.6.1. Company Overview
- 12.1.6.2. Products
- 12.1.6.3. Company Financials
- 12.1.6.4. SWOT Analysis
- 12.1.7 Bothra Group
- 12.1.7.1. Company Overview
- 12.1.7.2. Products
- 12.1.7.3. Company Financials
- 12.1.7.4. SWOT Analysis
- 12.1.8 Bank of Communications Financial Leasing Co Ltd
- 12.1.8.1. Company Overview
- 12.1.8.2. Products
- 12.1.8.3. Company Financials
- 12.1.8.4. SWOT Analysis
- 12.1.9 Galbraiths Ltd
- 12.1.9.1. Company Overview
- 12.1.9.2. Products
- 12.1.9.3. Company Financials
- 12.1.9.4. SWOT Analysis
- 12.1.10 A P Møller - Mærsk A/S
- 12.1.10.1. Company Overview
- 12.1.10.2. Products
- 12.1.10.3. Company Financials
- 12.1.10.4. SWOT Analysis
- 12.1.11 Global Ship Lease Inc
- 12.1.11.1. Company Overview
- 12.1.11.2. Products
- 12.1.11.3. Company Financials
- 12.1.11.4. SWOT Analysis
- 12.1.1 ICBC Co Ltd
- 12.2. Market Entropy
- 12.2.1 Company's Key Areas Served
- 12.2.2 Recent Developments
- 12.3. Company Market Share Analysis 2025
- 12.3.1 Top 5 Companies Market Share Analysis
- 12.3.2 Top 3 Companies Market Share Analysis
- 12.4. List of Potential Customers
- 13. Research Methodology
List of Figures
- Figure 1: Global Ship Leasing Market Revenue Breakdown (billion, %) by Region 2025 & 2033
- Figure 2: North America Ship Leasing Market Revenue (billion), by Lease Type 2025 & 2033
- Figure 3: North America Ship Leasing Market Revenue Share (%), by Lease Type 2025 & 2033
- Figure 4: North America Ship Leasing Market Revenue (billion), by Application 2025 & 2033
- Figure 5: North America Ship Leasing Market Revenue Share (%), by Application 2025 & 2033
- Figure 6: North America Ship Leasing Market Revenue (billion), by Type 2025 & 2033
- Figure 7: North America Ship Leasing Market Revenue Share (%), by Type 2025 & 2033
- Figure 8: North America Ship Leasing Market Revenue (billion), by Country 2025 & 2033
- Figure 9: North America Ship Leasing Market Revenue Share (%), by Country 2025 & 2033
- Figure 10: Europe Ship Leasing Market Revenue (billion), by Lease Type 2025 & 2033
- Figure 11: Europe Ship Leasing Market Revenue Share (%), by Lease Type 2025 & 2033
- Figure 12: Europe Ship Leasing Market Revenue (billion), by Application 2025 & 2033
- Figure 13: Europe Ship Leasing Market Revenue Share (%), by Application 2025 & 2033
- Figure 14: Europe Ship Leasing Market Revenue (billion), by Type 2025 & 2033
- Figure 15: Europe Ship Leasing Market Revenue Share (%), by Type 2025 & 2033
- Figure 16: Europe Ship Leasing Market Revenue (billion), by Country 2025 & 2033
- Figure 17: Europe Ship Leasing Market Revenue Share (%), by Country 2025 & 2033
- Figure 18: Asia Pacific Ship Leasing Market Revenue (billion), by Lease Type 2025 & 2033
- Figure 19: Asia Pacific Ship Leasing Market Revenue Share (%), by Lease Type 2025 & 2033
- Figure 20: Asia Pacific Ship Leasing Market Revenue (billion), by Application 2025 & 2033
- Figure 21: Asia Pacific Ship Leasing Market Revenue Share (%), by Application 2025 & 2033
- Figure 22: Asia Pacific Ship Leasing Market Revenue (billion), by Type 2025 & 2033
- Figure 23: Asia Pacific Ship Leasing Market Revenue Share (%), by Type 2025 & 2033
- Figure 24: Asia Pacific Ship Leasing Market Revenue (billion), by Country 2025 & 2033
- Figure 25: Asia Pacific Ship Leasing Market Revenue Share (%), by Country 2025 & 2033
- Figure 26: Latin America Ship Leasing Market Revenue (billion), by Lease Type 2025 & 2033
- Figure 27: Latin America Ship Leasing Market Revenue Share (%), by Lease Type 2025 & 2033
- Figure 28: Latin America Ship Leasing Market Revenue (billion), by Application 2025 & 2033
- Figure 29: Latin America Ship Leasing Market Revenue Share (%), by Application 2025 & 2033
- Figure 30: Latin America Ship Leasing Market Revenue (billion), by Type 2025 & 2033
- Figure 31: Latin America Ship Leasing Market Revenue Share (%), by Type 2025 & 2033
- Figure 32: Latin America Ship Leasing Market Revenue (billion), by Country 2025 & 2033
- Figure 33: Latin America Ship Leasing Market Revenue Share (%), by Country 2025 & 2033
- Figure 34: Middle East and Africa Ship Leasing Market Revenue (billion), by Lease Type 2025 & 2033
- Figure 35: Middle East and Africa Ship Leasing Market Revenue Share (%), by Lease Type 2025 & 2033
- Figure 36: Middle East and Africa Ship Leasing Market Revenue (billion), by Application 2025 & 2033
- Figure 37: Middle East and Africa Ship Leasing Market Revenue Share (%), by Application 2025 & 2033
- Figure 38: Middle East and Africa Ship Leasing Market Revenue (billion), by Type 2025 & 2033
- Figure 39: Middle East and Africa Ship Leasing Market Revenue Share (%), by Type 2025 & 2033
- Figure 40: Middle East and Africa Ship Leasing Market Revenue (billion), by Country 2025 & 2033
- Figure 41: Middle East and Africa Ship Leasing Market Revenue Share (%), by Country 2025 & 2033
List of Tables
- Table 1: Global Ship Leasing Market Revenue billion Forecast, by Lease Type 2020 & 2033
- Table 2: Global Ship Leasing Market Revenue billion Forecast, by Application 2020 & 2033
- Table 3: Global Ship Leasing Market Revenue billion Forecast, by Type 2020 & 2033
- Table 4: Global Ship Leasing Market Revenue billion Forecast, by Region 2020 & 2033
- Table 5: Global Ship Leasing Market Revenue billion Forecast, by Lease Type 2020 & 2033
- Table 6: Global Ship Leasing Market Revenue billion Forecast, by Application 2020 & 2033
- Table 7: Global Ship Leasing Market Revenue billion Forecast, by Type 2020 & 2033
- Table 8: Global Ship Leasing Market Revenue billion Forecast, by Country 2020 & 2033
- Table 9: United States Ship Leasing Market Revenue (billion) Forecast, by Application 2020 & 2033
- Table 10: Canada Ship Leasing Market Revenue (billion) Forecast, by Application 2020 & 2033
- Table 11: Global Ship Leasing Market Revenue billion Forecast, by Lease Type 2020 & 2033
- Table 12: Global Ship Leasing Market Revenue billion Forecast, by Application 2020 & 2033
- Table 13: Global Ship Leasing Market Revenue billion Forecast, by Type 2020 & 2033
- Table 14: Global Ship Leasing Market Revenue billion Forecast, by Country 2020 & 2033
- Table 15: United Kingdom Ship Leasing Market Revenue (billion) Forecast, by Application 2020 & 2033
- Table 16: France Ship Leasing Market Revenue (billion) Forecast, by Application 2020 & 2033
- Table 17: Germany Ship Leasing Market Revenue (billion) Forecast, by Application 2020 & 2033
- Table 18: Rest of Europe Ship Leasing Market Revenue (billion) Forecast, by Application 2020 & 2033
- Table 19: Global Ship Leasing Market Revenue billion Forecast, by Lease Type 2020 & 2033
- Table 20: Global Ship Leasing Market Revenue billion Forecast, by Application 2020 & 2033
- Table 21: Global Ship Leasing Market Revenue billion Forecast, by Type 2020 & 2033
- Table 22: Global Ship Leasing Market Revenue billion Forecast, by Country 2020 & 2033
- Table 23: China Ship Leasing Market Revenue (billion) Forecast, by Application 2020 & 2033
- Table 24: India Ship Leasing Market Revenue (billion) Forecast, by Application 2020 & 2033
- Table 25: Japan Ship Leasing Market Revenue (billion) Forecast, by Application 2020 & 2033
- Table 26: South Korea Ship Leasing Market Revenue (billion) Forecast, by Application 2020 & 2033
- Table 27: Rest of Asia Pacific Ship Leasing Market Revenue (billion) Forecast, by Application 2020 & 2033
- Table 28: Global Ship Leasing Market Revenue billion Forecast, by Lease Type 2020 & 2033
- Table 29: Global Ship Leasing Market Revenue billion Forecast, by Application 2020 & 2033
- Table 30: Global Ship Leasing Market Revenue billion Forecast, by Type 2020 & 2033
- Table 31: Global Ship Leasing Market Revenue billion Forecast, by Country 2020 & 2033
- Table 32: Brazil Ship Leasing Market Revenue (billion) Forecast, by Application 2020 & 2033
- Table 33: Rest of Latin America Ship Leasing Market Revenue (billion) Forecast, by Application 2020 & 2033
- Table 34: Global Ship Leasing Market Revenue billion Forecast, by Lease Type 2020 & 2033
- Table 35: Global Ship Leasing Market Revenue billion Forecast, by Application 2020 & 2033
- Table 36: Global Ship Leasing Market Revenue billion Forecast, by Type 2020 & 2033
- Table 37: Global Ship Leasing Market Revenue billion Forecast, by Country 2020 & 2033
- Table 38: United Arab Emirates Ship Leasing Market Revenue (billion) Forecast, by Application 2020 & 2033
- Table 39: Saudi Arabia Ship Leasing Market Revenue (billion) Forecast, by Application 2020 & 2033
- Table 40: South Africa Ship Leasing Market Revenue (billion) Forecast, by Application 2020 & 2033
- Table 41: Rest of Middle East and Africa Ship Leasing Market Revenue (billion) Forecast, by Application 2020 & 2033
Frequently Asked Questions
1. What is the projected Compound Annual Growth Rate (CAGR) of the Ship Leasing Market?
The projected CAGR is approximately 12%.
2. Which companies are prominent players in the Ship Leasing Market?
Key companies in the market include ICBC Co Ltd, CMB Financial Leasing CO LTD, Hamburg Commercial Bank AG, Minsheng Financial Leasing Co Ltd, First Ship Lease Trust, MUFG Bank Ltd, Bothra Group, Bank of Communications Financial Leasing Co Ltd, Galbraiths Ltd, A P Møller - Mærsk A/S, Global Ship Lease Inc.
3. What are the main segments of the Ship Leasing Market?
The market segments include Lease Type, Application, Type.
4. Can you provide details about the market size?
The market size is estimated to be USD 15.78 billion as of 2022.
5. What are some drivers contributing to market growth?
N/A
6. What are the notable trends driving market growth?
Bareboat Charter Segment is Expected to Witness Significant Growth During the Forecast Period.
7. Are there any restraints impacting market growth?
N/A
8. Can you provide examples of recent developments in the market?
N/A
9. What pricing options are available for accessing the report?
Pricing options include single-user, multi-user, and enterprise licenses priced at USD 4750, USD 5250, and USD 8750 respectively.
10. Is the market size provided in terms of value or volume?
The market size is provided in terms of value, measured in billion.
11. Are there any specific market keywords associated with the report?
Yes, the market keyword associated with the report is "Ship Leasing Market," which aids in identifying and referencing the specific market segment covered.
12. How do I determine which pricing option suits my needs best?
The pricing options vary based on user requirements and access needs. Individual users may opt for single-user licenses, while businesses requiring broader access may choose multi-user or enterprise licenses for cost-effective access to the report.
13. Are there any additional resources or data provided in the Ship Leasing Market report?
While the report offers comprehensive insights, it's advisable to review the specific contents or supplementary materials provided to ascertain if additional resources or data are available.
14. How can I stay updated on further developments or reports in the Ship Leasing Market?
To stay informed about further developments, trends, and reports in the Ship Leasing Market, consider subscribing to industry newsletters, following relevant companies and organizations, or regularly checking reputable industry news sources and publications.
Methodology
Step 1 - Identification of Relevant Samples Size from Population Database


Step 2 - Approaches for Defining Global Market Size (Value, Volume* & Price*)

Note*: In applicable scenarios
Step 3 - Data Sources
Primary Research
- Web Analytics
- Survey Reports
- Research Institute
- Latest Research Reports
- Opinion Leaders
Secondary Research
- Annual Reports
- White Paper
- Latest Press Release
- Industry Association
- Paid Database
- Investor Presentations

Step 4 - Data Triangulation
Involves using different sources of information in order to increase the validity of a study
These sources are likely to be stakeholders in a program - participants, other researchers, program staff, other community members, and so on.
Then we put all data in single framework & apply various statistical tools to find out the dynamic on the market.
During the analysis stage, feedback from the stakeholder groups would be compared to determine areas of agreement as well as areas of divergence