
Key Insights
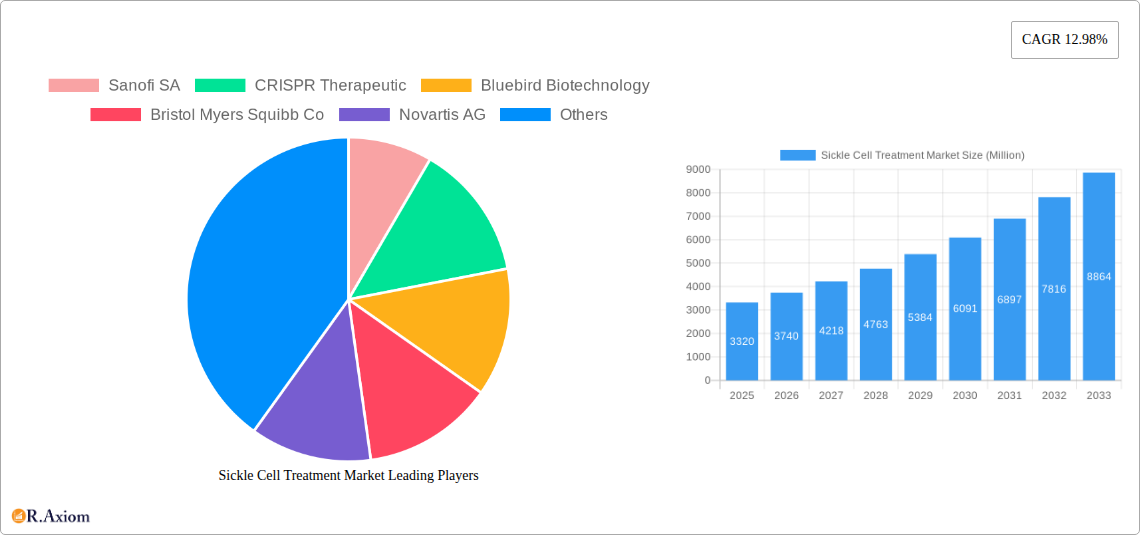
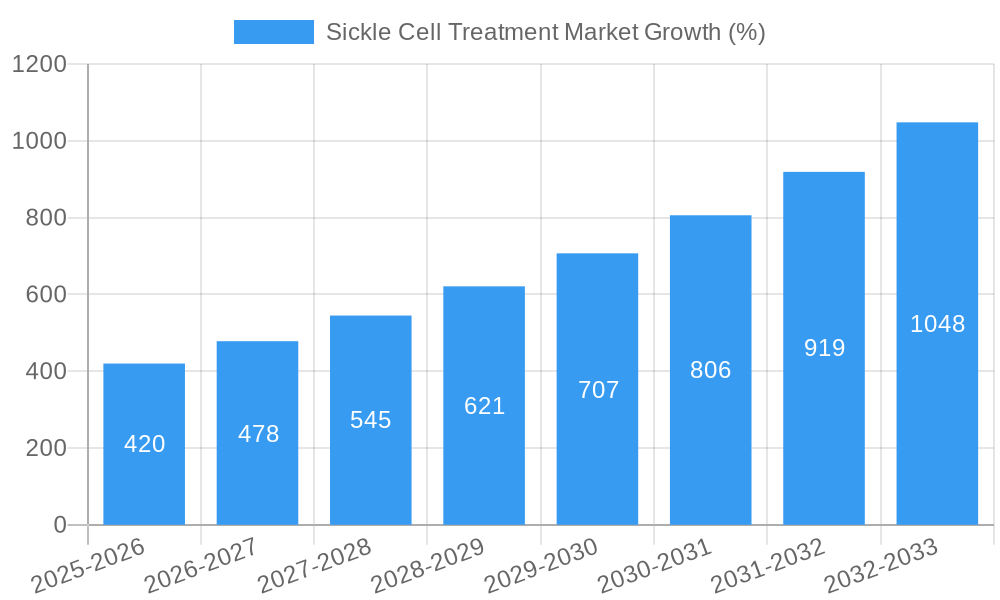
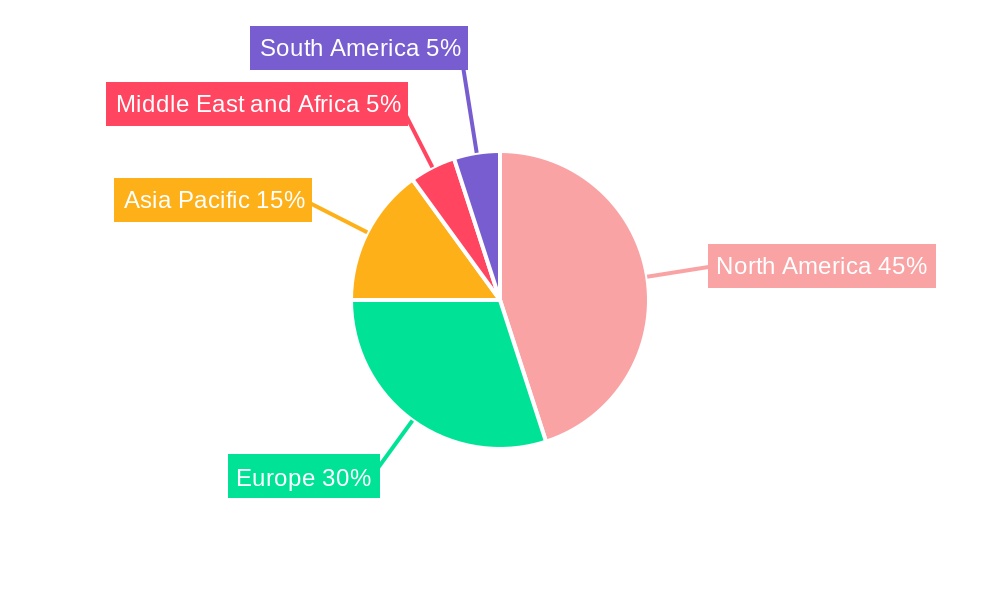
The global Sickle Cell Treatment market, valued at $3.32 billion in 2025, is poised for robust growth, exhibiting a Compound Annual Growth Rate (CAGR) of 12.98% from 2025 to 2033. This expansion is driven by several key factors. Firstly, increasing prevalence of sickle cell disease (SCD) globally, particularly in regions with high rates of consanguineous marriages, fuels demand for effective treatments. Secondly, advancements in gene editing therapies, such as CRISPR-Cas9 technology, offer promising curative options, significantly impacting market growth. Furthermore, the growing awareness and improved diagnosis of SCD are contributing to earlier interventions and a higher treatment rate. The market is segmented by end-user (hospitals, specialty clinics, other end-users) and treatment modality (blood transfusion, bone marrow transplant, pharmacotherapy). Hospitals currently represent a major share of the market due to their extensive infrastructure and capabilities for managing SCD complications. However, the increasing adoption of targeted pharmacotherapies and the emergence of gene therapies are shifting the landscape, potentially increasing the relative contribution of specialty clinics. The development and approval of new therapies, especially gene editing and cell-based therapies, will significantly impact future market growth projections. The North American market currently holds a substantial share, driven by high healthcare spending and advanced medical infrastructure. However, growing awareness and improved healthcare access in emerging economies such as those in Asia-Pacific and Africa will propel market expansion in these regions over the forecast period.
The competitive landscape is dynamic, featuring both established pharmaceutical giants like Sanofi SA, Novartis AG, and Pfizer Inc., alongside innovative biotechnology companies focusing on gene therapies such as CRISPR Therapeutics and Bluebird bio. These companies are actively engaged in research and development, contributing to a pipeline of promising new therapies. Strategic collaborations, acquisitions, and licensing agreements are prevalent, reflecting the intense competition and the significant potential of this market. The market's future trajectory will be influenced by factors such as pricing strategies of novel therapies, regulatory approvals, and reimbursement policies in different regions. The successful commercialization of curative therapies could drastically alter the market size and shape its future growth potential. Sustained investment in research and development, alongside public awareness campaigns aimed at early diagnosis and improved patient management, will be critical for long-term market expansion.
Sickle Cell Treatment Market: A Comprehensive Report (2019-2033)
This comprehensive report provides an in-depth analysis of the Sickle Cell Treatment Market, offering valuable insights for stakeholders across the healthcare industry. Covering the period from 2019 to 2033, with a focus on 2025, this report analyzes market trends, competitive dynamics, and future growth potential. The report utilizes a robust methodology, incorporating both historical data and forward-looking projections to deliver actionable intelligence. The market is segmented by end-user (Hospitals, Specialty Clinics, Other End Users) and treatment modality (Blood Transfusion, Bone Marrow Transplant, Pharmacotherapy). Key players analyzed include Sanofi SA, CRISPR Therapeutics, Bluebird Biotechnology, Bristol Myers Squibb Co, Novartis AG, Medunik USA, Addmedica, Glycomimetics Inc, Aruvant Sciences Inc, Emmaus Medical Inc, Global Blood Therapeutics Inc, Editas Medicine Inc, and Pfizer Inc.
Sickle Cell Treatment Market Market Concentration & Innovation
The Sickle Cell Treatment Market is characterized by a moderately concentrated landscape, with a few large multinational pharmaceutical companies holding significant market share. However, the emergence of innovative biotech companies focusing on gene therapies and novel pharmacotherapies is gradually altering this dynamic. The market's innovation is driven by continuous research into gene editing technologies like CRISPR-Cas9, advancements in stem cell transplantation, and the development of novel small molecule drugs targeting disease mechanisms. Regulatory frameworks, particularly those of the FDA and EMA, significantly influence market access and product approvals. While blood transfusions and bone marrow transplants remain established treatments, they face limitations, fueling demand for less invasive and more effective alternatives. The market also witnesses considerable M&A activity, with larger players acquiring smaller biotech firms possessing promising pipeline assets. For instance, the total value of M&A deals in the last 5 years was estimated at xx Million, with an average deal size of xx Million. This suggests ongoing consolidation and a shift towards a more integrated market structure. The overall market share of the top 5 players is estimated at xx%.
Sickle Cell Treatment Market Industry Trends & Insights
The Sickle Cell Treatment Market is experiencing substantial growth, projected to achieve a CAGR of xx% during the forecast period (2025-2033). Several factors contribute to this growth: the rising prevalence of sickle cell disease globally, increasing awareness and diagnosis rates, and the ongoing development of innovative therapies. Technological advancements, such as gene editing and personalized medicine approaches, are transforming the treatment landscape. Consumer preference is shifting towards less invasive treatments with improved efficacy and reduced side effects. Competitive dynamics are intense, with companies investing heavily in R&D to develop superior therapies and expand market access. Market penetration of novel therapies remains relatively low, with a significant portion of the patient population still relying on traditional treatments. However, this is anticipated to change as newer therapies gain wider adoption. The market is also influenced by factors such as healthcare infrastructure development, reimbursement policies, and increasing healthcare expenditure in emerging economies.
Dominant Markets & Segments in Sickle Cell Treatment Market
By End User: Hospitals dominate the Sickle Cell Treatment Market, holding an estimated xx% market share in 2025. This dominance stems from their extensive resources, specialized healthcare professionals, and established infrastructure for managing complex cases. Specialty clinics represent a smaller but growing segment, attracting patients seeking focused expertise. Other end-users, including home healthcare and ambulatory care centers, represent a niche market with slower growth.
By Treatment Modality: Pharmacotherapy currently holds the largest market share at approximately xx%, driven by the availability of approved drugs and their relative ease of administration. However, gene therapy and other advanced modalities are expected to gain significant market share over the forecast period, driven by their potential for curative treatment. While bone marrow transplantation represents a significant curative option, its complexity and cost restrict its widespread application. Blood transfusions, though essential for managing acute complications, are viewed as a palliative treatment with limitations.
Key drivers for the dominance of these segments include factors such as healthcare policies encouraging advanced treatment adoption and improving healthcare infrastructure. North America currently holds the largest market share due to factors such as high prevalence, extensive research and development activity, and favorable regulatory environment.
Sickle Cell Treatment Market Product Developments
The Sickle Cell Treatment Market is witnessing significant innovation, with a focus on gene therapies offering potential cures, novel small-molecule drugs targeting disease mechanisms, and improved blood transfusion technologies. CRISPR-based gene editing therapies are gaining traction, offering a potential for long-term disease modification. Small molecule drugs, such as Oxbryta, are offering new therapeutic options for managing hemolytic anemia associated with sickle cell disease. These advancements offer patients improved treatment outcomes, reduced reliance on frequent transfusions, and better quality of life. The market fit of these new therapies is largely determined by efficacy, safety, cost, and ease of administration.
Report Scope & Segmentation Analysis
This report segments the Sickle Cell Treatment Market by end-user (Hospitals, Specialty Clinics, Other End Users) and treatment modality (Blood Transfusion, Bone Marrow Transplant, Pharmacotherapy). Each segment is analyzed individually, projecting market size, growth rates, and competitive dynamics. The "Hospitals" segment is expected to witness steady growth, driven by the increasing number of specialized treatment centers. The "Specialty Clinics" segment is expected to show the highest growth rate, driven by the increasing demand for specialized care. The "Other End Users" segment is expected to experience moderate growth. In treatment modalities, "Pharmacotherapy" is expected to maintain its dominance, while "Gene Therapy" is projected to showcase significant growth, driven by technological advances and increasing clinical successes.
Key Drivers of Sickle Cell Treatment Market Growth
Several factors are driving the growth of the Sickle Cell Treatment Market. The increasing prevalence of sickle cell disease globally, along with improved diagnostic capabilities, contributes to a larger addressable market. Advancements in research and development leading to novel therapies, such as gene editing and targeted pharmacotherapies, are key growth catalysts. Favorable regulatory environments in several key markets are accelerating product approvals and market access. Furthermore, rising healthcare expenditure and increased government funding for research are supporting the development and implementation of advanced treatments.
Challenges in the Sickle Cell Treatment Market Sector
The Sickle Cell Treatment Market faces significant challenges. High treatment costs associated with novel therapies, particularly gene editing and bone marrow transplants, limit accessibility for many patients. The complexities of clinical trials and regulatory approvals create hurdles for new product launches. Manufacturing and supply chain challenges for advanced therapies can hinder market penetration. Furthermore, intense competition among established players and emerging biotech companies creates pressure on pricing and market share. The lack of awareness and diagnosis in certain regions also constrains market expansion.
Emerging Opportunities in Sickle Cell Treatment Market
Emerging opportunities in the Sickle Cell Treatment Market include the development of personalized medicine approaches, tailored to individual patient genetics and disease severity. Expansion into underserved markets with significant unmet needs offers significant growth potential. The continuous development of novel gene editing technologies and improved delivery systems presents opportunities for even more effective treatments. Lastly, collaborations between pharmaceutical companies and academic institutions can accelerate research and development, creating a pipeline of innovative therapies.
Leading Players in the Sickle Cell Treatment Market Market
- Sanofi SA
- CRISPR Therapeutics
- Bluebird Biotechnology
- Bristol Myers Squibb Co
- Novartis AG
- Medunik USA
- Addmedica
- Glycomimetics Inc
- Aruvant Sciences Inc
- Emmaus Medical Inc
- Global Blood Therapeutics Inc
- Editas Medicine Inc
- Pfizer Inc
Key Developments in Sickle Cell Treatment Market Industry
December 2022: Bluebird Bio Inc. announced that the US FDA had lifted a partial clinical hold on studies for its gene therapy to treat sickle cell disease. This development significantly boosted the prospects for this novel treatment modality.
February 2022: Global Blood Therapeutics Inc. received marketing authorization for Oxbryta to treat hemolytic anemia due to sickle cell disease in adult and pediatric patients 12 years and older. This approval broadened treatment options and increased market competition.
Strategic Outlook for Sickle Cell Treatment Market Market
The Sickle Cell Treatment Market is poised for significant growth, driven by continuous innovation in therapeutic modalities, increasing disease prevalence, and expanding market access. The ongoing development of more effective and affordable treatments will be a critical factor in shaping market dynamics. Companies focusing on personalized medicine and gene therapies are well-positioned to capture significant market share. Strategic partnerships and collaborations will play a crucial role in accelerating research and development, and facilitating faster market entry for innovative therapies. The market's future potential lies in the development of curative treatments and improved access to existing therapies in underserved regions.
Sickle Cell Treatment Market Segmentation
-
1. Treatment Modality
- 1.1. Blood Transfusion
- 1.2. Bone Marrow Transplant
- 1.3. Pharmacotherapy
-
2. End User
- 2.1. Hospitals
- 2.2. Specialty Clinics
- 2.3. Other End Users
Sickle Cell Treatment Market Segmentation By Geography
-
1. North America
- 1.1. United States
- 1.2. Canada
- 1.3. Mexico
-
2. Europe
- 2.1. Germany
- 2.2. United Kingdom
- 2.3. France
- 2.4. Italy
- 2.5. Spain
- 2.6. Rest of Europe
-
3. Asia Pacific
- 3.1. China
- 3.2. Japan
- 3.3. India
- 3.4. Australia
- 3.5. South Korea
- 3.6. Rest of Asia Pacific
-
4. Middle East and Africa
- 4.1. GCC
- 4.2. South Africa
- 4.3. Rest of Middle East and Africa
-
5. South America
- 5.1. Brazil
- 5.2. Argentina
- 5.3. Rest of South America
Sickle Cell Treatment Market REPORT HIGHLIGHTS
| Aspects | Details |
|---|---|
| Study Period | 2019-2033 |
| Base Year | 2024 |
| Estimated Year | 2025 |
| Forecast Period | 2025-2033 |
| Historical Period | 2019-2024 |
| Growth Rate | CAGR of 12.98% from 2019-2033 |
| Segmentation |
|
Table of Contents
- 1. Introduction
- 1.1. Research Scope
- 1.2. Market Segmentation
- 1.3. Research Methodology
- 1.4. Definitions and Assumptions
- 2. Executive Summary
- 2.1. Introduction
- 3. Market Dynamics
- 3.1. Introduction
- 3.2. Market Drivers
- 3.2.1. Increasing Prevalence of Sickle Cell Disease; Increasing R&D Activity
- 3.3. Market Restrains
- 3.3.1. High Cost of Treatment
- 3.4. Market Trends
- 3.4.1. Blood Transfusion Segment is Expected to Witness Significant Growth Over the Forecast Period
- 4. Market Factor Analysis
- 4.1. Porters Five Forces
- 4.2. Supply/Value Chain
- 4.3. PESTEL analysis
- 4.4. Market Entropy
- 4.5. Patent/Trademark Analysis
- 5. Global Sickle Cell Treatment Market Analysis, Insights and Forecast, 2019-2031
- 5.1. Market Analysis, Insights and Forecast - by Treatment Modality
- 5.1.1. Blood Transfusion
- 5.1.2. Bone Marrow Transplant
- 5.1.3. Pharmacotherapy
- 5.2. Market Analysis, Insights and Forecast - by End User
- 5.2.1. Hospitals
- 5.2.2. Specialty Clinics
- 5.2.3. Other End Users
- 5.3. Market Analysis, Insights and Forecast - by Region
- 5.3.1. North America
- 5.3.2. Europe
- 5.3.3. Asia Pacific
- 5.3.4. Middle East and Africa
- 5.3.5. South America
- 5.1. Market Analysis, Insights and Forecast - by Treatment Modality
- 6. North America Sickle Cell Treatment Market Analysis, Insights and Forecast, 2019-2031
- 6.1. Market Analysis, Insights and Forecast - by Treatment Modality
- 6.1.1. Blood Transfusion
- 6.1.2. Bone Marrow Transplant
- 6.1.3. Pharmacotherapy
- 6.2. Market Analysis, Insights and Forecast - by End User
- 6.2.1. Hospitals
- 6.2.2. Specialty Clinics
- 6.2.3. Other End Users
- 6.1. Market Analysis, Insights and Forecast - by Treatment Modality
- 7. Europe Sickle Cell Treatment Market Analysis, Insights and Forecast, 2019-2031
- 7.1. Market Analysis, Insights and Forecast - by Treatment Modality
- 7.1.1. Blood Transfusion
- 7.1.2. Bone Marrow Transplant
- 7.1.3. Pharmacotherapy
- 7.2. Market Analysis, Insights and Forecast - by End User
- 7.2.1. Hospitals
- 7.2.2. Specialty Clinics
- 7.2.3. Other End Users
- 7.1. Market Analysis, Insights and Forecast - by Treatment Modality
- 8. Asia Pacific Sickle Cell Treatment Market Analysis, Insights and Forecast, 2019-2031
- 8.1. Market Analysis, Insights and Forecast - by Treatment Modality
- 8.1.1. Blood Transfusion
- 8.1.2. Bone Marrow Transplant
- 8.1.3. Pharmacotherapy
- 8.2. Market Analysis, Insights and Forecast - by End User
- 8.2.1. Hospitals
- 8.2.2. Specialty Clinics
- 8.2.3. Other End Users
- 8.1. Market Analysis, Insights and Forecast - by Treatment Modality
- 9. Middle East and Africa Sickle Cell Treatment Market Analysis, Insights and Forecast, 2019-2031
- 9.1. Market Analysis, Insights and Forecast - by Treatment Modality
- 9.1.1. Blood Transfusion
- 9.1.2. Bone Marrow Transplant
- 9.1.3. Pharmacotherapy
- 9.2. Market Analysis, Insights and Forecast - by End User
- 9.2.1. Hospitals
- 9.2.2. Specialty Clinics
- 9.2.3. Other End Users
- 9.1. Market Analysis, Insights and Forecast - by Treatment Modality
- 10. South America Sickle Cell Treatment Market Analysis, Insights and Forecast, 2019-2031
- 10.1. Market Analysis, Insights and Forecast - by Treatment Modality
- 10.1.1. Blood Transfusion
- 10.1.2. Bone Marrow Transplant
- 10.1.3. Pharmacotherapy
- 10.2. Market Analysis, Insights and Forecast - by End User
- 10.2.1. Hospitals
- 10.2.2. Specialty Clinics
- 10.2.3. Other End Users
- 10.1. Market Analysis, Insights and Forecast - by Treatment Modality
- 11. North America Sickle Cell Treatment Market Analysis, Insights and Forecast, 2019-2031
- 11.1. Market Analysis, Insights and Forecast - By Country/Sub-region
- 11.1.1 United States
- 11.1.2 Canada
- 11.1.3 Mexico
- 12. Europe Sickle Cell Treatment Market Analysis, Insights and Forecast, 2019-2031
- 12.1. Market Analysis, Insights and Forecast - By Country/Sub-region
- 12.1.1 Germany
- 12.1.2 United Kingdom
- 12.1.3 France
- 12.1.4 Italy
- 12.1.5 Spain
- 12.1.6 Rest of Europe
- 13. Asia Pacific Sickle Cell Treatment Market Analysis, Insights and Forecast, 2019-2031
- 13.1. Market Analysis, Insights and Forecast - By Country/Sub-region
- 13.1.1 China
- 13.1.2 Japan
- 13.1.3 India
- 13.1.4 Australia
- 13.1.5 South Korea
- 13.1.6 Rest of Asia Pacific
- 14. Middle East and Africa Sickle Cell Treatment Market Analysis, Insights and Forecast, 2019-2031
- 14.1. Market Analysis, Insights and Forecast - By Country/Sub-region
- 14.1.1 GCC
- 14.1.2 South Africa
- 14.1.3 Rest of Middle East and Africa
- 15. South America Sickle Cell Treatment Market Analysis, Insights and Forecast, 2019-2031
- 15.1. Market Analysis, Insights and Forecast - By Country/Sub-region
- 15.1.1 Brazil
- 15.1.2 Argentina
- 15.1.3 Rest of South America
- 16. Competitive Analysis
- 16.1. Global Market Share Analysis 2024
- 16.2. Company Profiles
- 16.2.1 Sanofi SA
- 16.2.1.1. Overview
- 16.2.1.2. Products
- 16.2.1.3. SWOT Analysis
- 16.2.1.4. Recent Developments
- 16.2.1.5. Financials (Based on Availability)
- 16.2.2 CRISPR Therapeutic
- 16.2.2.1. Overview
- 16.2.2.2. Products
- 16.2.2.3. SWOT Analysis
- 16.2.2.4. Recent Developments
- 16.2.2.5. Financials (Based on Availability)
- 16.2.3 Bluebird Biotechnology
- 16.2.3.1. Overview
- 16.2.3.2. Products
- 16.2.3.3. SWOT Analysis
- 16.2.3.4. Recent Developments
- 16.2.3.5. Financials (Based on Availability)
- 16.2.4 Bristol Myers Squibb Co
- 16.2.4.1. Overview
- 16.2.4.2. Products
- 16.2.4.3. SWOT Analysis
- 16.2.4.4. Recent Developments
- 16.2.4.5. Financials (Based on Availability)
- 16.2.5 Novartis AG
- 16.2.5.1. Overview
- 16.2.5.2. Products
- 16.2.5.3. SWOT Analysis
- 16.2.5.4. Recent Developments
- 16.2.5.5. Financials (Based on Availability)
- 16.2.6 Medunik USA
- 16.2.6.1. Overview
- 16.2.6.2. Products
- 16.2.6.3. SWOT Analysis
- 16.2.6.4. Recent Developments
- 16.2.6.5. Financials (Based on Availability)
- 16.2.7 Addmedica
- 16.2.7.1. Overview
- 16.2.7.2. Products
- 16.2.7.3. SWOT Analysis
- 16.2.7.4. Recent Developments
- 16.2.7.5. Financials (Based on Availability)
- 16.2.8 Glycomimetics Inc
- 16.2.8.1. Overview
- 16.2.8.2. Products
- 16.2.8.3. SWOT Analysis
- 16.2.8.4. Recent Developments
- 16.2.8.5. Financials (Based on Availability)
- 16.2.9 Aruvant Sciences Inc
- 16.2.9.1. Overview
- 16.2.9.2. Products
- 16.2.9.3. SWOT Analysis
- 16.2.9.4. Recent Developments
- 16.2.9.5. Financials (Based on Availability)
- 16.2.10 Emmaus Medical Inc
- 16.2.10.1. Overview
- 16.2.10.2. Products
- 16.2.10.3. SWOT Analysis
- 16.2.10.4. Recent Developments
- 16.2.10.5. Financials (Based on Availability)
- 16.2.11 Global Blood Therapeutics Inc
- 16.2.11.1. Overview
- 16.2.11.2. Products
- 16.2.11.3. SWOT Analysis
- 16.2.11.4. Recent Developments
- 16.2.11.5. Financials (Based on Availability)
- 16.2.12 Editas Medicine Inc
- 16.2.12.1. Overview
- 16.2.12.2. Products
- 16.2.12.3. SWOT Analysis
- 16.2.12.4. Recent Developments
- 16.2.12.5. Financials (Based on Availability)
- 16.2.13 Pfizer Inc
- 16.2.13.1. Overview
- 16.2.13.2. Products
- 16.2.13.3. SWOT Analysis
- 16.2.13.4. Recent Developments
- 16.2.13.5. Financials (Based on Availability)
- 16.2.1 Sanofi SA
List of Figures
- Figure 1: Global Sickle Cell Treatment Market Revenue Breakdown (Million, %) by Region 2024 & 2032
- Figure 2: Global Sickle Cell Treatment Market Volume Breakdown (K Unit, %) by Region 2024 & 2032
- Figure 3: North America Sickle Cell Treatment Market Revenue (Million), by Country 2024 & 2032
- Figure 4: North America Sickle Cell Treatment Market Volume (K Unit), by Country 2024 & 2032
- Figure 5: North America Sickle Cell Treatment Market Revenue Share (%), by Country 2024 & 2032
- Figure 6: North America Sickle Cell Treatment Market Volume Share (%), by Country 2024 & 2032
- Figure 7: Europe Sickle Cell Treatment Market Revenue (Million), by Country 2024 & 2032
- Figure 8: Europe Sickle Cell Treatment Market Volume (K Unit), by Country 2024 & 2032
- Figure 9: Europe Sickle Cell Treatment Market Revenue Share (%), by Country 2024 & 2032
- Figure 10: Europe Sickle Cell Treatment Market Volume Share (%), by Country 2024 & 2032
- Figure 11: Asia Pacific Sickle Cell Treatment Market Revenue (Million), by Country 2024 & 2032
- Figure 12: Asia Pacific Sickle Cell Treatment Market Volume (K Unit), by Country 2024 & 2032
- Figure 13: Asia Pacific Sickle Cell Treatment Market Revenue Share (%), by Country 2024 & 2032
- Figure 14: Asia Pacific Sickle Cell Treatment Market Volume Share (%), by Country 2024 & 2032
- Figure 15: Middle East and Africa Sickle Cell Treatment Market Revenue (Million), by Country 2024 & 2032
- Figure 16: Middle East and Africa Sickle Cell Treatment Market Volume (K Unit), by Country 2024 & 2032
- Figure 17: Middle East and Africa Sickle Cell Treatment Market Revenue Share (%), by Country 2024 & 2032
- Figure 18: Middle East and Africa Sickle Cell Treatment Market Volume Share (%), by Country 2024 & 2032
- Figure 19: South America Sickle Cell Treatment Market Revenue (Million), by Country 2024 & 2032
- Figure 20: South America Sickle Cell Treatment Market Volume (K Unit), by Country 2024 & 2032
- Figure 21: South America Sickle Cell Treatment Market Revenue Share (%), by Country 2024 & 2032
- Figure 22: South America Sickle Cell Treatment Market Volume Share (%), by Country 2024 & 2032
- Figure 23: North America Sickle Cell Treatment Market Revenue (Million), by Treatment Modality 2024 & 2032
- Figure 24: North America Sickle Cell Treatment Market Volume (K Unit), by Treatment Modality 2024 & 2032
- Figure 25: North America Sickle Cell Treatment Market Revenue Share (%), by Treatment Modality 2024 & 2032
- Figure 26: North America Sickle Cell Treatment Market Volume Share (%), by Treatment Modality 2024 & 2032
- Figure 27: North America Sickle Cell Treatment Market Revenue (Million), by End User 2024 & 2032
- Figure 28: North America Sickle Cell Treatment Market Volume (K Unit), by End User 2024 & 2032
- Figure 29: North America Sickle Cell Treatment Market Revenue Share (%), by End User 2024 & 2032
- Figure 30: North America Sickle Cell Treatment Market Volume Share (%), by End User 2024 & 2032
- Figure 31: North America Sickle Cell Treatment Market Revenue (Million), by Country 2024 & 2032
- Figure 32: North America Sickle Cell Treatment Market Volume (K Unit), by Country 2024 & 2032
- Figure 33: North America Sickle Cell Treatment Market Revenue Share (%), by Country 2024 & 2032
- Figure 34: North America Sickle Cell Treatment Market Volume Share (%), by Country 2024 & 2032
- Figure 35: Europe Sickle Cell Treatment Market Revenue (Million), by Treatment Modality 2024 & 2032
- Figure 36: Europe Sickle Cell Treatment Market Volume (K Unit), by Treatment Modality 2024 & 2032
- Figure 37: Europe Sickle Cell Treatment Market Revenue Share (%), by Treatment Modality 2024 & 2032
- Figure 38: Europe Sickle Cell Treatment Market Volume Share (%), by Treatment Modality 2024 & 2032
- Figure 39: Europe Sickle Cell Treatment Market Revenue (Million), by End User 2024 & 2032
- Figure 40: Europe Sickle Cell Treatment Market Volume (K Unit), by End User 2024 & 2032
- Figure 41: Europe Sickle Cell Treatment Market Revenue Share (%), by End User 2024 & 2032
- Figure 42: Europe Sickle Cell Treatment Market Volume Share (%), by End User 2024 & 2032
- Figure 43: Europe Sickle Cell Treatment Market Revenue (Million), by Country 2024 & 2032
- Figure 44: Europe Sickle Cell Treatment Market Volume (K Unit), by Country 2024 & 2032
- Figure 45: Europe Sickle Cell Treatment Market Revenue Share (%), by Country 2024 & 2032
- Figure 46: Europe Sickle Cell Treatment Market Volume Share (%), by Country 2024 & 2032
- Figure 47: Asia Pacific Sickle Cell Treatment Market Revenue (Million), by Treatment Modality 2024 & 2032
- Figure 48: Asia Pacific Sickle Cell Treatment Market Volume (K Unit), by Treatment Modality 2024 & 2032
- Figure 49: Asia Pacific Sickle Cell Treatment Market Revenue Share (%), by Treatment Modality 2024 & 2032
- Figure 50: Asia Pacific Sickle Cell Treatment Market Volume Share (%), by Treatment Modality 2024 & 2032
- Figure 51: Asia Pacific Sickle Cell Treatment Market Revenue (Million), by End User 2024 & 2032
- Figure 52: Asia Pacific Sickle Cell Treatment Market Volume (K Unit), by End User 2024 & 2032
- Figure 53: Asia Pacific Sickle Cell Treatment Market Revenue Share (%), by End User 2024 & 2032
- Figure 54: Asia Pacific Sickle Cell Treatment Market Volume Share (%), by End User 2024 & 2032
- Figure 55: Asia Pacific Sickle Cell Treatment Market Revenue (Million), by Country 2024 & 2032
- Figure 56: Asia Pacific Sickle Cell Treatment Market Volume (K Unit), by Country 2024 & 2032
- Figure 57: Asia Pacific Sickle Cell Treatment Market Revenue Share (%), by Country 2024 & 2032
- Figure 58: Asia Pacific Sickle Cell Treatment Market Volume Share (%), by Country 2024 & 2032
- Figure 59: Middle East and Africa Sickle Cell Treatment Market Revenue (Million), by Treatment Modality 2024 & 2032
- Figure 60: Middle East and Africa Sickle Cell Treatment Market Volume (K Unit), by Treatment Modality 2024 & 2032
- Figure 61: Middle East and Africa Sickle Cell Treatment Market Revenue Share (%), by Treatment Modality 2024 & 2032
- Figure 62: Middle East and Africa Sickle Cell Treatment Market Volume Share (%), by Treatment Modality 2024 & 2032
- Figure 63: Middle East and Africa Sickle Cell Treatment Market Revenue (Million), by End User 2024 & 2032
- Figure 64: Middle East and Africa Sickle Cell Treatment Market Volume (K Unit), by End User 2024 & 2032
- Figure 65: Middle East and Africa Sickle Cell Treatment Market Revenue Share (%), by End User 2024 & 2032
- Figure 66: Middle East and Africa Sickle Cell Treatment Market Volume Share (%), by End User 2024 & 2032
- Figure 67: Middle East and Africa Sickle Cell Treatment Market Revenue (Million), by Country 2024 & 2032
- Figure 68: Middle East and Africa Sickle Cell Treatment Market Volume (K Unit), by Country 2024 & 2032
- Figure 69: Middle East and Africa Sickle Cell Treatment Market Revenue Share (%), by Country 2024 & 2032
- Figure 70: Middle East and Africa Sickle Cell Treatment Market Volume Share (%), by Country 2024 & 2032
- Figure 71: South America Sickle Cell Treatment Market Revenue (Million), by Treatment Modality 2024 & 2032
- Figure 72: South America Sickle Cell Treatment Market Volume (K Unit), by Treatment Modality 2024 & 2032
- Figure 73: South America Sickle Cell Treatment Market Revenue Share (%), by Treatment Modality 2024 & 2032
- Figure 74: South America Sickle Cell Treatment Market Volume Share (%), by Treatment Modality 2024 & 2032
- Figure 75: South America Sickle Cell Treatment Market Revenue (Million), by End User 2024 & 2032
- Figure 76: South America Sickle Cell Treatment Market Volume (K Unit), by End User 2024 & 2032
- Figure 77: South America Sickle Cell Treatment Market Revenue Share (%), by End User 2024 & 2032
- Figure 78: South America Sickle Cell Treatment Market Volume Share (%), by End User 2024 & 2032
- Figure 79: South America Sickle Cell Treatment Market Revenue (Million), by Country 2024 & 2032
- Figure 80: South America Sickle Cell Treatment Market Volume (K Unit), by Country 2024 & 2032
- Figure 81: South America Sickle Cell Treatment Market Revenue Share (%), by Country 2024 & 2032
- Figure 82: South America Sickle Cell Treatment Market Volume Share (%), by Country 2024 & 2032
List of Tables
- Table 1: Global Sickle Cell Treatment Market Revenue Million Forecast, by Region 2019 & 2032
- Table 2: Global Sickle Cell Treatment Market Volume K Unit Forecast, by Region 2019 & 2032
- Table 3: Global Sickle Cell Treatment Market Revenue Million Forecast, by Treatment Modality 2019 & 2032
- Table 4: Global Sickle Cell Treatment Market Volume K Unit Forecast, by Treatment Modality 2019 & 2032
- Table 5: Global Sickle Cell Treatment Market Revenue Million Forecast, by End User 2019 & 2032
- Table 6: Global Sickle Cell Treatment Market Volume K Unit Forecast, by End User 2019 & 2032
- Table 7: Global Sickle Cell Treatment Market Revenue Million Forecast, by Region 2019 & 2032
- Table 8: Global Sickle Cell Treatment Market Volume K Unit Forecast, by Region 2019 & 2032
- Table 9: Global Sickle Cell Treatment Market Revenue Million Forecast, by Country 2019 & 2032
- Table 10: Global Sickle Cell Treatment Market Volume K Unit Forecast, by Country 2019 & 2032
- Table 11: United States Sickle Cell Treatment Market Revenue (Million) Forecast, by Application 2019 & 2032
- Table 12: United States Sickle Cell Treatment Market Volume (K Unit) Forecast, by Application 2019 & 2032
- Table 13: Canada Sickle Cell Treatment Market Revenue (Million) Forecast, by Application 2019 & 2032
- Table 14: Canada Sickle Cell Treatment Market Volume (K Unit) Forecast, by Application 2019 & 2032
- Table 15: Mexico Sickle Cell Treatment Market Revenue (Million) Forecast, by Application 2019 & 2032
- Table 16: Mexico Sickle Cell Treatment Market Volume (K Unit) Forecast, by Application 2019 & 2032
- Table 17: Global Sickle Cell Treatment Market Revenue Million Forecast, by Country 2019 & 2032
- Table 18: Global Sickle Cell Treatment Market Volume K Unit Forecast, by Country 2019 & 2032
- Table 19: Germany Sickle Cell Treatment Market Revenue (Million) Forecast, by Application 2019 & 2032
- Table 20: Germany Sickle Cell Treatment Market Volume (K Unit) Forecast, by Application 2019 & 2032
- Table 21: United Kingdom Sickle Cell Treatment Market Revenue (Million) Forecast, by Application 2019 & 2032
- Table 22: United Kingdom Sickle Cell Treatment Market Volume (K Unit) Forecast, by Application 2019 & 2032
- Table 23: France Sickle Cell Treatment Market Revenue (Million) Forecast, by Application 2019 & 2032
- Table 24: France Sickle Cell Treatment Market Volume (K Unit) Forecast, by Application 2019 & 2032
- Table 25: Italy Sickle Cell Treatment Market Revenue (Million) Forecast, by Application 2019 & 2032
- Table 26: Italy Sickle Cell Treatment Market Volume (K Unit) Forecast, by Application 2019 & 2032
- Table 27: Spain Sickle Cell Treatment Market Revenue (Million) Forecast, by Application 2019 & 2032
- Table 28: Spain Sickle Cell Treatment Market Volume (K Unit) Forecast, by Application 2019 & 2032
- Table 29: Rest of Europe Sickle Cell Treatment Market Revenue (Million) Forecast, by Application 2019 & 2032
- Table 30: Rest of Europe Sickle Cell Treatment Market Volume (K Unit) Forecast, by Application 2019 & 2032
- Table 31: Global Sickle Cell Treatment Market Revenue Million Forecast, by Country 2019 & 2032
- Table 32: Global Sickle Cell Treatment Market Volume K Unit Forecast, by Country 2019 & 2032
- Table 33: China Sickle Cell Treatment Market Revenue (Million) Forecast, by Application 2019 & 2032
- Table 34: China Sickle Cell Treatment Market Volume (K Unit) Forecast, by Application 2019 & 2032
- Table 35: Japan Sickle Cell Treatment Market Revenue (Million) Forecast, by Application 2019 & 2032
- Table 36: Japan Sickle Cell Treatment Market Volume (K Unit) Forecast, by Application 2019 & 2032
- Table 37: India Sickle Cell Treatment Market Revenue (Million) Forecast, by Application 2019 & 2032
- Table 38: India Sickle Cell Treatment Market Volume (K Unit) Forecast, by Application 2019 & 2032
- Table 39: Australia Sickle Cell Treatment Market Revenue (Million) Forecast, by Application 2019 & 2032
- Table 40: Australia Sickle Cell Treatment Market Volume (K Unit) Forecast, by Application 2019 & 2032
- Table 41: South Korea Sickle Cell Treatment Market Revenue (Million) Forecast, by Application 2019 & 2032
- Table 42: South Korea Sickle Cell Treatment Market Volume (K Unit) Forecast, by Application 2019 & 2032
- Table 43: Rest of Asia Pacific Sickle Cell Treatment Market Revenue (Million) Forecast, by Application 2019 & 2032
- Table 44: Rest of Asia Pacific Sickle Cell Treatment Market Volume (K Unit) Forecast, by Application 2019 & 2032
- Table 45: Global Sickle Cell Treatment Market Revenue Million Forecast, by Country 2019 & 2032
- Table 46: Global Sickle Cell Treatment Market Volume K Unit Forecast, by Country 2019 & 2032
- Table 47: GCC Sickle Cell Treatment Market Revenue (Million) Forecast, by Application 2019 & 2032
- Table 48: GCC Sickle Cell Treatment Market Volume (K Unit) Forecast, by Application 2019 & 2032
- Table 49: South Africa Sickle Cell Treatment Market Revenue (Million) Forecast, by Application 2019 & 2032
- Table 50: South Africa Sickle Cell Treatment Market Volume (K Unit) Forecast, by Application 2019 & 2032
- Table 51: Rest of Middle East and Africa Sickle Cell Treatment Market Revenue (Million) Forecast, by Application 2019 & 2032
- Table 52: Rest of Middle East and Africa Sickle Cell Treatment Market Volume (K Unit) Forecast, by Application 2019 & 2032
- Table 53: Global Sickle Cell Treatment Market Revenue Million Forecast, by Country 2019 & 2032
- Table 54: Global Sickle Cell Treatment Market Volume K Unit Forecast, by Country 2019 & 2032
- Table 55: Brazil Sickle Cell Treatment Market Revenue (Million) Forecast, by Application 2019 & 2032
- Table 56: Brazil Sickle Cell Treatment Market Volume (K Unit) Forecast, by Application 2019 & 2032
- Table 57: Argentina Sickle Cell Treatment Market Revenue (Million) Forecast, by Application 2019 & 2032
- Table 58: Argentina Sickle Cell Treatment Market Volume (K Unit) Forecast, by Application 2019 & 2032
- Table 59: Rest of South America Sickle Cell Treatment Market Revenue (Million) Forecast, by Application 2019 & 2032
- Table 60: Rest of South America Sickle Cell Treatment Market Volume (K Unit) Forecast, by Application 2019 & 2032
- Table 61: Global Sickle Cell Treatment Market Revenue Million Forecast, by Treatment Modality 2019 & 2032
- Table 62: Global Sickle Cell Treatment Market Volume K Unit Forecast, by Treatment Modality 2019 & 2032
- Table 63: Global Sickle Cell Treatment Market Revenue Million Forecast, by End User 2019 & 2032
- Table 64: Global Sickle Cell Treatment Market Volume K Unit Forecast, by End User 2019 & 2032
- Table 65: Global Sickle Cell Treatment Market Revenue Million Forecast, by Country 2019 & 2032
- Table 66: Global Sickle Cell Treatment Market Volume K Unit Forecast, by Country 2019 & 2032
- Table 67: United States Sickle Cell Treatment Market Revenue (Million) Forecast, by Application 2019 & 2032
- Table 68: United States Sickle Cell Treatment Market Volume (K Unit) Forecast, by Application 2019 & 2032
- Table 69: Canada Sickle Cell Treatment Market Revenue (Million) Forecast, by Application 2019 & 2032
- Table 70: Canada Sickle Cell Treatment Market Volume (K Unit) Forecast, by Application 2019 & 2032
- Table 71: Mexico Sickle Cell Treatment Market Revenue (Million) Forecast, by Application 2019 & 2032
- Table 72: Mexico Sickle Cell Treatment Market Volume (K Unit) Forecast, by Application 2019 & 2032
- Table 73: Global Sickle Cell Treatment Market Revenue Million Forecast, by Treatment Modality 2019 & 2032
- Table 74: Global Sickle Cell Treatment Market Volume K Unit Forecast, by Treatment Modality 2019 & 2032
- Table 75: Global Sickle Cell Treatment Market Revenue Million Forecast, by End User 2019 & 2032
- Table 76: Global Sickle Cell Treatment Market Volume K Unit Forecast, by End User 2019 & 2032
- Table 77: Global Sickle Cell Treatment Market Revenue Million Forecast, by Country 2019 & 2032
- Table 78: Global Sickle Cell Treatment Market Volume K Unit Forecast, by Country 2019 & 2032
- Table 79: Germany Sickle Cell Treatment Market Revenue (Million) Forecast, by Application 2019 & 2032
- Table 80: Germany Sickle Cell Treatment Market Volume (K Unit) Forecast, by Application 2019 & 2032
- Table 81: United Kingdom Sickle Cell Treatment Market Revenue (Million) Forecast, by Application 2019 & 2032
- Table 82: United Kingdom Sickle Cell Treatment Market Volume (K Unit) Forecast, by Application 2019 & 2032
- Table 83: France Sickle Cell Treatment Market Revenue (Million) Forecast, by Application 2019 & 2032
- Table 84: France Sickle Cell Treatment Market Volume (K Unit) Forecast, by Application 2019 & 2032
- Table 85: Italy Sickle Cell Treatment Market Revenue (Million) Forecast, by Application 2019 & 2032
- Table 86: Italy Sickle Cell Treatment Market Volume (K Unit) Forecast, by Application 2019 & 2032
- Table 87: Spain Sickle Cell Treatment Market Revenue (Million) Forecast, by Application 2019 & 2032
- Table 88: Spain Sickle Cell Treatment Market Volume (K Unit) Forecast, by Application 2019 & 2032
- Table 89: Rest of Europe Sickle Cell Treatment Market Revenue (Million) Forecast, by Application 2019 & 2032
- Table 90: Rest of Europe Sickle Cell Treatment Market Volume (K Unit) Forecast, by Application 2019 & 2032
- Table 91: Global Sickle Cell Treatment Market Revenue Million Forecast, by Treatment Modality 2019 & 2032
- Table 92: Global Sickle Cell Treatment Market Volume K Unit Forecast, by Treatment Modality 2019 & 2032
- Table 93: Global Sickle Cell Treatment Market Revenue Million Forecast, by End User 2019 & 2032
- Table 94: Global Sickle Cell Treatment Market Volume K Unit Forecast, by End User 2019 & 2032
- Table 95: Global Sickle Cell Treatment Market Revenue Million Forecast, by Country 2019 & 2032
- Table 96: Global Sickle Cell Treatment Market Volume K Unit Forecast, by Country 2019 & 2032
- Table 97: China Sickle Cell Treatment Market Revenue (Million) Forecast, by Application 2019 & 2032
- Table 98: China Sickle Cell Treatment Market Volume (K Unit) Forecast, by Application 2019 & 2032
- Table 99: Japan Sickle Cell Treatment Market Revenue (Million) Forecast, by Application 2019 & 2032
- Table 100: Japan Sickle Cell Treatment Market Volume (K Unit) Forecast, by Application 2019 & 2032
- Table 101: India Sickle Cell Treatment Market Revenue (Million) Forecast, by Application 2019 & 2032
- Table 102: India Sickle Cell Treatment Market Volume (K Unit) Forecast, by Application 2019 & 2032
- Table 103: Australia Sickle Cell Treatment Market Revenue (Million) Forecast, by Application 2019 & 2032
- Table 104: Australia Sickle Cell Treatment Market Volume (K Unit) Forecast, by Application 2019 & 2032
- Table 105: South Korea Sickle Cell Treatment Market Revenue (Million) Forecast, by Application 2019 & 2032
- Table 106: South Korea Sickle Cell Treatment Market Volume (K Unit) Forecast, by Application 2019 & 2032
- Table 107: Rest of Asia Pacific Sickle Cell Treatment Market Revenue (Million) Forecast, by Application 2019 & 2032
- Table 108: Rest of Asia Pacific Sickle Cell Treatment Market Volume (K Unit) Forecast, by Application 2019 & 2032
- Table 109: Global Sickle Cell Treatment Market Revenue Million Forecast, by Treatment Modality 2019 & 2032
- Table 110: Global Sickle Cell Treatment Market Volume K Unit Forecast, by Treatment Modality 2019 & 2032
- Table 111: Global Sickle Cell Treatment Market Revenue Million Forecast, by End User 2019 & 2032
- Table 112: Global Sickle Cell Treatment Market Volume K Unit Forecast, by End User 2019 & 2032
- Table 113: Global Sickle Cell Treatment Market Revenue Million Forecast, by Country 2019 & 2032
- Table 114: Global Sickle Cell Treatment Market Volume K Unit Forecast, by Country 2019 & 2032
- Table 115: GCC Sickle Cell Treatment Market Revenue (Million) Forecast, by Application 2019 & 2032
- Table 116: GCC Sickle Cell Treatment Market Volume (K Unit) Forecast, by Application 2019 & 2032
- Table 117: South Africa Sickle Cell Treatment Market Revenue (Million) Forecast, by Application 2019 & 2032
- Table 118: South Africa Sickle Cell Treatment Market Volume (K Unit) Forecast, by Application 2019 & 2032
- Table 119: Rest of Middle East and Africa Sickle Cell Treatment Market Revenue (Million) Forecast, by Application 2019 & 2032
- Table 120: Rest of Middle East and Africa Sickle Cell Treatment Market Volume (K Unit) Forecast, by Application 2019 & 2032
- Table 121: Global Sickle Cell Treatment Market Revenue Million Forecast, by Treatment Modality 2019 & 2032
- Table 122: Global Sickle Cell Treatment Market Volume K Unit Forecast, by Treatment Modality 2019 & 2032
- Table 123: Global Sickle Cell Treatment Market Revenue Million Forecast, by End User 2019 & 2032
- Table 124: Global Sickle Cell Treatment Market Volume K Unit Forecast, by End User 2019 & 2032
- Table 125: Global Sickle Cell Treatment Market Revenue Million Forecast, by Country 2019 & 2032
- Table 126: Global Sickle Cell Treatment Market Volume K Unit Forecast, by Country 2019 & 2032
- Table 127: Brazil Sickle Cell Treatment Market Revenue (Million) Forecast, by Application 2019 & 2032
- Table 128: Brazil Sickle Cell Treatment Market Volume (K Unit) Forecast, by Application 2019 & 2032
- Table 129: Argentina Sickle Cell Treatment Market Revenue (Million) Forecast, by Application 2019 & 2032
- Table 130: Argentina Sickle Cell Treatment Market Volume (K Unit) Forecast, by Application 2019 & 2032
- Table 131: Rest of South America Sickle Cell Treatment Market Revenue (Million) Forecast, by Application 2019 & 2032
- Table 132: Rest of South America Sickle Cell Treatment Market Volume (K Unit) Forecast, by Application 2019 & 2032
Frequently Asked Questions
1. What is the projected Compound Annual Growth Rate (CAGR) of the Sickle Cell Treatment Market?
The projected CAGR is approximately 12.98%.
2. Which companies are prominent players in the Sickle Cell Treatment Market?
Key companies in the market include Sanofi SA, CRISPR Therapeutic, Bluebird Biotechnology, Bristol Myers Squibb Co, Novartis AG, Medunik USA, Addmedica, Glycomimetics Inc, Aruvant Sciences Inc, Emmaus Medical Inc, Global Blood Therapeutics Inc, Editas Medicine Inc, Pfizer Inc.
3. What are the main segments of the Sickle Cell Treatment Market?
The market segments include Treatment Modality, End User.
4. Can you provide details about the market size?
The market size is estimated to be USD 3.32 Million as of 2022.
5. What are some drivers contributing to market growth?
Increasing Prevalence of Sickle Cell Disease; Increasing R&D Activity.
6. What are the notable trends driving market growth?
Blood Transfusion Segment is Expected to Witness Significant Growth Over the Forecast Period.
7. Are there any restraints impacting market growth?
High Cost of Treatment.
8. Can you provide examples of recent developments in the market?
In December 2022, Bluebird Bio Inc. announced that the US FDA had lifted a partial clinical hold on studies for its gene therapy to treat the blood disorder sickle cell disease.
9. What pricing options are available for accessing the report?
Pricing options include single-user, multi-user, and enterprise licenses priced at USD 4750, USD 5250, and USD 8750 respectively.
10. Is the market size provided in terms of value or volume?
The market size is provided in terms of value, measured in Million and volume, measured in K Unit.
11. Are there any specific market keywords associated with the report?
Yes, the market keyword associated with the report is "Sickle Cell Treatment Market," which aids in identifying and referencing the specific market segment covered.
12. How do I determine which pricing option suits my needs best?
The pricing options vary based on user requirements and access needs. Individual users may opt for single-user licenses, while businesses requiring broader access may choose multi-user or enterprise licenses for cost-effective access to the report.
13. Are there any additional resources or data provided in the Sickle Cell Treatment Market report?
While the report offers comprehensive insights, it's advisable to review the specific contents or supplementary materials provided to ascertain if additional resources or data are available.
14. How can I stay updated on further developments or reports in the Sickle Cell Treatment Market?
To stay informed about further developments, trends, and reports in the Sickle Cell Treatment Market, consider subscribing to industry newsletters, following relevant companies and organizations, or regularly checking reputable industry news sources and publications.
Methodology
Step 1 - Identification of Relevant Samples Size from Population Database


Step 2 - Approaches for Defining Global Market Size (Value, Volume* & Price*)

Note*: In applicable scenarios
Step 3 - Data Sources
Primary Research
- Web Analytics
- Survey Reports
- Research Institute
- Latest Research Reports
- Opinion Leaders
Secondary Research
- Annual Reports
- White Paper
- Latest Press Release
- Industry Association
- Paid Database
- Investor Presentations

Step 4 - Data Triangulation
Involves using different sources of information in order to increase the validity of a study
These sources are likely to be stakeholders in a program - participants, other researchers, program staff, other community members, and so on.
Then we put all data in single framework & apply various statistical tools to find out the dynamic on the market.
During the analysis stage, feedback from the stakeholder groups would be compared to determine areas of agreement as well as areas of divergence


