

Key Insights
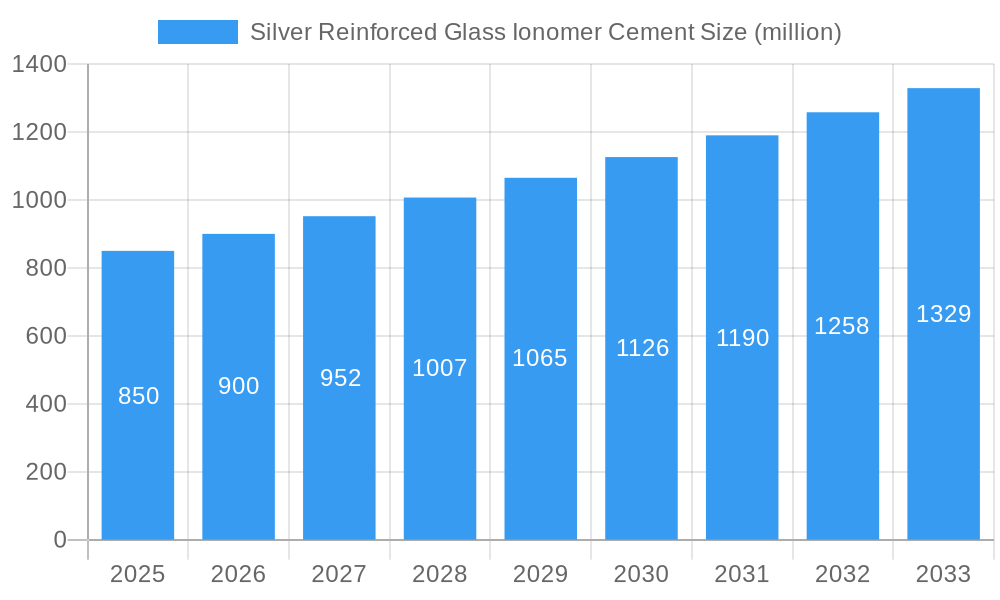
The global Silver Reinforced Glass Ionomer Cement market is experiencing robust growth, projected to reach an estimated USD 850 million by 2025, with a Compound Annual Growth Rate (CAGR) of approximately 5.8% during the forecast period of 2025-2033. This expansion is primarily driven by the increasing prevalence of dental caries and the growing demand for restorative dental materials that offer both aesthetic appeal and functional durability. Silver-reinforced glass ionomer cements, known for their fluoride release, anti-caries properties, and adhesive capabilities, are becoming the material of choice for various dental applications, including fillings, luting agents, and liners, particularly in pediatric dentistry and for patients with a high risk of decay. The market's upward trajectory is further supported by technological advancements in formulation, leading to improved handling properties, enhanced aesthetics, and prolonged clinical performance, thereby solidifying their position in the dental restorative landscape.
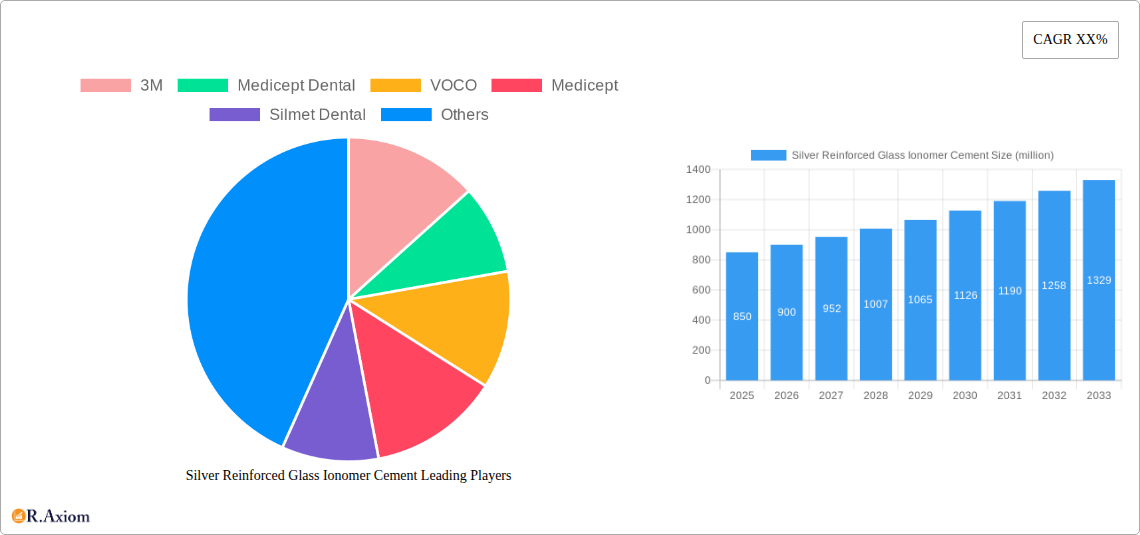
Silver Reinforced Glass Ionomer Cement Market Size (In Million)
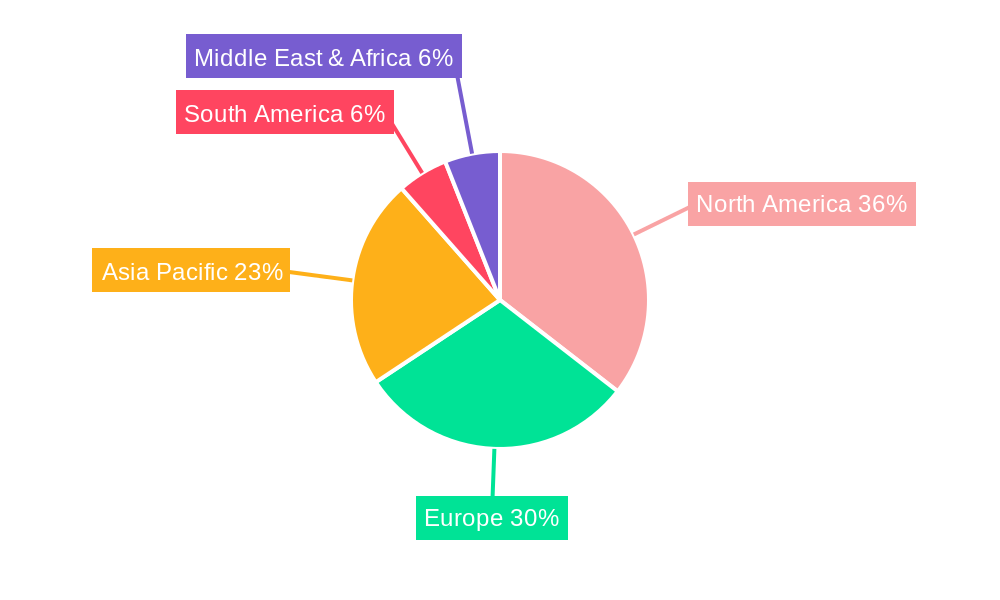
The market's growth is further propelled by a strong emphasis on preventive and restorative dentistry worldwide, coupled with an expanding healthcare infrastructure, especially in emerging economies. Factors like an aging global population, which often leads to an increased incidence of dental issues, and greater patient awareness regarding oral hygiene are also contributing significantly. Key market restraints, such as the availability of alternative restorative materials like composite resins and the relatively higher cost of some advanced silver-reinforced glass ionomer formulations, are being addressed through ongoing research and development focused on cost-effectiveness and superior performance. Geographically, North America and Europe currently dominate the market due to advanced healthcare systems and high disposable incomes. However, the Asia Pacific region is poised for substantial growth, fueled by increasing dental tourism, improving economic conditions, and a rising demand for quality dental care. The market's segmentation into light cure and self-cure types, and applications across hospitals, clinics, and other dental settings, reflects the diverse clinical needs being met by these versatile materials.
Silver Reinforced Glass Ionomer Cement Company Market Share
Silver Reinforced Glass Ionomer Cement Market Concentration & Innovation
The Silver Reinforced Glass Ionomer Cement market exhibits a moderate concentration, with key players such as 3M, Medicept Dental, VOCO, Medicept, Silmet Dental, PYRAX, and SHOFU Inc. driving innovation and market share. The estimated market share of leading companies is projected to be over 50 million USD by 2025. Innovation in this sector is primarily fueled by the demand for enhanced mechanical properties, improved esthetics, and simplified clinical application. Key innovation drivers include the development of novel silver-based formulations for improved antibacterial efficacy and longevity, as well as advancements in resin-modified glass ionomer cements (RMGICs) offering better adhesion and wear resistance. Regulatory frameworks, including stringent quality control standards for dental materials and biocompatibility testing, play a crucial role in shaping product development and market entry, with compliance costing millions in research and development. While direct product substitutes are limited, advancements in composite resins and other adhesive restorative materials present indirect competition, estimated to capture a market share of approximately 30 million USD by 2025. End-user trends are leaning towards minimally invasive dentistry, demanding materials with excellent bonding capabilities and fluoride release for caries prevention. Mergers and acquisitions (M&A) activities, while not a dominant feature, have occurred with deal values potentially reaching tens of millions of USD, consolidating market presence and technological expertise. The overall M&A landscape in the broader dental materials sector indicates a trend towards strategic partnerships to enhance product portfolios and expand global reach.
Silver Reinforced Glass Ionomer Cement Industry Trends & Insights
The Silver Reinforced Glass Ionomer Cement (SRGIC) industry is poised for significant growth, driven by a confluence of technological advancements, increasing dental awareness, and the inherent benefits of these restorative materials. The market is projected to experience a Compound Annual Growth Rate (CAGR) of approximately 6.5% from 2025 to 2033. This robust growth is underpinned by the escalating prevalence of dental caries globally, necessitating effective and affordable restorative solutions. SRGICs offer a unique combination of properties, including fluoride release, chemical adhesion to tooth structure, and antibacterial action attributed to the silver component, making them a preferred choice for various dental applications, particularly in pediatric dentistry and as luting cements.
Technological disruptions are continuously reshaping the SRGIC landscape. Researchers and manufacturers are focused on developing formulations with improved mechanical strength, reduced setting times, and enhanced esthetic qualities to meet the evolving demands of clinicians and patients. The advent of nano-particle technology is leading to the creation of SRGICs with superior wear resistance and smoother surfaces, reducing plaque accumulation and improving patient comfort. Furthermore, the integration of light-curing capabilities in some SRGICs provides dentists with greater control over setting times and initial strength, leading to more predictable clinical outcomes. The market penetration of SRGICs, while significant in certain regions and applications, still holds substantial room for expansion, especially in developing economies where access to advanced dental care is growing.
Consumer preferences are increasingly shifting towards biocompatible and long-lasting dental materials. The fluoride-releasing property of SRGICs is a major draw, contributing to secondary caries prevention, a critical concern for long-term dental health. Patients are also seeking less invasive treatment options, and SRGICs, with their adhesive properties and minimal preparation requirements, align well with this trend. The competitive dynamics within the SRGIC market are characterized by intense innovation and strategic marketing efforts by established players. Companies are investing heavily in research and development to introduce next-generation products that offer improved handling characteristics, reduced sensitivity, and broader clinical applicability. The global market size for SRGIC is projected to reach over 800 million USD by 2025, with significant contributions from both established and emerging markets. The continuous refinement of existing products and the introduction of novel formulations are key strategies employed by market leaders to maintain and expand their market share. The emphasis on cost-effectiveness also plays a crucial role, as SRGICs often present a more economical restorative option compared to some composite resin systems, making them accessible to a wider patient demographic.
Dominant Markets & Segments in Silver Reinforced Glass Ionomer Cement
The Silver Reinforced Glass Ionomer Cement (SRGIC) market demonstrates varied dominance across different regions and application segments, with specific types of SRGICs catering to distinct clinical needs. Asia Pacific is emerging as a dominant region, driven by a burgeoning population, increasing disposable incomes, and a growing awareness of oral hygiene and advanced dental care. Economic policies favoring healthcare infrastructure development and increased government spending on public health initiatives are significant drivers in this region, contributing to an estimated market share exceeding 200 million USD by 2025. The expanding dental tourism industry also fuels demand for high-quality restorative materials.
Within the application segment, Clinics represent the most dominant market. This is primarily due to the high volume of routine restorative procedures performed in dental practices. The ease of use, cost-effectiveness, and beneficial properties of SRGICs, such as fluoride release for caries prevention, make them an indispensable material for filling cavities, particularly in primary teeth and non-load-bearing areas. The market share attributed to clinics is projected to be over 350 million USD by 2025.
- Key Drivers for Clinic Dominance:
- High Procedure Volume: Clinics handle the majority of daily restorative dental procedures.
- Cost-Effectiveness: SRGICs offer an economical solution for both practitioners and patients.
- Fluoride Release: Essential for caries prevention, a common concern in routine dental care.
- Ease of Use: Simplifies chairside application, reducing chair time.
Hospitals, while a significant segment, represent a smaller portion of the SRGIC market compared to clinics, estimated at over 150 million USD by 2025. Hospital dental departments often deal with more complex cases, trauma, and post-surgical restorations, where SRGICs might be used for temporary restorations or in conjunction with other materials. However, the sheer volume of routine restorative work leans heavily towards specialized dental clinics.
- Key Drivers for Hospital Segment:
- Complex Restorations: Used in specialized dental settings within hospitals.
- Post-Surgical Applications: Useful for provisional restorations after oral surgeries.
- Specialized Pediatric Care: Hospitals with dedicated pediatric dental units utilize SRGICs for specific treatments.
The Others segment, which includes research institutions and specialized dental laboratories, contributes a smaller but crucial share, estimated at over 50 million USD by 2025. These entities utilize SRGICs for research purposes, material testing, and the development of new formulations.
In terms of types, Self-Cure SRGICs have historically dominated, offering simplicity and reliability for everyday use. Their ability to set without a light source makes them ideal for deep cavities or situations where light curing is challenging. The self-cure segment is estimated to capture a market share of over 400 million USD by 2025.
- Key Drivers for Self-Cure Dominance:
- Ease of Application: No need for a light curing unit, simplifying the procedure.
- Versatility: Suitable for a wide range of cavity preparations.
- Cost-Effectiveness: Generally less expensive than light-cure alternatives.
Light-Cure SRGICs are gaining traction due to enhanced control over setting times and initial strength, leading to improved clinical outcomes and esthetics. Their market share is growing steadily, projected to reach over 250 million USD by 2025.
- Key Drivers for Light-Cure Growth:
- Controlled Setting Time: Allows for precise placement and manipulation.
- Improved Mechanical Properties: Enhanced strength and wear resistance.
- Better Esthetics: Can be more shade-matched for anterior restorations.
- Reduced Shrinkage: Leads to better marginal integrity.
The interplay of these factors – regional economic development, application-specific demands, and the evolving preferences for curing mechanisms – will continue to shape the dominance and growth trajectory of the Silver Reinforced Glass Ionomer Cement market.
Silver Reinforced Glass Ionomer Cement Product Developments
Product developments in Silver Reinforced Glass Ionomer Cement (SRGIC) are focused on enhancing mechanical properties, improving handling characteristics, and expanding clinical applications. Innovations include formulations with nano-particle silver for superior antibacterial efficacy and reduced particle size, leading to smoother surfaces and improved wear resistance. Manufacturers are also developing advanced resin-modified glass ionomer cements (RMGICs) that combine the benefits of traditional glass ionomers with the enhanced strength and esthetics of resin composites. These advancements lead to improved marginal integrity, reduced postoperative sensitivity, and better longevity of restorations, offering competitive advantages through superior performance and patient satisfaction.
Report Scope & Segmentation Analysis
This report provides a comprehensive analysis of the Silver Reinforced Glass Ionomer Cement market, covering its global landscape, key trends, and future outlook. The segmentation analysis delves into specific market bifurcations to understand their individual growth trajectories and market dynamics.
Application:
- Hospitals: This segment encompasses dental services provided within hospital settings, often involving more complex restorative needs and trauma cases. The market size for this segment is projected to reach over 150 million USD by 2025, with a moderate CAGR.
- Clinics: This is the largest segment, representing routine restorative dentistry performed in dental practices. Expected to reach over 350 million USD by 2025, this segment is driven by high procedure volumes and the cost-effectiveness of SRGICs.
- Others: This includes research institutions, dental laboratories, and educational facilities. While smaller in market size, estimated at over 50 million USD by 2025, it plays a vital role in material innovation and advanced applications.
Types:
- Light Cure: These SRGICs require a light curing unit for polymerization, offering controlled setting times and enhanced properties. The market for light-cure SRGICs is projected to grow significantly, reaching over 250 million USD by 2025.
- Self Cure: These SRGICs set through a chemical reaction, offering ease of use and versatility. This remains the dominant type, with a market size estimated at over 400 million USD by 2025, driven by their widespread adoption in everyday dental practice.
Key Drivers of Silver Reinforced Glass Ionomer Cement Growth
The growth of the Silver Reinforced Glass Ionomer Cement (SRGIC) market is propelled by several key factors. Technologically, the ongoing development of formulations with enhanced mechanical strength, improved antibacterial properties due to silver incorporation, and better esthetics is a significant driver. The fluoride-releasing capability of SRGICs plays a crucial role in caries prevention, aligning with the global focus on preventive dentistry and oral health. Economically, the cost-effectiveness of SRGICs compared to alternative restorative materials makes them accessible to a broader patient base, particularly in emerging economies with a growing demand for affordable dental care. Regulatory bodies are also increasingly emphasizing material safety and efficacy, indirectly promoting the adoption of well-established and clinically proven materials like SRGICs. The rising prevalence of dental caries worldwide further bolsters the demand for reliable and effective restorative solutions.
Challenges in the Silver Reinforced Glass Ionomer Cement Sector
Despite its promising growth, the Silver Reinforced Glass Ionomer Cement sector faces certain challenges. Regulatory hurdles, including stringent approval processes for new formulations and the need for extensive biocompatibility testing, can slow down innovation and market entry, with associated compliance costs running into millions. Supply chain disruptions for raw materials, particularly those related to silver and specific polymers, can impact production volumes and pricing stability. Competitive pressures from advanced composite resins and other restorative materials, which offer superior esthetics and mechanical properties in some applications, pose a constant challenge. Furthermore, a lack of widespread awareness or perceived limitations regarding the esthetics and handling of traditional glass ionomers in certain patient demographics can restrain market penetration. The need for continuous clinical education to ensure optimal use of SRGICs also presents an ongoing challenge.
Emerging Opportunities in Silver Reinforced Glass Ionomer Cement
Emerging opportunities in the Silver Reinforced Glass Ionomer Cement market are largely driven by technological advancements and evolving patient needs. The development of novel nano-hybrid SRGICs with significantly improved esthetics and wear resistance opens doors for their use in more anterior applications, expanding their market appeal beyond traditional posterior uses. The growing demand for minimally invasive dentistry presents a significant opportunity, as SRGICs' adhesive properties require less tooth structure removal. Furthermore, the increasing focus on antimicrobial materials in healthcare, coupled with the inherent antibacterial properties of silver, creates a niche for SRGICs in infection control within dental settings. The expansion of dental healthcare infrastructure in developing nations and the growing affordability of dental treatments in these regions represent untapped market potential. Collaborations between manufacturers and research institutions to develop next-generation SRGICs with enhanced functionalities, such as improved radiopacity and faster setting times, will also create new avenues for growth.
Leading Players in the Silver Reinforced Glass Ionomer Cement Market
- 3M
- Medicept Dental
- VOCO
- Medicept
- Silmet Dental
- PYRAX
- SHOFU Inc.
Key Developments in Silver Reinforced Glass Ionomer Cement Industry
- 2023: Introduction of next-generation nano-hybrid SRGIC formulations with enhanced wear resistance and esthetics.
- 2022: Launch of a new light-cure SRGIC offering improved handling and reduced sensitivity for pediatric applications.
- 2021: Strategic partnerships formed to expand the distribution of advanced SRGIC products in emerging markets.
- 2020: Significant investment in R&D for bio-active glass ionomer cements incorporating silver nanoparticles.
- 2019: Release of updated guidelines for the clinical application of SRGICs in minimally invasive dentistry.
Strategic Outlook for Silver Reinforced Glass Ionomer Cement Market
The strategic outlook for the Silver Reinforced Glass Ionomer Cement market is overwhelmingly positive, driven by continued innovation and an increasing demand for effective, affordable, and preventive dental solutions. The focus on developing advanced formulations with superior mechanical properties, enhanced antibacterial efficacy, and improved esthetics will be crucial for capturing market share. Leveraging the inherent fluoride-releasing benefits for caries prevention will align with global health trends. Expansion into underserved emerging markets, where cost-effectiveness is a primary consideration, presents a significant growth catalyst. Furthermore, strategic collaborations and partnerships will enable companies to broaden their product portfolios and geographical reach. The growing emphasis on minimally invasive dental procedures further solidifies the relevance of SRGICs, positioning the market for sustained growth and increased penetration in the coming years.
Silver Reinforced Glass Ionomer Cement Segmentation
-
1. Application
- 1.1. Hospitals
- 1.2. Clinics
- 1.3. Others
-
2. Types
- 2.1. Light Cure
- 2.2. Self Cure
Silver Reinforced Glass Ionomer Cement Segmentation By Geography
-
1. North America
- 1.1. United States
- 1.2. Canada
- 1.3. Mexico
-
2. South America
- 2.1. Brazil
- 2.2. Argentina
- 2.3. Rest of South America
-
3. Europe
- 3.1. United Kingdom
- 3.2. Germany
- 3.3. France
- 3.4. Italy
- 3.5. Spain
- 3.6. Russia
- 3.7. Benelux
- 3.8. Nordics
- 3.9. Rest of Europe
-
4. Middle East & Africa
- 4.1. Turkey
- 4.2. Israel
- 4.3. GCC
- 4.4. North Africa
- 4.5. South Africa
- 4.6. Rest of Middle East & Africa
-
5. Asia Pacific
- 5.1. China
- 5.2. India
- 5.3. Japan
- 5.4. South Korea
- 5.5. ASEAN
- 5.6. Oceania
- 5.7. Rest of Asia Pacific
Silver Reinforced Glass Ionomer Cement Regional Market Share
Geographic Coverage of Silver Reinforced Glass Ionomer Cement
Silver Reinforced Glass Ionomer Cement REPORT HIGHLIGHTS
| Aspects | Details |
|---|---|
| Study Period | 2020-2034 |
| Base Year | 2025 |
| Estimated Year | 2026 |
| Forecast Period | 2026-2034 |
| Historical Period | 2020-2025 |
| Growth Rate | CAGR of 7.8% from 2020-2034 |
| Segmentation |
|
Table of Contents
- 1. Introduction
- 1.1. Research Scope
- 1.2. Market Segmentation
- 1.3. Research Objective
- 1.4. Definitions and Assumptions
- 2. Executive Summary
- 2.1. Market Snapshot
- 3. Market Dynamics
- 3.1. Market Drivers
- 3.2. Market Restrains
- 3.3. Market Trends
- 3.4. Market Opportunities
- 4. Market Factor Analysis
- 4.1. Porters Five Forces
- 4.1.1. Bargaining Power of Suppliers
- 4.1.2. Bargaining Power of Buyers
- 4.1.3. Threat of New Entrants
- 4.1.4. Threat of Substitutes
- 4.1.5. Competitive Rivalry
- 4.2. PESTEL analysis
- 4.3. BCG Analysis
- 4.3.1. Stars (High Growth, High Market Share)
- 4.3.2. Cash Cows (Low Growth, High Market Share)
- 4.3.3. Question Mark (High Growth, Low Market Share)
- 4.3.4. Dogs (Low Growth, Low Market Share)
- 4.4. Ansoff Matrix Analysis
- 4.5. Supply Chain Analysis
- 4.6. Regulatory Landscape
- 4.7. Current Market Potential and Opportunity Assessment (TAM–SAM–SOM Framework)
- 4.8. RAX Analyst Note
- 4.1. Porters Five Forces
- 5. Market Analysis, Insights and Forecast 2021-2033
- 5.1. Market Analysis, Insights and Forecast - by Application
- 5.1.1. Hospitals
- 5.1.2. Clinics
- 5.1.3. Others
- 5.2. Market Analysis, Insights and Forecast - by Types
- 5.2.1. Light Cure
- 5.2.2. Self Cure
- 5.3. Market Analysis, Insights and Forecast - by Region
- 5.3.1. North America
- 5.3.2. South America
- 5.3.3. Europe
- 5.3.4. Middle East & Africa
- 5.3.5. Asia Pacific
- 5.1. Market Analysis, Insights and Forecast - by Application
- 6. Global Silver Reinforced Glass Ionomer Cement Analysis, Insights and Forecast, 2021-2033
- 6.1. Market Analysis, Insights and Forecast - by Application
- 6.1.1. Hospitals
- 6.1.2. Clinics
- 6.1.3. Others
- 6.2. Market Analysis, Insights and Forecast - by Types
- 6.2.1. Light Cure
- 6.2.2. Self Cure
- 6.1. Market Analysis, Insights and Forecast - by Application
- 7. North America Silver Reinforced Glass Ionomer Cement Analysis, Insights and Forecast, 2020-2032
- 7.1. Market Analysis, Insights and Forecast - by Application
- 7.1.1. Hospitals
- 7.1.2. Clinics
- 7.1.3. Others
- 7.2. Market Analysis, Insights and Forecast - by Types
- 7.2.1. Light Cure
- 7.2.2. Self Cure
- 7.1. Market Analysis, Insights and Forecast - by Application
- 8. South America Silver Reinforced Glass Ionomer Cement Analysis, Insights and Forecast, 2020-2032
- 8.1. Market Analysis, Insights and Forecast - by Application
- 8.1.1. Hospitals
- 8.1.2. Clinics
- 8.1.3. Others
- 8.2. Market Analysis, Insights and Forecast - by Types
- 8.2.1. Light Cure
- 8.2.2. Self Cure
- 8.1. Market Analysis, Insights and Forecast - by Application
- 9. Europe Silver Reinforced Glass Ionomer Cement Analysis, Insights and Forecast, 2020-2032
- 9.1. Market Analysis, Insights and Forecast - by Application
- 9.1.1. Hospitals
- 9.1.2. Clinics
- 9.1.3. Others
- 9.2. Market Analysis, Insights and Forecast - by Types
- 9.2.1. Light Cure
- 9.2.2. Self Cure
- 9.1. Market Analysis, Insights and Forecast - by Application
- 10. Middle East & Africa Silver Reinforced Glass Ionomer Cement Analysis, Insights and Forecast, 2020-2032
- 10.1. Market Analysis, Insights and Forecast - by Application
- 10.1.1. Hospitals
- 10.1.2. Clinics
- 10.1.3. Others
- 10.2. Market Analysis, Insights and Forecast - by Types
- 10.2.1. Light Cure
- 10.2.2. Self Cure
- 10.1. Market Analysis, Insights and Forecast - by Application
- 11. Asia Pacific Silver Reinforced Glass Ionomer Cement Analysis, Insights and Forecast, 2020-2032
- 11.1. Market Analysis, Insights and Forecast - by Application
- 11.1.1. Hospitals
- 11.1.2. Clinics
- 11.1.3. Others
- 11.2. Market Analysis, Insights and Forecast - by Types
- 11.2.1. Light Cure
- 11.2.2. Self Cure
- 11.1. Market Analysis, Insights and Forecast - by Application
- 12. Competitive Analysis
- 12.1. Company Profiles
- 12.1.1 3M
- 12.1.1.1. Company Overview
- 12.1.1.2. Products
- 12.1.1.3. Company Financials
- 12.1.1.4. SWOT Analysis
- 12.1.2 Medicept Dental
- 12.1.2.1. Company Overview
- 12.1.2.2. Products
- 12.1.2.3. Company Financials
- 12.1.2.4. SWOT Analysis
- 12.1.3 VOCO
- 12.1.3.1. Company Overview
- 12.1.3.2. Products
- 12.1.3.3. Company Financials
- 12.1.3.4. SWOT Analysis
- 12.1.4 Medicept
- 12.1.4.1. Company Overview
- 12.1.4.2. Products
- 12.1.4.3. Company Financials
- 12.1.4.4. SWOT Analysis
- 12.1.5 Silmet Dental
- 12.1.5.1. Company Overview
- 12.1.5.2. Products
- 12.1.5.3. Company Financials
- 12.1.5.4. SWOT Analysis
- 12.1.6 PYRAX
- 12.1.6.1. Company Overview
- 12.1.6.2. Products
- 12.1.6.3. Company Financials
- 12.1.6.4. SWOT Analysis
- 12.1.7 SHOFU Inc.
- 12.1.7.1. Company Overview
- 12.1.7.2. Products
- 12.1.7.3. Company Financials
- 12.1.7.4. SWOT Analysis
- 12.1.1 3M
- 12.2. Market Entropy
- 12.2.1 Company's Key Areas Served
- 12.2.2 Recent Developments
- 12.3. Company Market Share Analysis 2025
- 12.3.1 Top 5 Companies Market Share Analysis
- 12.3.2 Top 3 Companies Market Share Analysis
- 12.4. List of Potential Customers
- 13. Research Methodology
List of Figures
- Figure 1: Global Silver Reinforced Glass Ionomer Cement Revenue Breakdown (undefined, %) by Region 2025 & 2033
- Figure 2: Global Silver Reinforced Glass Ionomer Cement Volume Breakdown (K, %) by Region 2025 & 2033
- Figure 3: North America Silver Reinforced Glass Ionomer Cement Revenue (undefined), by Application 2025 & 2033
- Figure 4: North America Silver Reinforced Glass Ionomer Cement Volume (K), by Application 2025 & 2033
- Figure 5: North America Silver Reinforced Glass Ionomer Cement Revenue Share (%), by Application 2025 & 2033
- Figure 6: North America Silver Reinforced Glass Ionomer Cement Volume Share (%), by Application 2025 & 2033
- Figure 7: North America Silver Reinforced Glass Ionomer Cement Revenue (undefined), by Types 2025 & 2033
- Figure 8: North America Silver Reinforced Glass Ionomer Cement Volume (K), by Types 2025 & 2033
- Figure 9: North America Silver Reinforced Glass Ionomer Cement Revenue Share (%), by Types 2025 & 2033
- Figure 10: North America Silver Reinforced Glass Ionomer Cement Volume Share (%), by Types 2025 & 2033
- Figure 11: North America Silver Reinforced Glass Ionomer Cement Revenue (undefined), by Country 2025 & 2033
- Figure 12: North America Silver Reinforced Glass Ionomer Cement Volume (K), by Country 2025 & 2033
- Figure 13: North America Silver Reinforced Glass Ionomer Cement Revenue Share (%), by Country 2025 & 2033
- Figure 14: North America Silver Reinforced Glass Ionomer Cement Volume Share (%), by Country 2025 & 2033
- Figure 15: South America Silver Reinforced Glass Ionomer Cement Revenue (undefined), by Application 2025 & 2033
- Figure 16: South America Silver Reinforced Glass Ionomer Cement Volume (K), by Application 2025 & 2033
- Figure 17: South America Silver Reinforced Glass Ionomer Cement Revenue Share (%), by Application 2025 & 2033
- Figure 18: South America Silver Reinforced Glass Ionomer Cement Volume Share (%), by Application 2025 & 2033
- Figure 19: South America Silver Reinforced Glass Ionomer Cement Revenue (undefined), by Types 2025 & 2033
- Figure 20: South America Silver Reinforced Glass Ionomer Cement Volume (K), by Types 2025 & 2033
- Figure 21: South America Silver Reinforced Glass Ionomer Cement Revenue Share (%), by Types 2025 & 2033
- Figure 22: South America Silver Reinforced Glass Ionomer Cement Volume Share (%), by Types 2025 & 2033
- Figure 23: South America Silver Reinforced Glass Ionomer Cement Revenue (undefined), by Country 2025 & 2033
- Figure 24: South America Silver Reinforced Glass Ionomer Cement Volume (K), by Country 2025 & 2033
- Figure 25: South America Silver Reinforced Glass Ionomer Cement Revenue Share (%), by Country 2025 & 2033
- Figure 26: South America Silver Reinforced Glass Ionomer Cement Volume Share (%), by Country 2025 & 2033
- Figure 27: Europe Silver Reinforced Glass Ionomer Cement Revenue (undefined), by Application 2025 & 2033
- Figure 28: Europe Silver Reinforced Glass Ionomer Cement Volume (K), by Application 2025 & 2033
- Figure 29: Europe Silver Reinforced Glass Ionomer Cement Revenue Share (%), by Application 2025 & 2033
- Figure 30: Europe Silver Reinforced Glass Ionomer Cement Volume Share (%), by Application 2025 & 2033
- Figure 31: Europe Silver Reinforced Glass Ionomer Cement Revenue (undefined), by Types 2025 & 2033
- Figure 32: Europe Silver Reinforced Glass Ionomer Cement Volume (K), by Types 2025 & 2033
- Figure 33: Europe Silver Reinforced Glass Ionomer Cement Revenue Share (%), by Types 2025 & 2033
- Figure 34: Europe Silver Reinforced Glass Ionomer Cement Volume Share (%), by Types 2025 & 2033
- Figure 35: Europe Silver Reinforced Glass Ionomer Cement Revenue (undefined), by Country 2025 & 2033
- Figure 36: Europe Silver Reinforced Glass Ionomer Cement Volume (K), by Country 2025 & 2033
- Figure 37: Europe Silver Reinforced Glass Ionomer Cement Revenue Share (%), by Country 2025 & 2033
- Figure 38: Europe Silver Reinforced Glass Ionomer Cement Volume Share (%), by Country 2025 & 2033
- Figure 39: Middle East & Africa Silver Reinforced Glass Ionomer Cement Revenue (undefined), by Application 2025 & 2033
- Figure 40: Middle East & Africa Silver Reinforced Glass Ionomer Cement Volume (K), by Application 2025 & 2033
- Figure 41: Middle East & Africa Silver Reinforced Glass Ionomer Cement Revenue Share (%), by Application 2025 & 2033
- Figure 42: Middle East & Africa Silver Reinforced Glass Ionomer Cement Volume Share (%), by Application 2025 & 2033
- Figure 43: Middle East & Africa Silver Reinforced Glass Ionomer Cement Revenue (undefined), by Types 2025 & 2033
- Figure 44: Middle East & Africa Silver Reinforced Glass Ionomer Cement Volume (K), by Types 2025 & 2033
- Figure 45: Middle East & Africa Silver Reinforced Glass Ionomer Cement Revenue Share (%), by Types 2025 & 2033
- Figure 46: Middle East & Africa Silver Reinforced Glass Ionomer Cement Volume Share (%), by Types 2025 & 2033
- Figure 47: Middle East & Africa Silver Reinforced Glass Ionomer Cement Revenue (undefined), by Country 2025 & 2033
- Figure 48: Middle East & Africa Silver Reinforced Glass Ionomer Cement Volume (K), by Country 2025 & 2033
- Figure 49: Middle East & Africa Silver Reinforced Glass Ionomer Cement Revenue Share (%), by Country 2025 & 2033
- Figure 50: Middle East & Africa Silver Reinforced Glass Ionomer Cement Volume Share (%), by Country 2025 & 2033
- Figure 51: Asia Pacific Silver Reinforced Glass Ionomer Cement Revenue (undefined), by Application 2025 & 2033
- Figure 52: Asia Pacific Silver Reinforced Glass Ionomer Cement Volume (K), by Application 2025 & 2033
- Figure 53: Asia Pacific Silver Reinforced Glass Ionomer Cement Revenue Share (%), by Application 2025 & 2033
- Figure 54: Asia Pacific Silver Reinforced Glass Ionomer Cement Volume Share (%), by Application 2025 & 2033
- Figure 55: Asia Pacific Silver Reinforced Glass Ionomer Cement Revenue (undefined), by Types 2025 & 2033
- Figure 56: Asia Pacific Silver Reinforced Glass Ionomer Cement Volume (K), by Types 2025 & 2033
- Figure 57: Asia Pacific Silver Reinforced Glass Ionomer Cement Revenue Share (%), by Types 2025 & 2033
- Figure 58: Asia Pacific Silver Reinforced Glass Ionomer Cement Volume Share (%), by Types 2025 & 2033
- Figure 59: Asia Pacific Silver Reinforced Glass Ionomer Cement Revenue (undefined), by Country 2025 & 2033
- Figure 60: Asia Pacific Silver Reinforced Glass Ionomer Cement Volume (K), by Country 2025 & 2033
- Figure 61: Asia Pacific Silver Reinforced Glass Ionomer Cement Revenue Share (%), by Country 2025 & 2033
- Figure 62: Asia Pacific Silver Reinforced Glass Ionomer Cement Volume Share (%), by Country 2025 & 2033
List of Tables
- Table 1: Global Silver Reinforced Glass Ionomer Cement Revenue undefined Forecast, by Application 2020 & 2033
- Table 2: Global Silver Reinforced Glass Ionomer Cement Volume K Forecast, by Application 2020 & 2033
- Table 3: Global Silver Reinforced Glass Ionomer Cement Revenue undefined Forecast, by Types 2020 & 2033
- Table 4: Global Silver Reinforced Glass Ionomer Cement Volume K Forecast, by Types 2020 & 2033
- Table 5: Global Silver Reinforced Glass Ionomer Cement Revenue undefined Forecast, by Region 2020 & 2033
- Table 6: Global Silver Reinforced Glass Ionomer Cement Volume K Forecast, by Region 2020 & 2033
- Table 7: Global Silver Reinforced Glass Ionomer Cement Revenue undefined Forecast, by Application 2020 & 2033
- Table 8: Global Silver Reinforced Glass Ionomer Cement Volume K Forecast, by Application 2020 & 2033
- Table 9: Global Silver Reinforced Glass Ionomer Cement Revenue undefined Forecast, by Types 2020 & 2033
- Table 10: Global Silver Reinforced Glass Ionomer Cement Volume K Forecast, by Types 2020 & 2033
- Table 11: Global Silver Reinforced Glass Ionomer Cement Revenue undefined Forecast, by Country 2020 & 2033
- Table 12: Global Silver Reinforced Glass Ionomer Cement Volume K Forecast, by Country 2020 & 2033
- Table 13: United States Silver Reinforced Glass Ionomer Cement Revenue (undefined) Forecast, by Application 2020 & 2033
- Table 14: United States Silver Reinforced Glass Ionomer Cement Volume (K) Forecast, by Application 2020 & 2033
- Table 15: Canada Silver Reinforced Glass Ionomer Cement Revenue (undefined) Forecast, by Application 2020 & 2033
- Table 16: Canada Silver Reinforced Glass Ionomer Cement Volume (K) Forecast, by Application 2020 & 2033
- Table 17: Mexico Silver Reinforced Glass Ionomer Cement Revenue (undefined) Forecast, by Application 2020 & 2033
- Table 18: Mexico Silver Reinforced Glass Ionomer Cement Volume (K) Forecast, by Application 2020 & 2033
- Table 19: Global Silver Reinforced Glass Ionomer Cement Revenue undefined Forecast, by Application 2020 & 2033
- Table 20: Global Silver Reinforced Glass Ionomer Cement Volume K Forecast, by Application 2020 & 2033
- Table 21: Global Silver Reinforced Glass Ionomer Cement Revenue undefined Forecast, by Types 2020 & 2033
- Table 22: Global Silver Reinforced Glass Ionomer Cement Volume K Forecast, by Types 2020 & 2033
- Table 23: Global Silver Reinforced Glass Ionomer Cement Revenue undefined Forecast, by Country 2020 & 2033
- Table 24: Global Silver Reinforced Glass Ionomer Cement Volume K Forecast, by Country 2020 & 2033
- Table 25: Brazil Silver Reinforced Glass Ionomer Cement Revenue (undefined) Forecast, by Application 2020 & 2033
- Table 26: Brazil Silver Reinforced Glass Ionomer Cement Volume (K) Forecast, by Application 2020 & 2033
- Table 27: Argentina Silver Reinforced Glass Ionomer Cement Revenue (undefined) Forecast, by Application 2020 & 2033
- Table 28: Argentina Silver Reinforced Glass Ionomer Cement Volume (K) Forecast, by Application 2020 & 2033
- Table 29: Rest of South America Silver Reinforced Glass Ionomer Cement Revenue (undefined) Forecast, by Application 2020 & 2033
- Table 30: Rest of South America Silver Reinforced Glass Ionomer Cement Volume (K) Forecast, by Application 2020 & 2033
- Table 31: Global Silver Reinforced Glass Ionomer Cement Revenue undefined Forecast, by Application 2020 & 2033
- Table 32: Global Silver Reinforced Glass Ionomer Cement Volume K Forecast, by Application 2020 & 2033
- Table 33: Global Silver Reinforced Glass Ionomer Cement Revenue undefined Forecast, by Types 2020 & 2033
- Table 34: Global Silver Reinforced Glass Ionomer Cement Volume K Forecast, by Types 2020 & 2033
- Table 35: Global Silver Reinforced Glass Ionomer Cement Revenue undefined Forecast, by Country 2020 & 2033
- Table 36: Global Silver Reinforced Glass Ionomer Cement Volume K Forecast, by Country 2020 & 2033
- Table 37: United Kingdom Silver Reinforced Glass Ionomer Cement Revenue (undefined) Forecast, by Application 2020 & 2033
- Table 38: United Kingdom Silver Reinforced Glass Ionomer Cement Volume (K) Forecast, by Application 2020 & 2033
- Table 39: Germany Silver Reinforced Glass Ionomer Cement Revenue (undefined) Forecast, by Application 2020 & 2033
- Table 40: Germany Silver Reinforced Glass Ionomer Cement Volume (K) Forecast, by Application 2020 & 2033
- Table 41: France Silver Reinforced Glass Ionomer Cement Revenue (undefined) Forecast, by Application 2020 & 2033
- Table 42: France Silver Reinforced Glass Ionomer Cement Volume (K) Forecast, by Application 2020 & 2033
- Table 43: Italy Silver Reinforced Glass Ionomer Cement Revenue (undefined) Forecast, by Application 2020 & 2033
- Table 44: Italy Silver Reinforced Glass Ionomer Cement Volume (K) Forecast, by Application 2020 & 2033
- Table 45: Spain Silver Reinforced Glass Ionomer Cement Revenue (undefined) Forecast, by Application 2020 & 2033
- Table 46: Spain Silver Reinforced Glass Ionomer Cement Volume (K) Forecast, by Application 2020 & 2033
- Table 47: Russia Silver Reinforced Glass Ionomer Cement Revenue (undefined) Forecast, by Application 2020 & 2033
- Table 48: Russia Silver Reinforced Glass Ionomer Cement Volume (K) Forecast, by Application 2020 & 2033
- Table 49: Benelux Silver Reinforced Glass Ionomer Cement Revenue (undefined) Forecast, by Application 2020 & 2033
- Table 50: Benelux Silver Reinforced Glass Ionomer Cement Volume (K) Forecast, by Application 2020 & 2033
- Table 51: Nordics Silver Reinforced Glass Ionomer Cement Revenue (undefined) Forecast, by Application 2020 & 2033
- Table 52: Nordics Silver Reinforced Glass Ionomer Cement Volume (K) Forecast, by Application 2020 & 2033
- Table 53: Rest of Europe Silver Reinforced Glass Ionomer Cement Revenue (undefined) Forecast, by Application 2020 & 2033
- Table 54: Rest of Europe Silver Reinforced Glass Ionomer Cement Volume (K) Forecast, by Application 2020 & 2033
- Table 55: Global Silver Reinforced Glass Ionomer Cement Revenue undefined Forecast, by Application 2020 & 2033
- Table 56: Global Silver Reinforced Glass Ionomer Cement Volume K Forecast, by Application 2020 & 2033
- Table 57: Global Silver Reinforced Glass Ionomer Cement Revenue undefined Forecast, by Types 2020 & 2033
- Table 58: Global Silver Reinforced Glass Ionomer Cement Volume K Forecast, by Types 2020 & 2033
- Table 59: Global Silver Reinforced Glass Ionomer Cement Revenue undefined Forecast, by Country 2020 & 2033
- Table 60: Global Silver Reinforced Glass Ionomer Cement Volume K Forecast, by Country 2020 & 2033
- Table 61: Turkey Silver Reinforced Glass Ionomer Cement Revenue (undefined) Forecast, by Application 2020 & 2033
- Table 62: Turkey Silver Reinforced Glass Ionomer Cement Volume (K) Forecast, by Application 2020 & 2033
- Table 63: Israel Silver Reinforced Glass Ionomer Cement Revenue (undefined) Forecast, by Application 2020 & 2033
- Table 64: Israel Silver Reinforced Glass Ionomer Cement Volume (K) Forecast, by Application 2020 & 2033
- Table 65: GCC Silver Reinforced Glass Ionomer Cement Revenue (undefined) Forecast, by Application 2020 & 2033
- Table 66: GCC Silver Reinforced Glass Ionomer Cement Volume (K) Forecast, by Application 2020 & 2033
- Table 67: North Africa Silver Reinforced Glass Ionomer Cement Revenue (undefined) Forecast, by Application 2020 & 2033
- Table 68: North Africa Silver Reinforced Glass Ionomer Cement Volume (K) Forecast, by Application 2020 & 2033
- Table 69: South Africa Silver Reinforced Glass Ionomer Cement Revenue (undefined) Forecast, by Application 2020 & 2033
- Table 70: South Africa Silver Reinforced Glass Ionomer Cement Volume (K) Forecast, by Application 2020 & 2033
- Table 71: Rest of Middle East & Africa Silver Reinforced Glass Ionomer Cement Revenue (undefined) Forecast, by Application 2020 & 2033
- Table 72: Rest of Middle East & Africa Silver Reinforced Glass Ionomer Cement Volume (K) Forecast, by Application 2020 & 2033
- Table 73: Global Silver Reinforced Glass Ionomer Cement Revenue undefined Forecast, by Application 2020 & 2033
- Table 74: Global Silver Reinforced Glass Ionomer Cement Volume K Forecast, by Application 2020 & 2033
- Table 75: Global Silver Reinforced Glass Ionomer Cement Revenue undefined Forecast, by Types 2020 & 2033
- Table 76: Global Silver Reinforced Glass Ionomer Cement Volume K Forecast, by Types 2020 & 2033
- Table 77: Global Silver Reinforced Glass Ionomer Cement Revenue undefined Forecast, by Country 2020 & 2033
- Table 78: Global Silver Reinforced Glass Ionomer Cement Volume K Forecast, by Country 2020 & 2033
- Table 79: China Silver Reinforced Glass Ionomer Cement Revenue (undefined) Forecast, by Application 2020 & 2033
- Table 80: China Silver Reinforced Glass Ionomer Cement Volume (K) Forecast, by Application 2020 & 2033
- Table 81: India Silver Reinforced Glass Ionomer Cement Revenue (undefined) Forecast, by Application 2020 & 2033
- Table 82: India Silver Reinforced Glass Ionomer Cement Volume (K) Forecast, by Application 2020 & 2033
- Table 83: Japan Silver Reinforced Glass Ionomer Cement Revenue (undefined) Forecast, by Application 2020 & 2033
- Table 84: Japan Silver Reinforced Glass Ionomer Cement Volume (K) Forecast, by Application 2020 & 2033
- Table 85: South Korea Silver Reinforced Glass Ionomer Cement Revenue (undefined) Forecast, by Application 2020 & 2033
- Table 86: South Korea Silver Reinforced Glass Ionomer Cement Volume (K) Forecast, by Application 2020 & 2033
- Table 87: ASEAN Silver Reinforced Glass Ionomer Cement Revenue (undefined) Forecast, by Application 2020 & 2033
- Table 88: ASEAN Silver Reinforced Glass Ionomer Cement Volume (K) Forecast, by Application 2020 & 2033
- Table 89: Oceania Silver Reinforced Glass Ionomer Cement Revenue (undefined) Forecast, by Application 2020 & 2033
- Table 90: Oceania Silver Reinforced Glass Ionomer Cement Volume (K) Forecast, by Application 2020 & 2033
- Table 91: Rest of Asia Pacific Silver Reinforced Glass Ionomer Cement Revenue (undefined) Forecast, by Application 2020 & 2033
- Table 92: Rest of Asia Pacific Silver Reinforced Glass Ionomer Cement Volume (K) Forecast, by Application 2020 & 2033
Frequently Asked Questions
1. What is the projected Compound Annual Growth Rate (CAGR) of the Silver Reinforced Glass Ionomer Cement?
The projected CAGR is approximately 7.8%.
2. Which companies are prominent players in the Silver Reinforced Glass Ionomer Cement?
Key companies in the market include 3M, Medicept Dental, VOCO, Medicept, Silmet Dental, PYRAX, SHOFU Inc..
3. What are the main segments of the Silver Reinforced Glass Ionomer Cement?
The market segments include Application, Types.
4. Can you provide details about the market size?
The market size is estimated to be USD XXX N/A as of 2022.
5. What are some drivers contributing to market growth?
N/A
6. What are the notable trends driving market growth?
N/A
7. Are there any restraints impacting market growth?
N/A
8. Can you provide examples of recent developments in the market?
N/A
9. What pricing options are available for accessing the report?
Pricing options include single-user, multi-user, and enterprise licenses priced at USD 3950.00, USD 5925.00, and USD 7900.00 respectively.
10. Is the market size provided in terms of value or volume?
The market size is provided in terms of value, measured in N/A and volume, measured in K.
11. Are there any specific market keywords associated with the report?
Yes, the market keyword associated with the report is "Silver Reinforced Glass Ionomer Cement," which aids in identifying and referencing the specific market segment covered.
12. How do I determine which pricing option suits my needs best?
The pricing options vary based on user requirements and access needs. Individual users may opt for single-user licenses, while businesses requiring broader access may choose multi-user or enterprise licenses for cost-effective access to the report.
13. Are there any additional resources or data provided in the Silver Reinforced Glass Ionomer Cement report?
While the report offers comprehensive insights, it's advisable to review the specific contents or supplementary materials provided to ascertain if additional resources or data are available.
14. How can I stay updated on further developments or reports in the Silver Reinforced Glass Ionomer Cement?
To stay informed about further developments, trends, and reports in the Silver Reinforced Glass Ionomer Cement, consider subscribing to industry newsletters, following relevant companies and organizations, or regularly checking reputable industry news sources and publications.
Methodology
Step 1 - Identification of Relevant Samples Size from Population Database


Step 2 - Approaches for Defining Global Market Size (Value, Volume* & Price*)

Note*: In applicable scenarios
Step 3 - Data Sources
Primary Research
- Web Analytics
- Survey Reports
- Research Institute
- Latest Research Reports
- Opinion Leaders
Secondary Research
- Annual Reports
- White Paper
- Latest Press Release
- Industry Association
- Paid Database
- Investor Presentations

Step 4 - Data Triangulation
Involves using different sources of information in order to increase the validity of a study
These sources are likely to be stakeholders in a program - participants, other researchers, program staff, other community members, and so on.
Then we put all data in single framework & apply various statistical tools to find out the dynamic on the market.
During the analysis stage, feedback from the stakeholder groups would be compared to determine areas of agreement as well as areas of divergence