Key Insights
The single-cell analysis market is projected for substantial growth, driven by advancements in next-generation sequencing (NGS) and flow cytometry, alongside expanding applications in research and medical diagnostics. The market is forecast to reach a size of 3.81 billion by 2025, with a Compound Annual Growth Rate (CAGR) of 14.7%. This expansion is attributed to the increasing demand for personalized medicine, a deeper understanding of biological processes, and the development of novel therapeutics. Key applications span oncology research, immunology, and drug discovery, where single-cell analysis offers critical insights into cellular heterogeneity and function. The market is segmented by technique, application, and end-user, with North America and Europe currently leading, while the Asia-Pacific region shows significant growth potential due to rising healthcare investments and research activities.
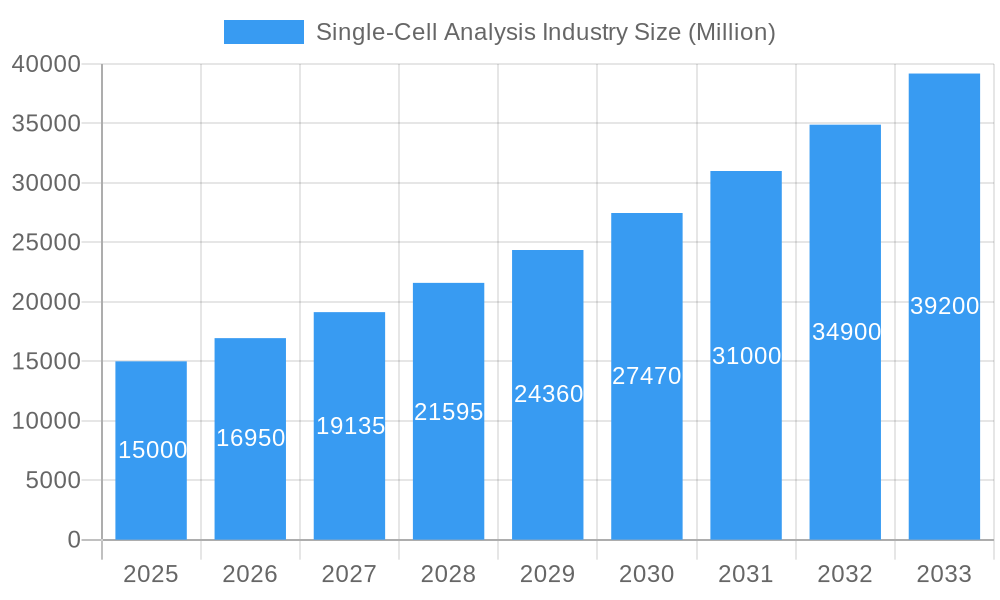
Single-Cell Analysis Industry Market Size (In Billion)
The competitive landscape features established companies such as Becton Dickinson, Bio-Rad Laboratories, and Thermo Fisher Scientific, alongside innovative emerging players. Continued market maturation is expected to intensify competition, emphasizing the need for ongoing innovation and strategic collaborations. The forecast period of 2025-2033 anticipates sustained expansion, with NGS likely to gain prominence due to its high-throughput capabilities. Factors such as decreasing sequencing costs, the adoption of cloud-based analytics, and academic-industry partnerships are poised to accelerate growth. Initial investment costs and the need for specialized expertise remain potential restraints, though these are expected to be offset by improved instrument accessibility and user-friendly data analysis tools. The integration of AI and machine learning will be pivotal in navigating complex single-cell datasets and shaping future market dynamics.
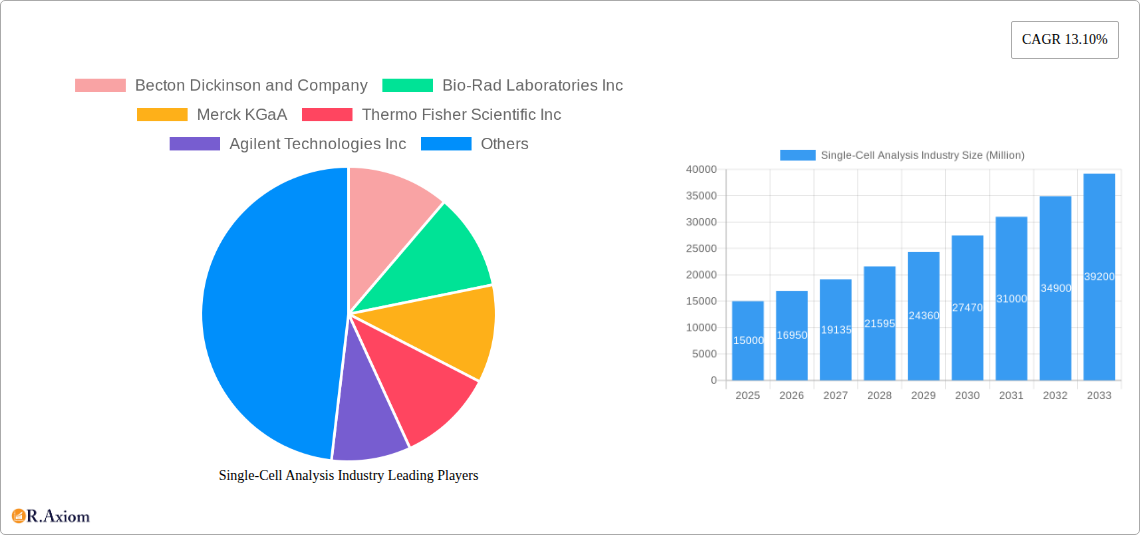
Single-Cell Analysis Industry Company Market Share
Single-Cell Analysis Industry: A Comprehensive Market Report (2019-2033)
This comprehensive report provides an in-depth analysis of the single-cell analysis industry, encompassing market size, segmentation, growth drivers, challenges, and key players. The report covers the period from 2019 to 2033, with a base year of 2025 and a forecast period of 2025-2033. The total market size in 2025 is estimated at xx Million, projected to reach xx Million by 2033, exhibiting a robust CAGR of xx%. This report is crucial for investors, industry stakeholders, and researchers seeking actionable insights into this rapidly evolving sector.
Single-Cell Analysis Industry Market Concentration & Innovation
The single-cell analysis market is characterized by a moderately concentrated landscape, with several multinational corporations holding significant market share. Key players like Becton Dickinson and Company, Bio-Rad Laboratories Inc, Merck KGaA, Thermo Fisher Scientific Inc, and Agilent Technologies Inc dominate the market, collectively accounting for an estimated xx% of the global revenue in 2025. However, the market also features several smaller, specialized companies driving innovation through novel technologies and applications.
Innovation is a key driver, fueled by advancements in next-generation sequencing (NGS), flow cytometry, and mass spectrometry techniques. Stringent regulatory frameworks, particularly in the medical applications segment, influence market dynamics. The presence of substitute technologies, such as traditional bulk analysis methods, creates competitive pressure. End-user trends towards personalized medicine and precision diagnostics are boosting demand for single-cell analysis. Mergers and acquisitions (M&A) activity has been significant, with deal values reaching xx Million in 2024, indicating consolidation and strategic expansion within the industry. Examples include Illumina’s acquisitions of Grail and PacBio, though specific deal values for 2024 are not publicly available.
- Market Share (2025 Estimate): Top 5 players: xx%
- M&A Deal Value (2024): xx Million
Single-Cell Analysis Industry Industry Trends & Insights
The single-cell analysis market is experiencing rapid growth, driven by several key factors. The increasing prevalence of chronic diseases, coupled with the rising demand for personalized medicine, is fueling the adoption of single-cell techniques for disease diagnosis and treatment development. Technological advancements, such as the development of high-throughput platforms and sophisticated bioinformatics tools, are further accelerating market expansion. Consumer preference is shifting towards more precise and targeted therapies, increasing the reliance on single-cell data for drug discovery and development. The competitive landscape is characterized by both intense competition among established players and the emergence of innovative startups offering novel technologies and applications. This competition is driving innovation and pushing down costs, making single-cell analysis more accessible. The market penetration of single-cell techniques in various applications is steadily increasing, with significant growth anticipated in the medical and pharmaceutical sectors. The overall market is expected to exhibit a significant CAGR of xx% during the forecast period (2025-2033).
Dominant Markets & Segments in Single-Cell Analysis Industry
The North American region dominates the global single-cell analysis market, driven by robust research funding, the presence of major players, and advanced healthcare infrastructure. Within this region, the United States holds the largest market share.
- Leading Region: North America
- Leading Country: United States
- Leading Technique: Next-Generation Sequencing (NGS) due to its high throughput and versatility.
- Leading Application: Research Applications, given the extensive use of single-cell analysis in basic research and drug discovery.
- Leading End User: Biotechnology and Pharmaceutical Companies, owing to their significant investment in R&D.
Key drivers for the dominance of these segments include substantial government funding for research, a favorable regulatory environment, and the presence of a highly skilled workforce. The European market is also experiencing substantial growth, driven by increasing research activities and investments in life sciences. Asia-Pacific is projected to witness significant growth in the coming years due to expanding healthcare infrastructure and increasing awareness of advanced diagnostic techniques.
Single-Cell Analysis Industry Product Developments
Recent advancements in single-cell analysis have focused on improving workflow efficiency, expanding applications, and enhancing data analysis capabilities. The introduction of automated platforms, miniaturized devices, and integrated software solutions has significantly streamlined the process, while innovations in sample preparation techniques have increased the throughput and quality of data. New applications are constantly emerging, including liquid biopsy for cancer diagnostics and immunomonitoring for infectious diseases. Companies are also focusing on developing user-friendly software and analytical tools to make single-cell data more accessible to a broader range of researchers and clinicians. This emphasis on user-friendliness and data accessibility is crucial for widening market adoption.
Report Scope & Segmentation Analysis
This report comprehensively segments the single-cell analysis market based on technique (Flow Cytometry, NGS, PCR, Microscopy, Mass Spectrometry, Other Techniques), application (Research Applications, Medical Applications), and end-user (Academic and Research Laboratories, Biotechnology and Pharmaceutical Companies, Hospital and Diagnostic Laboratories). Each segment's growth projections, market size, and competitive dynamics are analyzed in detail, offering a granular understanding of the market landscape. For example, the NGS segment is experiencing the highest growth due to its ability to provide comprehensive genomic information. The medical applications segment is expected to expand rapidly due to its application in personalized medicine, while the pharmaceutical companies will dominate the end-user segment due to their involvement in developing new therapeutic modalities.
Key Drivers of Single-Cell Analysis Industry Growth
The single-cell analysis market is propelled by several factors: technological advancements leading to higher throughput and lower costs; the growing demand for personalized medicine and precision diagnostics; increased funding for life science research; and supportive government regulations. The development of more sensitive and accurate single-cell analysis techniques, such as CRISPR-based methods, further contributes to market growth.
Challenges in the Single-Cell Analysis Industry Sector
Challenges include high initial investment costs for equipment and software, the complexity of data analysis requiring specialized expertise, the need for rigorous quality control measures, and potential regulatory hurdles in clinical applications. Supply chain disruptions, particularly the shortage of specialized reagents and consumables, can also impact market growth, leading to increased costs and project delays. Competition is also stiff, requiring companies to constantly innovate and adapt to stay ahead.
Emerging Opportunities in Single-Cell Analysis Industry
Emerging opportunities are evident in the growing application of single-cell analysis in areas such as immunotherapy, regenerative medicine, and early disease detection. The development of new technologies, such as microfluidics and spatial transcriptomics, is creating exciting possibilities for more detailed and comprehensive analysis. Expanding into new markets, particularly in developing countries with growing healthcare infrastructure, presents significant potential for market expansion.
Leading Players in the Single-Cell Analysis Industry Market
- Becton Dickinson and Company
- Bio-Rad Laboratories Inc
- Merck KGaA
- Thermo Fisher Scientific Inc
- Agilent Technologies Inc
- Promega Corporation
- Beckman Coulter Inc (Danaher Corporation)
- Qiagen NV
- Illumina Inc
- GE Healthcare (GE Company)
- Fluidigm Corporation
Key Developments in Single-Cell Analysis Industry Industry
- March 2022: Mission Bio, Inc. launched the Tapestri Solution for solid tumor research, including a nuclei isolation prep protocol and improved bioinformatic analysis tools.
- April 2022: 10x Genomics announced two new products to improve sample preparation workflow for its Chromium platform.
Strategic Outlook for Single-Cell Analysis Industry Market
The single-cell analysis market is poised for sustained growth, driven by ongoing technological advancements, expanding applications, and increasing investments in life science research. Future market potential is substantial, particularly in the fields of personalized medicine, precision diagnostics, and drug discovery. Companies focusing on innovation, strategic partnerships, and efficient manufacturing will be well-positioned to capitalize on emerging opportunities in this dynamic sector.
Single-Cell Analysis Industry Segmentation
-
1. End User
- 1.1. Academic and Research Laboratories
- 1.2. Biotechnology and Pharmaceutical Companies
- 1.3. Hospital and Diagnostic Laboratories
Single-Cell Analysis Industry Segmentation By Geography
-
1. North America
- 1.1. United States
- 1.2. Canada
- 1.3. Mexico
-
2. Europe
- 2.1. Germany
- 2.2. United Kingdom
- 2.3. France
- 2.4. Italy
- 2.5. Spain
- 2.6. Rest of Europe
-
3. Asia Pacific
- 3.1. China
- 3.2. Japan
- 3.3. India
- 3.4. Australia
- 3.5. South Korea
- 3.6. Rest of Asia Pacific
-
4. Middle East and Africa
- 4.1. GCC
- 4.2. South Africa
- 4.3. Rest of Middle East and Africa
-
5. South America
- 5.1. Brazil
- 5.2. Argentina
- 5.3. Rest of South America
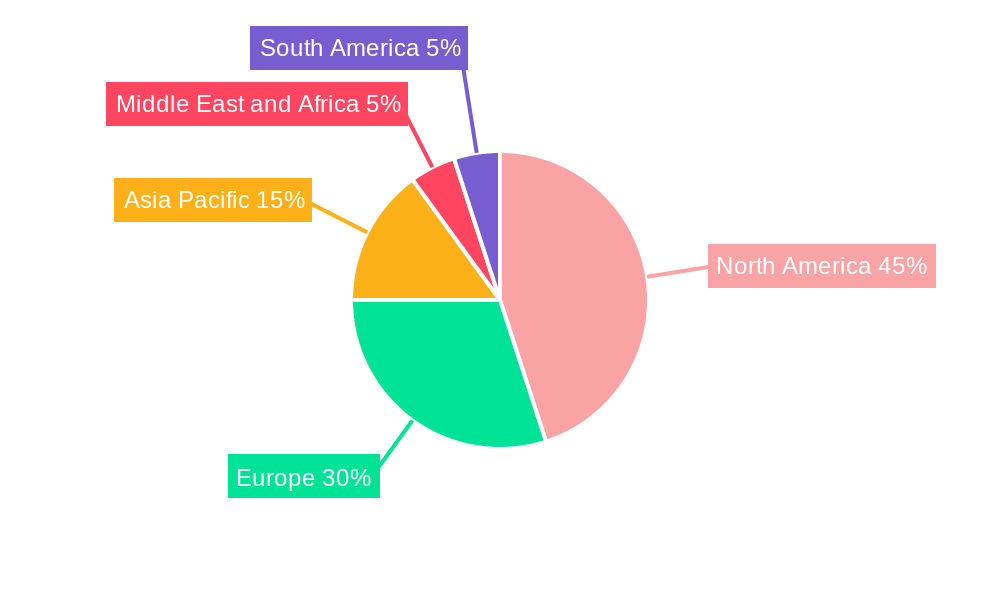
Single-Cell Analysis Industry Regional Market Share
Geographic Coverage of Single-Cell Analysis Industry
Single-Cell Analysis Industry REPORT HIGHLIGHTS
| Aspects | Details |
|---|---|
| Study Period | 2020-2034 |
| Base Year | 2025 |
| Estimated Year | 2026 |
| Forecast Period | 2026-2034 |
| Historical Period | 2020-2025 |
| Growth Rate | CAGR of 14.7% from 2020-2034 |
| Segmentation |
|
Table of Contents
- 1. Introduction
- 1.1. Research Scope
- 1.2. Market Segmentation
- 1.3. Research Objective
- 1.4. Definitions and Assumptions
- 2. Executive Summary
- 2.1. Market Snapshot
- 3. Market Dynamics
- 3.1. Market Drivers
- 3.2. Market Restrains
- 3.3. Market Trends
- 3.4. Market Opportunities
- 4. Market Factor Analysis
- 4.1. Porters Five Forces
- 4.1.1. Bargaining Power of Suppliers
- 4.1.2. Bargaining Power of Buyers
- 4.1.3. Threat of New Entrants
- 4.1.4. Threat of Substitutes
- 4.1.5. Competitive Rivalry
- 4.2. PESTEL analysis
- 4.3. BCG Analysis
- 4.3.1. Stars (High Growth, High Market Share)
- 4.3.2. Cash Cows (Low Growth, High Market Share)
- 4.3.3. Question Mark (High Growth, Low Market Share)
- 4.3.4. Dogs (Low Growth, Low Market Share)
- 4.4. Ansoff Matrix Analysis
- 4.5. Supply Chain Analysis
- 4.6. Regulatory Landscape
- 4.7. Current Market Potential and Opportunity Assessment (TAM–SAM–SOM Framework)
- 4.8. RAX Analyst Note
- 4.1. Porters Five Forces
- 5. Market Analysis, Insights and Forecast 2021-2033
- 5.1. Market Analysis, Insights and Forecast - by End User
- 5.1.1. Academic and Research Laboratories
- 5.1.2. Biotechnology and Pharmaceutical Companies
- 5.1.3. Hospital and Diagnostic Laboratories
- 5.2. Market Analysis, Insights and Forecast - by Region
- 5.2.1. North America
- 5.2.2. Europe
- 5.2.3. Asia Pacific
- 5.2.4. Middle East and Africa
- 5.2.5. South America
- 5.1. Market Analysis, Insights and Forecast - by End User
- 6. Global Single-Cell Analysis Industry Analysis, Insights and Forecast, 2021-2033
- 6.1. Market Analysis, Insights and Forecast - by End User
- 6.1.1. Academic and Research Laboratories
- 6.1.2. Biotechnology and Pharmaceutical Companies
- 6.1.3. Hospital and Diagnostic Laboratories
- 6.1. Market Analysis, Insights and Forecast - by End User
- 7. North America Single-Cell Analysis Industry Analysis, Insights and Forecast, 2020-2032
- 7.1. Market Analysis, Insights and Forecast - by End User
- 7.1.1. Academic and Research Laboratories
- 7.1.2. Biotechnology and Pharmaceutical Companies
- 7.1.3. Hospital and Diagnostic Laboratories
- 7.1. Market Analysis, Insights and Forecast - by End User
- 8. Europe Single-Cell Analysis Industry Analysis, Insights and Forecast, 2020-2032
- 8.1. Market Analysis, Insights and Forecast - by End User
- 8.1.1. Academic and Research Laboratories
- 8.1.2. Biotechnology and Pharmaceutical Companies
- 8.1.3. Hospital and Diagnostic Laboratories
- 8.1. Market Analysis, Insights and Forecast - by End User
- 9. Asia Pacific Single-Cell Analysis Industry Analysis, Insights and Forecast, 2020-2032
- 9.1. Market Analysis, Insights and Forecast - by End User
- 9.1.1. Academic and Research Laboratories
- 9.1.2. Biotechnology and Pharmaceutical Companies
- 9.1.3. Hospital and Diagnostic Laboratories
- 9.1. Market Analysis, Insights and Forecast - by End User
- 10. Middle East and Africa Single-Cell Analysis Industry Analysis, Insights and Forecast, 2020-2032
- 10.1. Market Analysis, Insights and Forecast - by End User
- 10.1.1. Academic and Research Laboratories
- 10.1.2. Biotechnology and Pharmaceutical Companies
- 10.1.3. Hospital and Diagnostic Laboratories
- 10.1. Market Analysis, Insights and Forecast - by End User
- 11. South America Single-Cell Analysis Industry Analysis, Insights and Forecast, 2020-2032
- 11.1. Market Analysis, Insights and Forecast - by End User
- 11.1.1. Academic and Research Laboratories
- 11.1.2. Biotechnology and Pharmaceutical Companies
- 11.1.3. Hospital and Diagnostic Laboratories
- 11.1. Market Analysis, Insights and Forecast - by End User
- 12. Competitive Analysis
- 12.1. Company Profiles
- 12.1.1 Becton Dickinson and Company
- 12.1.1.1. Company Overview
- 12.1.1.2. Products
- 12.1.1.3. Company Financials
- 12.1.1.4. SWOT Analysis
- 12.1.2 Bio-Rad Laboratories Inc
- 12.1.2.1. Company Overview
- 12.1.2.2. Products
- 12.1.2.3. Company Financials
- 12.1.2.4. SWOT Analysis
- 12.1.3 Merck KGaA
- 12.1.3.1. Company Overview
- 12.1.3.2. Products
- 12.1.3.3. Company Financials
- 12.1.3.4. SWOT Analysis
- 12.1.4 Thermo Fisher Scientific Inc
- 12.1.4.1. Company Overview
- 12.1.4.2. Products
- 12.1.4.3. Company Financials
- 12.1.4.4. SWOT Analysis
- 12.1.5 Agilent Technologies Inc
- 12.1.5.1. Company Overview
- 12.1.5.2. Products
- 12.1.5.3. Company Financials
- 12.1.5.4. SWOT Analysis
- 12.1.6 Promega Corporation
- 12.1.6.1. Company Overview
- 12.1.6.2. Products
- 12.1.6.3. Company Financials
- 12.1.6.4. SWOT Analysis
- 12.1.7 Beckman Coulter Inc (Danaher Corporation)
- 12.1.7.1. Company Overview
- 12.1.7.2. Products
- 12.1.7.3. Company Financials
- 12.1.7.4. SWOT Analysis
- 12.1.8 Qiagen NV
- 12.1.8.1. Company Overview
- 12.1.8.2. Products
- 12.1.8.3. Company Financials
- 12.1.8.4. SWOT Analysis
- 12.1.9 Illumina Inc
- 12.1.9.1. Company Overview
- 12.1.9.2. Products
- 12.1.9.3. Company Financials
- 12.1.9.4. SWOT Analysis
- 12.1.10 GE Healthcare (GE Company)
- 12.1.10.1. Company Overview
- 12.1.10.2. Products
- 12.1.10.3. Company Financials
- 12.1.10.4. SWOT Analysis
- 12.1.11 Fluidigm Corporation
- 12.1.11.1. Company Overview
- 12.1.11.2. Products
- 12.1.11.3. Company Financials
- 12.1.11.4. SWOT Analysis
- 12.1.1 Becton Dickinson and Company
- 12.2. Market Entropy
- 12.2.1 Company's Key Areas Served
- 12.2.2 Recent Developments
- 12.3. Company Market Share Analysis 2025
- 12.3.1 Top 5 Companies Market Share Analysis
- 12.3.2 Top 3 Companies Market Share Analysis
- 12.4. List of Potential Customers
- 13. Research Methodology
List of Figures
- Figure 1: Global Single-Cell Analysis Industry Revenue Breakdown (billion, %) by Region 2025 & 2033
- Figure 2: Global Single-Cell Analysis Industry Volume Breakdown (K Unit, %) by Region 2025 & 2033
- Figure 3: North America Single-Cell Analysis Industry Revenue (billion), by End User 2025 & 2033
- Figure 4: North America Single-Cell Analysis Industry Volume (K Unit), by End User 2025 & 2033
- Figure 5: North America Single-Cell Analysis Industry Revenue Share (%), by End User 2025 & 2033
- Figure 6: North America Single-Cell Analysis Industry Volume Share (%), by End User 2025 & 2033
- Figure 7: North America Single-Cell Analysis Industry Revenue (billion), by Country 2025 & 2033
- Figure 8: North America Single-Cell Analysis Industry Volume (K Unit), by Country 2025 & 2033
- Figure 9: North America Single-Cell Analysis Industry Revenue Share (%), by Country 2025 & 2033
- Figure 10: North America Single-Cell Analysis Industry Volume Share (%), by Country 2025 & 2033
- Figure 11: Europe Single-Cell Analysis Industry Revenue (billion), by End User 2025 & 2033
- Figure 12: Europe Single-Cell Analysis Industry Volume (K Unit), by End User 2025 & 2033
- Figure 13: Europe Single-Cell Analysis Industry Revenue Share (%), by End User 2025 & 2033
- Figure 14: Europe Single-Cell Analysis Industry Volume Share (%), by End User 2025 & 2033
- Figure 15: Europe Single-Cell Analysis Industry Revenue (billion), by Country 2025 & 2033
- Figure 16: Europe Single-Cell Analysis Industry Volume (K Unit), by Country 2025 & 2033
- Figure 17: Europe Single-Cell Analysis Industry Revenue Share (%), by Country 2025 & 2033
- Figure 18: Europe Single-Cell Analysis Industry Volume Share (%), by Country 2025 & 2033
- Figure 19: Asia Pacific Single-Cell Analysis Industry Revenue (billion), by End User 2025 & 2033
- Figure 20: Asia Pacific Single-Cell Analysis Industry Volume (K Unit), by End User 2025 & 2033
- Figure 21: Asia Pacific Single-Cell Analysis Industry Revenue Share (%), by End User 2025 & 2033
- Figure 22: Asia Pacific Single-Cell Analysis Industry Volume Share (%), by End User 2025 & 2033
- Figure 23: Asia Pacific Single-Cell Analysis Industry Revenue (billion), by Country 2025 & 2033
- Figure 24: Asia Pacific Single-Cell Analysis Industry Volume (K Unit), by Country 2025 & 2033
- Figure 25: Asia Pacific Single-Cell Analysis Industry Revenue Share (%), by Country 2025 & 2033
- Figure 26: Asia Pacific Single-Cell Analysis Industry Volume Share (%), by Country 2025 & 2033
- Figure 27: Middle East and Africa Single-Cell Analysis Industry Revenue (billion), by End User 2025 & 2033
- Figure 28: Middle East and Africa Single-Cell Analysis Industry Volume (K Unit), by End User 2025 & 2033
- Figure 29: Middle East and Africa Single-Cell Analysis Industry Revenue Share (%), by End User 2025 & 2033
- Figure 30: Middle East and Africa Single-Cell Analysis Industry Volume Share (%), by End User 2025 & 2033
- Figure 31: Middle East and Africa Single-Cell Analysis Industry Revenue (billion), by Country 2025 & 2033
- Figure 32: Middle East and Africa Single-Cell Analysis Industry Volume (K Unit), by Country 2025 & 2033
- Figure 33: Middle East and Africa Single-Cell Analysis Industry Revenue Share (%), by Country 2025 & 2033
- Figure 34: Middle East and Africa Single-Cell Analysis Industry Volume Share (%), by Country 2025 & 2033
- Figure 35: South America Single-Cell Analysis Industry Revenue (billion), by End User 2025 & 2033
- Figure 36: South America Single-Cell Analysis Industry Volume (K Unit), by End User 2025 & 2033
- Figure 37: South America Single-Cell Analysis Industry Revenue Share (%), by End User 2025 & 2033
- Figure 38: South America Single-Cell Analysis Industry Volume Share (%), by End User 2025 & 2033
- Figure 39: South America Single-Cell Analysis Industry Revenue (billion), by Country 2025 & 2033
- Figure 40: South America Single-Cell Analysis Industry Volume (K Unit), by Country 2025 & 2033
- Figure 41: South America Single-Cell Analysis Industry Revenue Share (%), by Country 2025 & 2033
- Figure 42: South America Single-Cell Analysis Industry Volume Share (%), by Country 2025 & 2033
List of Tables
- Table 1: Global Single-Cell Analysis Industry Revenue billion Forecast, by End User 2020 & 2033
- Table 2: Global Single-Cell Analysis Industry Volume K Unit Forecast, by End User 2020 & 2033
- Table 3: Global Single-Cell Analysis Industry Revenue billion Forecast, by Region 2020 & 2033
- Table 4: Global Single-Cell Analysis Industry Volume K Unit Forecast, by Region 2020 & 2033
- Table 5: Global Single-Cell Analysis Industry Revenue billion Forecast, by End User 2020 & 2033
- Table 6: Global Single-Cell Analysis Industry Volume K Unit Forecast, by End User 2020 & 2033
- Table 7: Global Single-Cell Analysis Industry Revenue billion Forecast, by Country 2020 & 2033
- Table 8: Global Single-Cell Analysis Industry Volume K Unit Forecast, by Country 2020 & 2033
- Table 9: United States Single-Cell Analysis Industry Revenue (billion) Forecast, by Application 2020 & 2033
- Table 10: United States Single-Cell Analysis Industry Volume (K Unit) Forecast, by Application 2020 & 2033
- Table 11: Canada Single-Cell Analysis Industry Revenue (billion) Forecast, by Application 2020 & 2033
- Table 12: Canada Single-Cell Analysis Industry Volume (K Unit) Forecast, by Application 2020 & 2033
- Table 13: Mexico Single-Cell Analysis Industry Revenue (billion) Forecast, by Application 2020 & 2033
- Table 14: Mexico Single-Cell Analysis Industry Volume (K Unit) Forecast, by Application 2020 & 2033
- Table 15: Global Single-Cell Analysis Industry Revenue billion Forecast, by End User 2020 & 2033
- Table 16: Global Single-Cell Analysis Industry Volume K Unit Forecast, by End User 2020 & 2033
- Table 17: Global Single-Cell Analysis Industry Revenue billion Forecast, by Country 2020 & 2033
- Table 18: Global Single-Cell Analysis Industry Volume K Unit Forecast, by Country 2020 & 2033
- Table 19: Germany Single-Cell Analysis Industry Revenue (billion) Forecast, by Application 2020 & 2033
- Table 20: Germany Single-Cell Analysis Industry Volume (K Unit) Forecast, by Application 2020 & 2033
- Table 21: United Kingdom Single-Cell Analysis Industry Revenue (billion) Forecast, by Application 2020 & 2033
- Table 22: United Kingdom Single-Cell Analysis Industry Volume (K Unit) Forecast, by Application 2020 & 2033
- Table 23: France Single-Cell Analysis Industry Revenue (billion) Forecast, by Application 2020 & 2033
- Table 24: France Single-Cell Analysis Industry Volume (K Unit) Forecast, by Application 2020 & 2033
- Table 25: Italy Single-Cell Analysis Industry Revenue (billion) Forecast, by Application 2020 & 2033
- Table 26: Italy Single-Cell Analysis Industry Volume (K Unit) Forecast, by Application 2020 & 2033
- Table 27: Spain Single-Cell Analysis Industry Revenue (billion) Forecast, by Application 2020 & 2033
- Table 28: Spain Single-Cell Analysis Industry Volume (K Unit) Forecast, by Application 2020 & 2033
- Table 29: Rest of Europe Single-Cell Analysis Industry Revenue (billion) Forecast, by Application 2020 & 2033
- Table 30: Rest of Europe Single-Cell Analysis Industry Volume (K Unit) Forecast, by Application 2020 & 2033
- Table 31: Global Single-Cell Analysis Industry Revenue billion Forecast, by End User 2020 & 2033
- Table 32: Global Single-Cell Analysis Industry Volume K Unit Forecast, by End User 2020 & 2033
- Table 33: Global Single-Cell Analysis Industry Revenue billion Forecast, by Country 2020 & 2033
- Table 34: Global Single-Cell Analysis Industry Volume K Unit Forecast, by Country 2020 & 2033
- Table 35: China Single-Cell Analysis Industry Revenue (billion) Forecast, by Application 2020 & 2033
- Table 36: China Single-Cell Analysis Industry Volume (K Unit) Forecast, by Application 2020 & 2033
- Table 37: Japan Single-Cell Analysis Industry Revenue (billion) Forecast, by Application 2020 & 2033
- Table 38: Japan Single-Cell Analysis Industry Volume (K Unit) Forecast, by Application 2020 & 2033
- Table 39: India Single-Cell Analysis Industry Revenue (billion) Forecast, by Application 2020 & 2033
- Table 40: India Single-Cell Analysis Industry Volume (K Unit) Forecast, by Application 2020 & 2033
- Table 41: Australia Single-Cell Analysis Industry Revenue (billion) Forecast, by Application 2020 & 2033
- Table 42: Australia Single-Cell Analysis Industry Volume (K Unit) Forecast, by Application 2020 & 2033
- Table 43: South Korea Single-Cell Analysis Industry Revenue (billion) Forecast, by Application 2020 & 2033
- Table 44: South Korea Single-Cell Analysis Industry Volume (K Unit) Forecast, by Application 2020 & 2033
- Table 45: Rest of Asia Pacific Single-Cell Analysis Industry Revenue (billion) Forecast, by Application 2020 & 2033
- Table 46: Rest of Asia Pacific Single-Cell Analysis Industry Volume (K Unit) Forecast, by Application 2020 & 2033
- Table 47: Global Single-Cell Analysis Industry Revenue billion Forecast, by End User 2020 & 2033
- Table 48: Global Single-Cell Analysis Industry Volume K Unit Forecast, by End User 2020 & 2033
- Table 49: Global Single-Cell Analysis Industry Revenue billion Forecast, by Country 2020 & 2033
- Table 50: Global Single-Cell Analysis Industry Volume K Unit Forecast, by Country 2020 & 2033
- Table 51: GCC Single-Cell Analysis Industry Revenue (billion) Forecast, by Application 2020 & 2033
- Table 52: GCC Single-Cell Analysis Industry Volume (K Unit) Forecast, by Application 2020 & 2033
- Table 53: South Africa Single-Cell Analysis Industry Revenue (billion) Forecast, by Application 2020 & 2033
- Table 54: South Africa Single-Cell Analysis Industry Volume (K Unit) Forecast, by Application 2020 & 2033
- Table 55: Rest of Middle East and Africa Single-Cell Analysis Industry Revenue (billion) Forecast, by Application 2020 & 2033
- Table 56: Rest of Middle East and Africa Single-Cell Analysis Industry Volume (K Unit) Forecast, by Application 2020 & 2033
- Table 57: Global Single-Cell Analysis Industry Revenue billion Forecast, by End User 2020 & 2033
- Table 58: Global Single-Cell Analysis Industry Volume K Unit Forecast, by End User 2020 & 2033
- Table 59: Global Single-Cell Analysis Industry Revenue billion Forecast, by Country 2020 & 2033
- Table 60: Global Single-Cell Analysis Industry Volume K Unit Forecast, by Country 2020 & 2033
- Table 61: Brazil Single-Cell Analysis Industry Revenue (billion) Forecast, by Application 2020 & 2033
- Table 62: Brazil Single-Cell Analysis Industry Volume (K Unit) Forecast, by Application 2020 & 2033
- Table 63: Argentina Single-Cell Analysis Industry Revenue (billion) Forecast, by Application 2020 & 2033
- Table 64: Argentina Single-Cell Analysis Industry Volume (K Unit) Forecast, by Application 2020 & 2033
- Table 65: Rest of South America Single-Cell Analysis Industry Revenue (billion) Forecast, by Application 2020 & 2033
- Table 66: Rest of South America Single-Cell Analysis Industry Volume (K Unit) Forecast, by Application 2020 & 2033
Frequently Asked Questions
1. What is the projected Compound Annual Growth Rate (CAGR) of the Single-Cell Analysis Industry?
The projected CAGR is approximately 14.7%.
2. Which companies are prominent players in the Single-Cell Analysis Industry?
Key companies in the market include Becton Dickinson and Company, Bio-Rad Laboratories Inc, Merck KGaA, Thermo Fisher Scientific Inc, Agilent Technologies Inc, Promega Corporation, Beckman Coulter Inc (Danaher Corporation), Qiagen NV, Illumina Inc, GE Healthcare (GE Company), Fluidigm Corporation.
3. What are the main segments of the Single-Cell Analysis Industry?
The market segments include End User.
4. Can you provide details about the market size?
The market size is estimated to be USD 3.81 billion as of 2022.
5. What are some drivers contributing to market growth?
Technological Advancements in Single-cell Analysis Products; Increasing Investments in Cancer Research; Growing Biotechnology and Biopharmaceutical Industries.
6. What are the notable trends driving market growth?
The Research Applications Segment is Expected to Grow at a Good Rate Over the Forecast Period.
7. Are there any restraints impacting market growth?
High Cost of Single Cell Analysis Instruments.
8. Can you provide examples of recent developments in the market?
In March 2022, Mission Bio, Inc., launched the Tapestri Solution for Solid Tumor Research. This new end-to-end single-cell DNA sequencing workflow on the Tapestri Platform includes nuclei isolation prep protocol, pre-designed research panels for breast cancer and glioblastoma multiforme, and an improved single-cell copy number variation (CNV) bioinformatic analysis tool.
9. What pricing options are available for accessing the report?
Pricing options include single-user, multi-user, and enterprise licenses priced at USD 4750, USD 5250, and USD 8750 respectively.
10. Is the market size provided in terms of value or volume?
The market size is provided in terms of value, measured in billion and volume, measured in K Unit.
11. Are there any specific market keywords associated with the report?
Yes, the market keyword associated with the report is "Single-Cell Analysis Industry," which aids in identifying and referencing the specific market segment covered.
12. How do I determine which pricing option suits my needs best?
The pricing options vary based on user requirements and access needs. Individual users may opt for single-user licenses, while businesses requiring broader access may choose multi-user or enterprise licenses for cost-effective access to the report.
13. Are there any additional resources or data provided in the Single-Cell Analysis Industry report?
While the report offers comprehensive insights, it's advisable to review the specific contents or supplementary materials provided to ascertain if additional resources or data are available.
14. How can I stay updated on further developments or reports in the Single-Cell Analysis Industry?
To stay informed about further developments, trends, and reports in the Single-Cell Analysis Industry, consider subscribing to industry newsletters, following relevant companies and organizations, or regularly checking reputable industry news sources and publications.
Methodology
Step 1 - Identification of Relevant Samples Size from Population Database


Step 2 - Approaches for Defining Global Market Size (Value, Volume* & Price*)

Note*: In applicable scenarios
Step 3 - Data Sources
Primary Research
- Web Analytics
- Survey Reports
- Research Institute
- Latest Research Reports
- Opinion Leaders
Secondary Research
- Annual Reports
- White Paper
- Latest Press Release
- Industry Association
- Paid Database
- Investor Presentations

Step 4 - Data Triangulation
Involves using different sources of information in order to increase the validity of a study
These sources are likely to be stakeholders in a program - participants, other researchers, program staff, other community members, and so on.
Then we put all data in single framework & apply various statistical tools to find out the dynamic on the market.
During the analysis stage, feedback from the stakeholder groups would be compared to determine areas of agreement as well as areas of divergence

