

Key Insights
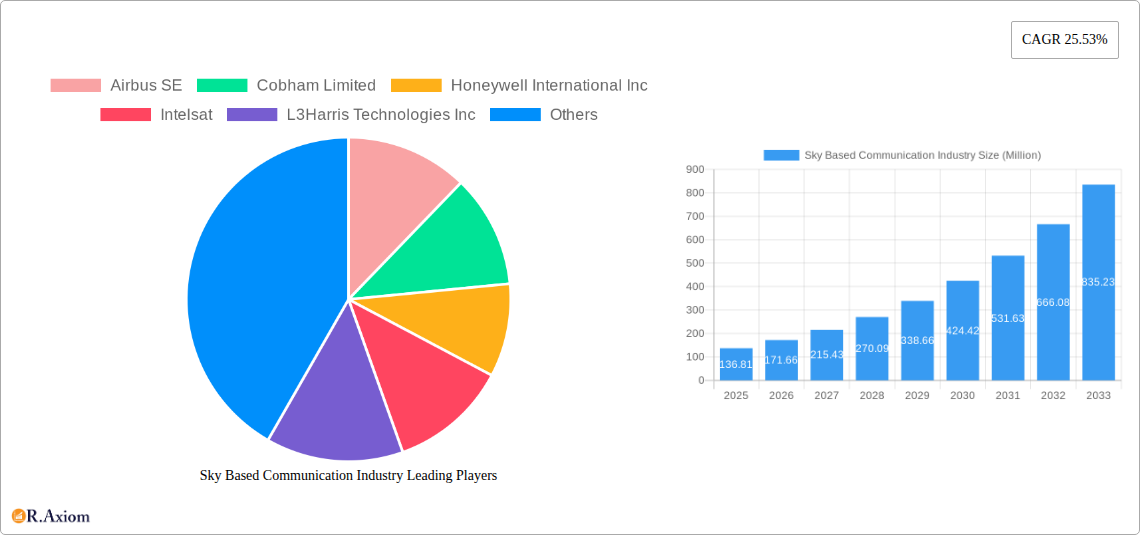
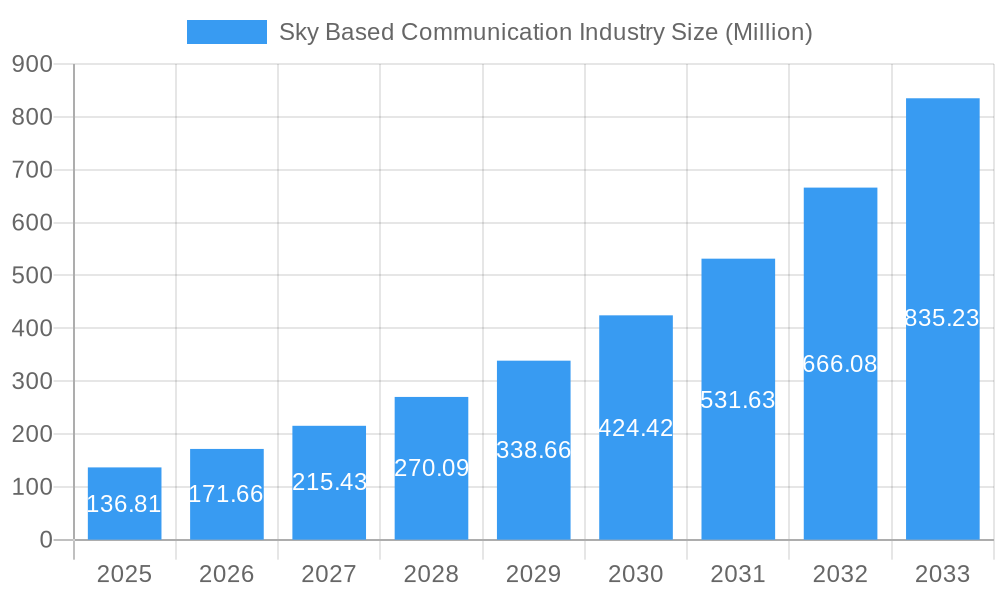
The sky-based communication industry, valued at $136.81 million in 2025, is experiencing robust growth, projected to expand at a Compound Annual Growth Rate (CAGR) of 25.53% from 2025 to 2033. This significant expansion is driven by several key factors. The increasing demand for high-speed, reliable connectivity across diverse sectors, including aviation, maritime, and remote areas, is a primary catalyst. Advancements in satellite technology, such as the deployment of low earth orbit (LEO) constellations and the development of higher-throughput satellites, are significantly enhancing bandwidth and reducing latency, making sky-based communication increasingly attractive. Furthermore, the growing adoption of IoT devices and the need for seamless connectivity in remote areas are fueling market growth. Regulatory support and increased investments in infrastructure are also contributing to this expansion. The competitive landscape is characterized by both established players and emerging companies, driving innovation and cost reduction within the sector.
Sky Based Communication Industry Market Size (In Million)
However, the industry faces certain challenges. High initial investment costs associated with satellite infrastructure and launch operations can pose a significant barrier to entry for new players. The industry is also susceptible to technological disruptions and the potential for interference from terrestrial networks. Competition among existing satellite operators is intensifying, leading to pricing pressures and the need for continuous innovation to maintain a competitive edge. Overcoming these challenges through strategic partnerships, technological advancements, and efficient resource management will be crucial for sustained growth in the sky-based communication market. Segmentation within the market includes various applications (e.g., aerospace, maritime, government) and different technologies employed (e.g., LEO, GEO, MEO satellites). Regional growth will vary, with North America and Europe likely leading due to strong technological advancements and existing infrastructure.
Sky Based Communication Industry Company Market Share
Sky Based Communication Industry Market Report: 2019-2033
This comprehensive report provides an in-depth analysis of the Sky Based Communication Industry, covering market size, growth drivers, challenges, and key players. The study period spans from 2019 to 2033, with a base year of 2025 and a forecast period of 2025-2033. The report utilizes a wealth of data from the historical period (2019-2024) and projects future trends based on rigorous analysis. Expect detailed insights into market concentration, technological advancements, regional dominance, and emerging opportunities within this dynamic sector. This report is invaluable for industry stakeholders, investors, and anyone seeking a comprehensive understanding of the sky-based communication landscape.
Sky Based Communication Industry Market Concentration & Innovation
The Sky Based Communication industry exhibits a moderately concentrated market structure, with a few dominant players holding significant market share. While precise market share figures for each company vary by segment and are proprietary, we estimate the top 10 companies (Airbus SE, Cobham Limited, Honeywell International Inc, Intelsat, L3Harris Technologies Inc, Maxar Technologies Inc, THALES, Viasat Inc, Inmarsat Global Limited, Iridium Communications Inc) collectively account for over 70% of the global market revenue in 2025. This concentration is driven by significant capital investments needed for satellite development, launch, and operation. However, the industry also witnesses considerable innovation, fueled by advancements in satellite technology, increased demand for high-bandwidth connectivity, and the rise of new applications like IoT and Low Earth Orbit (LEO) constellations. Regulatory frameworks, while aiming for efficient spectrum management and safety, can sometimes hinder rapid technological advancements. Product substitutes, such as terrestrial fiber optic networks, pose competition but cannot entirely replace the unique capabilities of satellite communication, particularly in remote areas or for mobile applications. End-user trends favor increased bandwidth, lower latency, and more secure communication, shaping product development strategies. Mergers and acquisitions (M&A) activity remains substantial, with notable deals valued at approximately USD xx Million annually during the historical period; this signifies an ongoing consolidation trend and quest for technological synergy.
- Market Concentration: Top 10 players hold over 70% market share (2025 Estimate).
- M&A Activity: Annual deal value approximately USD xx Million (2019-2024).
- Innovation Drivers: LEO constellations, 5G integration, advanced encryption.
- Regulatory Impact: Spectrum allocation, safety standards influence technology adoption.
Sky Based Communication Industry Industry Trends & Insights
The Sky Based Communication industry is experiencing robust growth, driven by increasing demand for global connectivity, particularly in underserved regions. The market demonstrates a Compound Annual Growth Rate (CAGR) of approximately xx% during the forecast period (2025-2033), reaching an estimated market size of USD xx Million by 2033. This growth is primarily fueled by the expansion of LEO satellite constellations which offer substantially higher bandwidth and lower latency compared to traditional Geostationary Earth Orbit (GEO) satellites. The market penetration of satellite-based broadband services, especially in rural areas, is projected to increase significantly, exceeding xx% by 2033. Technological disruptions, including advancements in Software Defined Radios (SDRs) and improved ground segment infrastructure, enhance efficiency and reduce costs. Consumer preferences are shifting towards higher-speed, more reliable, and secure communication solutions, aligning with the industry's technological advancements. Competitive dynamics are characterized by a mix of established players consolidating their positions and innovative startups introducing new technologies.
Dominant Markets & Segments in Sky Based Communication Industry
North America currently holds the dominant position in the Sky Based Communication market, accounting for approximately xx% of the global market revenue in 2025. This leadership is attributed to:
- Strong government investment in space-related technologies.
- Presence of key players such as SpaceX, and significant defense spending.
- Well-developed infrastructure for satellite communication.
Europe and Asia-Pacific are also significant markets, demonstrating substantial growth potential. European markets benefit from robust regulatory frameworks and a large pool of skilled engineers and scientists. Asia-Pacific’s expansion is driven by rapid economic growth and increasing mobile device penetration.
Sky Based Communication Industry Product Developments
Recent product innovations focus on increasing bandwidth, lowering latency, and improving security. Advancements in satellite technology, like the use of phased array antennas and higher-frequency bands, are pivotal. These improvements are broadening the applications of sky-based communication, including enhanced broadband internet access, improved navigation systems, and more efficient IoT deployments. The competitive advantage lies in offering the best combination of speed, reliability, cost-effectiveness, and security, tailored to specific user needs and applications. Miniaturization of satellite components and the adoption of software-defined radios also plays a significant role.
Report Scope & Segmentation Analysis
The report segment the Sky Based Communication Industry by several criteria, including:
By Satellite Type: GEO, LEO, MEO, each exhibiting distinct characteristics in terms of latency, bandwidth, and coverage. GEO satellites offer wide coverage but higher latency, while LEO constellations prioritize low latency but require a larger number of satellites. MEO holds a middle ground.
By Application: Government & Defense, Maritime, Aviation, Enterprise & Commercial, each with its own growth trajectory and competitive dynamics. The government and defense sector often drives significant investment and innovation due to its high demand for secure and reliable communication.
By Region: North America, Europe, Asia-Pacific, Middle East & Africa, and South America, providing regional-specific insights into market size, growth rates, and major players.
Growth projections, market sizes, and competitive dynamics are analyzed for each segment, offering a detailed understanding of the industry structure.
Key Drivers of Sky Based Communication Industry Growth
The growth of the Sky Based Communication industry is fueled by a confluence of factors. The increasing demand for high-speed internet access across the globe, particularly in remote areas underserved by terrestrial networks is one key factor. Technological advancements, specifically the development of advanced satellite constellations, such as LEO networks, are making communication more efficient. Government investments and regulatory support, especially focused on encouraging competition and promoting innovation, stimulate market growth. Finally, the growing adoption of IoT devices which require reliable connectivity is another crucial driver of expansion.
Challenges in the Sky Based Communication Industry Sector
The industry faces several challenges: high initial capital investments for satellite development and launch pose barriers to entry for new players. The need for complex ground infrastructure and skilled workforce remains a challenge. Regulatory complexities regarding spectrum allocation and international agreements can also hinder expansion. Competitive pressure from terrestrial network providers and the emergence of new technologies continuously challenge existing businesses. Lastly, supply chain disruptions and the impact of geopolitical events can negatively impact the industry's stability and growth, potentially leading to delays in projects and increased costs.
Emerging Opportunities in Sky Based Communication Industry
Emerging trends and opportunities include the expansion of IoT applications utilizing satellite connectivity, especially for remote monitoring and asset tracking. The integration of 5G technology with satellite networks is another key opportunity, providing enhanced mobility and higher speeds. The development of new technologies like laser communication, promises faster speeds and higher capacity, representing a promising area for future growth. Increased private sector investment, focusing on creating more affordable and accessible satellite services, further opens new opportunities to expand markets.
Leading Players in the Sky Based Communication Industry Market
Key Developments in Sky Based Communication Industry Industry
- October 2023: Honeywell secured a USD 900 Million contract from the US Space Force for its Proliferated Low Earth Orbit program, significantly boosting the LEO segment.
- February 2024: Northrop Grumman awarded Viasat Inc. a contract to leverage the ViaSat-3 network for enhanced USAF communication capabilities, highlighting the increasing role of private companies in military applications.
Strategic Outlook for Sky Based Communication Industry Market
The Sky Based Communication industry exhibits substantial future potential, driven by continued technological advancements, increasing demand for global connectivity, and governmental support. The expansion of LEO constellations and the integration of 5G are key catalysts for growth. Emerging applications, such as IoT and enhanced mobile services, will further fuel market expansion. Companies that successfully innovate, develop robust partnerships, and adapt to evolving market dynamics are poised to benefit significantly from this growing sector's opportunities.
Sky Based Communication Industry Segmentation
-
1. Application
- 1.1. Telecommunication
- 1.2. Broadband
- 1.3. Navigation
- 1.4. Remote Sensing
- 1.5. Broadcasting
- 1.6. Other Applications
-
2. Type
- 2.1. Low Earth Orbit (LEO)
- 2.2. Medium Earth Orbit (MEO)
-
3. End User
- 3.1. Military and Government
- 3.2. Commercial
Sky Based Communication Industry Segmentation By Geography
-
1. North America
- 1.1. United States
- 1.2. Canada
-
2. Europe
- 2.1. United Kingdom
- 2.2. France
- 2.3. Germany
- 2.4. Russia
- 2.5. Rest of Europe
-
3. Asia Pacific
- 3.1. India
- 3.2. China
- 3.3. Japan
- 3.4. South Korea
- 3.5. Rest of Asia Pacific
-
4. Latin America
- 4.1. Brazil
- 4.2. Rest of Latin America
-
5. Middle East and Africa
- 5.1. United Arab Emirates
- 5.2. Saudi Arabia
- 5.3. Israel
- 5.4. Rest of Middle East and Africa

Sky Based Communication Industry Regional Market Share
Geographic Coverage of Sky Based Communication Industry
Sky Based Communication Industry REPORT HIGHLIGHTS
| Aspects | Details |
|---|---|
| Study Period | 2020-2034 |
| Base Year | 2025 |
| Estimated Year | 2026 |
| Forecast Period | 2026-2034 |
| Historical Period | 2020-2025 |
| Growth Rate | CAGR of 25.53% from 2020-2034 |
| Segmentation |
|
Table of Contents
- 1. Introduction
- 1.1. Research Scope
- 1.2. Market Segmentation
- 1.3. Research Objective
- 1.4. Definitions and Assumptions
- 2. Executive Summary
- 2.1. Market Snapshot
- 3. Market Dynamics
- 3.1. Market Drivers
- 3.2. Market Restrains
- 3.3. Market Trends
- 3.4. Market Opportunities
- 4. Market Factor Analysis
- 4.1. Porters Five Forces
- 4.1.1. Bargaining Power of Suppliers
- 4.1.2. Bargaining Power of Buyers
- 4.1.3. Threat of New Entrants
- 4.1.4. Threat of Substitutes
- 4.1.5. Competitive Rivalry
- 4.2. PESTEL analysis
- 4.3. BCG Analysis
- 4.3.1. Stars (High Growth, High Market Share)
- 4.3.2. Cash Cows (Low Growth, High Market Share)
- 4.3.3. Question Mark (High Growth, Low Market Share)
- 4.3.4. Dogs (Low Growth, Low Market Share)
- 4.4. Ansoff Matrix Analysis
- 4.5. Supply Chain Analysis
- 4.6. Regulatory Landscape
- 4.7. Current Market Potential and Opportunity Assessment (TAM–SAM–SOM Framework)
- 4.8. RAX Analyst Note
- 4.1. Porters Five Forces
- 5. Market Analysis, Insights and Forecast 2021-2033
- 5.1. Market Analysis, Insights and Forecast - by Application
- 5.1.1. Telecommunication
- 5.1.2. Broadband
- 5.1.3. Navigation
- 5.1.4. Remote Sensing
- 5.1.5. Broadcasting
- 5.1.6. Other Applications
- 5.2. Market Analysis, Insights and Forecast - by Type
- 5.2.1. Low Earth Orbit (LEO)
- 5.2.2. Medium Earth Orbit (MEO)
- 5.3. Market Analysis, Insights and Forecast - by End User
- 5.3.1. Military and Government
- 5.3.2. Commercial
- 5.4. Market Analysis, Insights and Forecast - by Region
- 5.4.1. North America
- 5.4.2. Europe
- 5.4.3. Asia Pacific
- 5.4.4. Latin America
- 5.4.5. Middle East and Africa
- 5.1. Market Analysis, Insights and Forecast - by Application
- 6. Global Sky Based Communication Industry Analysis, Insights and Forecast, 2021-2033
- 6.1. Market Analysis, Insights and Forecast - by Application
- 6.1.1. Telecommunication
- 6.1.2. Broadband
- 6.1.3. Navigation
- 6.1.4. Remote Sensing
- 6.1.5. Broadcasting
- 6.1.6. Other Applications
- 6.2. Market Analysis, Insights and Forecast - by Type
- 6.2.1. Low Earth Orbit (LEO)
- 6.2.2. Medium Earth Orbit (MEO)
- 6.3. Market Analysis, Insights and Forecast - by End User
- 6.3.1. Military and Government
- 6.3.2. Commercial
- 6.1. Market Analysis, Insights and Forecast - by Application
- 7. North America Sky Based Communication Industry Analysis, Insights and Forecast, 2020-2032
- 7.1. Market Analysis, Insights and Forecast - by Application
- 7.1.1. Telecommunication
- 7.1.2. Broadband
- 7.1.3. Navigation
- 7.1.4. Remote Sensing
- 7.1.5. Broadcasting
- 7.1.6. Other Applications
- 7.2. Market Analysis, Insights and Forecast - by Type
- 7.2.1. Low Earth Orbit (LEO)
- 7.2.2. Medium Earth Orbit (MEO)
- 7.3. Market Analysis, Insights and Forecast - by End User
- 7.3.1. Military and Government
- 7.3.2. Commercial
- 7.1. Market Analysis, Insights and Forecast - by Application
- 8. Europe Sky Based Communication Industry Analysis, Insights and Forecast, 2020-2032
- 8.1. Market Analysis, Insights and Forecast - by Application
- 8.1.1. Telecommunication
- 8.1.2. Broadband
- 8.1.3. Navigation
- 8.1.4. Remote Sensing
- 8.1.5. Broadcasting
- 8.1.6. Other Applications
- 8.2. Market Analysis, Insights and Forecast - by Type
- 8.2.1. Low Earth Orbit (LEO)
- 8.2.2. Medium Earth Orbit (MEO)
- 8.3. Market Analysis, Insights and Forecast - by End User
- 8.3.1. Military and Government
- 8.3.2. Commercial
- 8.1. Market Analysis, Insights and Forecast - by Application
- 9. Asia Pacific Sky Based Communication Industry Analysis, Insights and Forecast, 2020-2032
- 9.1. Market Analysis, Insights and Forecast - by Application
- 9.1.1. Telecommunication
- 9.1.2. Broadband
- 9.1.3. Navigation
- 9.1.4. Remote Sensing
- 9.1.5. Broadcasting
- 9.1.6. Other Applications
- 9.2. Market Analysis, Insights and Forecast - by Type
- 9.2.1. Low Earth Orbit (LEO)
- 9.2.2. Medium Earth Orbit (MEO)
- 9.3. Market Analysis, Insights and Forecast - by End User
- 9.3.1. Military and Government
- 9.3.2. Commercial
- 9.1. Market Analysis, Insights and Forecast - by Application
- 10. Latin America Sky Based Communication Industry Analysis, Insights and Forecast, 2020-2032
- 10.1. Market Analysis, Insights and Forecast - by Application
- 10.1.1. Telecommunication
- 10.1.2. Broadband
- 10.1.3. Navigation
- 10.1.4. Remote Sensing
- 10.1.5. Broadcasting
- 10.1.6. Other Applications
- 10.2. Market Analysis, Insights and Forecast - by Type
- 10.2.1. Low Earth Orbit (LEO)
- 10.2.2. Medium Earth Orbit (MEO)
- 10.3. Market Analysis, Insights and Forecast - by End User
- 10.3.1. Military and Government
- 10.3.2. Commercial
- 10.1. Market Analysis, Insights and Forecast - by Application
- 11. Middle East and Africa Sky Based Communication Industry Analysis, Insights and Forecast, 2020-2032
- 11.1. Market Analysis, Insights and Forecast - by Application
- 11.1.1. Telecommunication
- 11.1.2. Broadband
- 11.1.3. Navigation
- 11.1.4. Remote Sensing
- 11.1.5. Broadcasting
- 11.1.6. Other Applications
- 11.2. Market Analysis, Insights and Forecast - by Type
- 11.2.1. Low Earth Orbit (LEO)
- 11.2.2. Medium Earth Orbit (MEO)
- 11.3. Market Analysis, Insights and Forecast - by End User
- 11.3.1. Military and Government
- 11.3.2. Commercial
- 11.1. Market Analysis, Insights and Forecast - by Application
- 12. Competitive Analysis
- 12.1. Company Profiles
- 12.1.1 Airbus SE
- 12.1.1.1. Company Overview
- 12.1.1.2. Products
- 12.1.1.3. Company Financials
- 12.1.1.4. SWOT Analysis
- 12.1.2 Cobham Limited
- 12.1.2.1. Company Overview
- 12.1.2.2. Products
- 12.1.2.3. Company Financials
- 12.1.2.4. SWOT Analysis
- 12.1.3 Honeywell International Inc
- 12.1.3.1. Company Overview
- 12.1.3.2. Products
- 12.1.3.3. Company Financials
- 12.1.3.4. SWOT Analysis
- 12.1.4 Intelsat
- 12.1.4.1. Company Overview
- 12.1.4.2. Products
- 12.1.4.3. Company Financials
- 12.1.4.4. SWOT Analysis
- 12.1.5 L3Harris Technologies Inc
- 12.1.5.1. Company Overview
- 12.1.5.2. Products
- 12.1.5.3. Company Financials
- 12.1.5.4. SWOT Analysis
- 12.1.6 Maxar Technologies Inc
- 12.1.6.1. Company Overview
- 12.1.6.2. Products
- 12.1.6.3. Company Financials
- 12.1.6.4. SWOT Analysis
- 12.1.7 THALES
- 12.1.7.1. Company Overview
- 12.1.7.2. Products
- 12.1.7.3. Company Financials
- 12.1.7.4. SWOT Analysis
- 12.1.8 Viasat Inc
- 12.1.8.1. Company Overview
- 12.1.8.2. Products
- 12.1.8.3. Company Financials
- 12.1.8.4. SWOT Analysis
- 12.1.9 Inmarsat Global Limited
- 12.1.9.1. Company Overview
- 12.1.9.2. Products
- 12.1.9.3. Company Financials
- 12.1.9.4. SWOT Analysis
- 12.1.10 Iridium Communications Inc
- 12.1.10.1. Company Overview
- 12.1.10.2. Products
- 12.1.10.3. Company Financials
- 12.1.10.4. SWOT Analysis
- 12.1.1 Airbus SE
- 12.2. Market Entropy
- 12.2.1 Company's Key Areas Served
- 12.2.2 Recent Developments
- 12.3. Company Market Share Analysis 2025
- 12.3.1 Top 5 Companies Market Share Analysis
- 12.3.2 Top 3 Companies Market Share Analysis
- 12.4. List of Potential Customers
- 13. Research Methodology
List of Figures
- Figure 1: Global Sky Based Communication Industry Revenue Breakdown (Million, %) by Region 2025 & 2033
- Figure 2: Global Sky Based Communication Industry Volume Breakdown (Billion, %) by Region 2025 & 2033
- Figure 3: North America Sky Based Communication Industry Revenue (Million), by Application 2025 & 2033
- Figure 4: North America Sky Based Communication Industry Volume (Billion), by Application 2025 & 2033
- Figure 5: North America Sky Based Communication Industry Revenue Share (%), by Application 2025 & 2033
- Figure 6: North America Sky Based Communication Industry Volume Share (%), by Application 2025 & 2033
- Figure 7: North America Sky Based Communication Industry Revenue (Million), by Type 2025 & 2033
- Figure 8: North America Sky Based Communication Industry Volume (Billion), by Type 2025 & 2033
- Figure 9: North America Sky Based Communication Industry Revenue Share (%), by Type 2025 & 2033
- Figure 10: North America Sky Based Communication Industry Volume Share (%), by Type 2025 & 2033
- Figure 11: North America Sky Based Communication Industry Revenue (Million), by End User 2025 & 2033
- Figure 12: North America Sky Based Communication Industry Volume (Billion), by End User 2025 & 2033
- Figure 13: North America Sky Based Communication Industry Revenue Share (%), by End User 2025 & 2033
- Figure 14: North America Sky Based Communication Industry Volume Share (%), by End User 2025 & 2033
- Figure 15: North America Sky Based Communication Industry Revenue (Million), by Country 2025 & 2033
- Figure 16: North America Sky Based Communication Industry Volume (Billion), by Country 2025 & 2033
- Figure 17: North America Sky Based Communication Industry Revenue Share (%), by Country 2025 & 2033
- Figure 18: North America Sky Based Communication Industry Volume Share (%), by Country 2025 & 2033
- Figure 19: Europe Sky Based Communication Industry Revenue (Million), by Application 2025 & 2033
- Figure 20: Europe Sky Based Communication Industry Volume (Billion), by Application 2025 & 2033
- Figure 21: Europe Sky Based Communication Industry Revenue Share (%), by Application 2025 & 2033
- Figure 22: Europe Sky Based Communication Industry Volume Share (%), by Application 2025 & 2033
- Figure 23: Europe Sky Based Communication Industry Revenue (Million), by Type 2025 & 2033
- Figure 24: Europe Sky Based Communication Industry Volume (Billion), by Type 2025 & 2033
- Figure 25: Europe Sky Based Communication Industry Revenue Share (%), by Type 2025 & 2033
- Figure 26: Europe Sky Based Communication Industry Volume Share (%), by Type 2025 & 2033
- Figure 27: Europe Sky Based Communication Industry Revenue (Million), by End User 2025 & 2033
- Figure 28: Europe Sky Based Communication Industry Volume (Billion), by End User 2025 & 2033
- Figure 29: Europe Sky Based Communication Industry Revenue Share (%), by End User 2025 & 2033
- Figure 30: Europe Sky Based Communication Industry Volume Share (%), by End User 2025 & 2033
- Figure 31: Europe Sky Based Communication Industry Revenue (Million), by Country 2025 & 2033
- Figure 32: Europe Sky Based Communication Industry Volume (Billion), by Country 2025 & 2033
- Figure 33: Europe Sky Based Communication Industry Revenue Share (%), by Country 2025 & 2033
- Figure 34: Europe Sky Based Communication Industry Volume Share (%), by Country 2025 & 2033
- Figure 35: Asia Pacific Sky Based Communication Industry Revenue (Million), by Application 2025 & 2033
- Figure 36: Asia Pacific Sky Based Communication Industry Volume (Billion), by Application 2025 & 2033
- Figure 37: Asia Pacific Sky Based Communication Industry Revenue Share (%), by Application 2025 & 2033
- Figure 38: Asia Pacific Sky Based Communication Industry Volume Share (%), by Application 2025 & 2033
- Figure 39: Asia Pacific Sky Based Communication Industry Revenue (Million), by Type 2025 & 2033
- Figure 40: Asia Pacific Sky Based Communication Industry Volume (Billion), by Type 2025 & 2033
- Figure 41: Asia Pacific Sky Based Communication Industry Revenue Share (%), by Type 2025 & 2033
- Figure 42: Asia Pacific Sky Based Communication Industry Volume Share (%), by Type 2025 & 2033
- Figure 43: Asia Pacific Sky Based Communication Industry Revenue (Million), by End User 2025 & 2033
- Figure 44: Asia Pacific Sky Based Communication Industry Volume (Billion), by End User 2025 & 2033
- Figure 45: Asia Pacific Sky Based Communication Industry Revenue Share (%), by End User 2025 & 2033
- Figure 46: Asia Pacific Sky Based Communication Industry Volume Share (%), by End User 2025 & 2033
- Figure 47: Asia Pacific Sky Based Communication Industry Revenue (Million), by Country 2025 & 2033
- Figure 48: Asia Pacific Sky Based Communication Industry Volume (Billion), by Country 2025 & 2033
- Figure 49: Asia Pacific Sky Based Communication Industry Revenue Share (%), by Country 2025 & 2033
- Figure 50: Asia Pacific Sky Based Communication Industry Volume Share (%), by Country 2025 & 2033
- Figure 51: Latin America Sky Based Communication Industry Revenue (Million), by Application 2025 & 2033
- Figure 52: Latin America Sky Based Communication Industry Volume (Billion), by Application 2025 & 2033
- Figure 53: Latin America Sky Based Communication Industry Revenue Share (%), by Application 2025 & 2033
- Figure 54: Latin America Sky Based Communication Industry Volume Share (%), by Application 2025 & 2033
- Figure 55: Latin America Sky Based Communication Industry Revenue (Million), by Type 2025 & 2033
- Figure 56: Latin America Sky Based Communication Industry Volume (Billion), by Type 2025 & 2033
- Figure 57: Latin America Sky Based Communication Industry Revenue Share (%), by Type 2025 & 2033
- Figure 58: Latin America Sky Based Communication Industry Volume Share (%), by Type 2025 & 2033
- Figure 59: Latin America Sky Based Communication Industry Revenue (Million), by End User 2025 & 2033
- Figure 60: Latin America Sky Based Communication Industry Volume (Billion), by End User 2025 & 2033
- Figure 61: Latin America Sky Based Communication Industry Revenue Share (%), by End User 2025 & 2033
- Figure 62: Latin America Sky Based Communication Industry Volume Share (%), by End User 2025 & 2033
- Figure 63: Latin America Sky Based Communication Industry Revenue (Million), by Country 2025 & 2033
- Figure 64: Latin America Sky Based Communication Industry Volume (Billion), by Country 2025 & 2033
- Figure 65: Latin America Sky Based Communication Industry Revenue Share (%), by Country 2025 & 2033
- Figure 66: Latin America Sky Based Communication Industry Volume Share (%), by Country 2025 & 2033
- Figure 67: Middle East and Africa Sky Based Communication Industry Revenue (Million), by Application 2025 & 2033
- Figure 68: Middle East and Africa Sky Based Communication Industry Volume (Billion), by Application 2025 & 2033
- Figure 69: Middle East and Africa Sky Based Communication Industry Revenue Share (%), by Application 2025 & 2033
- Figure 70: Middle East and Africa Sky Based Communication Industry Volume Share (%), by Application 2025 & 2033
- Figure 71: Middle East and Africa Sky Based Communication Industry Revenue (Million), by Type 2025 & 2033
- Figure 72: Middle East and Africa Sky Based Communication Industry Volume (Billion), by Type 2025 & 2033
- Figure 73: Middle East and Africa Sky Based Communication Industry Revenue Share (%), by Type 2025 & 2033
- Figure 74: Middle East and Africa Sky Based Communication Industry Volume Share (%), by Type 2025 & 2033
- Figure 75: Middle East and Africa Sky Based Communication Industry Revenue (Million), by End User 2025 & 2033
- Figure 76: Middle East and Africa Sky Based Communication Industry Volume (Billion), by End User 2025 & 2033
- Figure 77: Middle East and Africa Sky Based Communication Industry Revenue Share (%), by End User 2025 & 2033
- Figure 78: Middle East and Africa Sky Based Communication Industry Volume Share (%), by End User 2025 & 2033
- Figure 79: Middle East and Africa Sky Based Communication Industry Revenue (Million), by Country 2025 & 2033
- Figure 80: Middle East and Africa Sky Based Communication Industry Volume (Billion), by Country 2025 & 2033
- Figure 81: Middle East and Africa Sky Based Communication Industry Revenue Share (%), by Country 2025 & 2033
- Figure 82: Middle East and Africa Sky Based Communication Industry Volume Share (%), by Country 2025 & 2033
List of Tables
- Table 1: Global Sky Based Communication Industry Revenue Million Forecast, by Application 2020 & 2033
- Table 2: Global Sky Based Communication Industry Volume Billion Forecast, by Application 2020 & 2033
- Table 3: Global Sky Based Communication Industry Revenue Million Forecast, by Type 2020 & 2033
- Table 4: Global Sky Based Communication Industry Volume Billion Forecast, by Type 2020 & 2033
- Table 5: Global Sky Based Communication Industry Revenue Million Forecast, by End User 2020 & 2033
- Table 6: Global Sky Based Communication Industry Volume Billion Forecast, by End User 2020 & 2033
- Table 7: Global Sky Based Communication Industry Revenue Million Forecast, by Region 2020 & 2033
- Table 8: Global Sky Based Communication Industry Volume Billion Forecast, by Region 2020 & 2033
- Table 9: Global Sky Based Communication Industry Revenue Million Forecast, by Application 2020 & 2033
- Table 10: Global Sky Based Communication Industry Volume Billion Forecast, by Application 2020 & 2033
- Table 11: Global Sky Based Communication Industry Revenue Million Forecast, by Type 2020 & 2033
- Table 12: Global Sky Based Communication Industry Volume Billion Forecast, by Type 2020 & 2033
- Table 13: Global Sky Based Communication Industry Revenue Million Forecast, by End User 2020 & 2033
- Table 14: Global Sky Based Communication Industry Volume Billion Forecast, by End User 2020 & 2033
- Table 15: Global Sky Based Communication Industry Revenue Million Forecast, by Country 2020 & 2033
- Table 16: Global Sky Based Communication Industry Volume Billion Forecast, by Country 2020 & 2033
- Table 17: United States Sky Based Communication Industry Revenue (Million) Forecast, by Application 2020 & 2033
- Table 18: United States Sky Based Communication Industry Volume (Billion) Forecast, by Application 2020 & 2033
- Table 19: Canada Sky Based Communication Industry Revenue (Million) Forecast, by Application 2020 & 2033
- Table 20: Canada Sky Based Communication Industry Volume (Billion) Forecast, by Application 2020 & 2033
- Table 21: Global Sky Based Communication Industry Revenue Million Forecast, by Application 2020 & 2033
- Table 22: Global Sky Based Communication Industry Volume Billion Forecast, by Application 2020 & 2033
- Table 23: Global Sky Based Communication Industry Revenue Million Forecast, by Type 2020 & 2033
- Table 24: Global Sky Based Communication Industry Volume Billion Forecast, by Type 2020 & 2033
- Table 25: Global Sky Based Communication Industry Revenue Million Forecast, by End User 2020 & 2033
- Table 26: Global Sky Based Communication Industry Volume Billion Forecast, by End User 2020 & 2033
- Table 27: Global Sky Based Communication Industry Revenue Million Forecast, by Country 2020 & 2033
- Table 28: Global Sky Based Communication Industry Volume Billion Forecast, by Country 2020 & 2033
- Table 29: United Kingdom Sky Based Communication Industry Revenue (Million) Forecast, by Application 2020 & 2033
- Table 30: United Kingdom Sky Based Communication Industry Volume (Billion) Forecast, by Application 2020 & 2033
- Table 31: France Sky Based Communication Industry Revenue (Million) Forecast, by Application 2020 & 2033
- Table 32: France Sky Based Communication Industry Volume (Billion) Forecast, by Application 2020 & 2033
- Table 33: Germany Sky Based Communication Industry Revenue (Million) Forecast, by Application 2020 & 2033
- Table 34: Germany Sky Based Communication Industry Volume (Billion) Forecast, by Application 2020 & 2033
- Table 35: Russia Sky Based Communication Industry Revenue (Million) Forecast, by Application 2020 & 2033
- Table 36: Russia Sky Based Communication Industry Volume (Billion) Forecast, by Application 2020 & 2033
- Table 37: Rest of Europe Sky Based Communication Industry Revenue (Million) Forecast, by Application 2020 & 2033
- Table 38: Rest of Europe Sky Based Communication Industry Volume (Billion) Forecast, by Application 2020 & 2033
- Table 39: Global Sky Based Communication Industry Revenue Million Forecast, by Application 2020 & 2033
- Table 40: Global Sky Based Communication Industry Volume Billion Forecast, by Application 2020 & 2033
- Table 41: Global Sky Based Communication Industry Revenue Million Forecast, by Type 2020 & 2033
- Table 42: Global Sky Based Communication Industry Volume Billion Forecast, by Type 2020 & 2033
- Table 43: Global Sky Based Communication Industry Revenue Million Forecast, by End User 2020 & 2033
- Table 44: Global Sky Based Communication Industry Volume Billion Forecast, by End User 2020 & 2033
- Table 45: Global Sky Based Communication Industry Revenue Million Forecast, by Country 2020 & 2033
- Table 46: Global Sky Based Communication Industry Volume Billion Forecast, by Country 2020 & 2033
- Table 47: India Sky Based Communication Industry Revenue (Million) Forecast, by Application 2020 & 2033
- Table 48: India Sky Based Communication Industry Volume (Billion) Forecast, by Application 2020 & 2033
- Table 49: China Sky Based Communication Industry Revenue (Million) Forecast, by Application 2020 & 2033
- Table 50: China Sky Based Communication Industry Volume (Billion) Forecast, by Application 2020 & 2033
- Table 51: Japan Sky Based Communication Industry Revenue (Million) Forecast, by Application 2020 & 2033
- Table 52: Japan Sky Based Communication Industry Volume (Billion) Forecast, by Application 2020 & 2033
- Table 53: South Korea Sky Based Communication Industry Revenue (Million) Forecast, by Application 2020 & 2033
- Table 54: South Korea Sky Based Communication Industry Volume (Billion) Forecast, by Application 2020 & 2033
- Table 55: Rest of Asia Pacific Sky Based Communication Industry Revenue (Million) Forecast, by Application 2020 & 2033
- Table 56: Rest of Asia Pacific Sky Based Communication Industry Volume (Billion) Forecast, by Application 2020 & 2033
- Table 57: Global Sky Based Communication Industry Revenue Million Forecast, by Application 2020 & 2033
- Table 58: Global Sky Based Communication Industry Volume Billion Forecast, by Application 2020 & 2033
- Table 59: Global Sky Based Communication Industry Revenue Million Forecast, by Type 2020 & 2033
- Table 60: Global Sky Based Communication Industry Volume Billion Forecast, by Type 2020 & 2033
- Table 61: Global Sky Based Communication Industry Revenue Million Forecast, by End User 2020 & 2033
- Table 62: Global Sky Based Communication Industry Volume Billion Forecast, by End User 2020 & 2033
- Table 63: Global Sky Based Communication Industry Revenue Million Forecast, by Country 2020 & 2033
- Table 64: Global Sky Based Communication Industry Volume Billion Forecast, by Country 2020 & 2033
- Table 65: Brazil Sky Based Communication Industry Revenue (Million) Forecast, by Application 2020 & 2033
- Table 66: Brazil Sky Based Communication Industry Volume (Billion) Forecast, by Application 2020 & 2033
- Table 67: Rest of Latin America Sky Based Communication Industry Revenue (Million) Forecast, by Application 2020 & 2033
- Table 68: Rest of Latin America Sky Based Communication Industry Volume (Billion) Forecast, by Application 2020 & 2033
- Table 69: Global Sky Based Communication Industry Revenue Million Forecast, by Application 2020 & 2033
- Table 70: Global Sky Based Communication Industry Volume Billion Forecast, by Application 2020 & 2033
- Table 71: Global Sky Based Communication Industry Revenue Million Forecast, by Type 2020 & 2033
- Table 72: Global Sky Based Communication Industry Volume Billion Forecast, by Type 2020 & 2033
- Table 73: Global Sky Based Communication Industry Revenue Million Forecast, by End User 2020 & 2033
- Table 74: Global Sky Based Communication Industry Volume Billion Forecast, by End User 2020 & 2033
- Table 75: Global Sky Based Communication Industry Revenue Million Forecast, by Country 2020 & 2033
- Table 76: Global Sky Based Communication Industry Volume Billion Forecast, by Country 2020 & 2033
- Table 77: United Arab Emirates Sky Based Communication Industry Revenue (Million) Forecast, by Application 2020 & 2033
- Table 78: United Arab Emirates Sky Based Communication Industry Volume (Billion) Forecast, by Application 2020 & 2033
- Table 79: Saudi Arabia Sky Based Communication Industry Revenue (Million) Forecast, by Application 2020 & 2033
- Table 80: Saudi Arabia Sky Based Communication Industry Volume (Billion) Forecast, by Application 2020 & 2033
- Table 81: Israel Sky Based Communication Industry Revenue (Million) Forecast, by Application 2020 & 2033
- Table 82: Israel Sky Based Communication Industry Volume (Billion) Forecast, by Application 2020 & 2033
- Table 83: Rest of Middle East and Africa Sky Based Communication Industry Revenue (Million) Forecast, by Application 2020 & 2033
- Table 84: Rest of Middle East and Africa Sky Based Communication Industry Volume (Billion) Forecast, by Application 2020 & 2033
Frequently Asked Questions
1. What is the projected Compound Annual Growth Rate (CAGR) of the Sky Based Communication Industry?
The projected CAGR is approximately 25.53%.
2. Which companies are prominent players in the Sky Based Communication Industry?
Key companies in the market include Airbus SE, Cobham Limited, Honeywell International Inc, Intelsat, L3Harris Technologies Inc, Maxar Technologies Inc, THALES, Viasat Inc, Inmarsat Global Limited, Iridium Communications Inc.
3. What are the main segments of the Sky Based Communication Industry?
The market segments include Application, Type, End User.
4. Can you provide details about the market size?
The market size is estimated to be USD 136.81 Million as of 2022.
5. What are some drivers contributing to market growth?
N/A
6. What are the notable trends driving market growth?
The Low Earth Orbit (LEO) Segment is Expected to Dominate the Market During the Forecast Period.
7. Are there any restraints impacting market growth?
N/A
8. Can you provide examples of recent developments in the market?
February 2024: Northrop Grumman awarded Viasat Inc. a contract to bolster the US Air Force Research Laboratory (AFRL) initiative. Under this agreement, Viasat will deploy its ViaSat-3 Satellite Communications Network, facilitating seamless, high-bandwidth satellite internet access for military personnel aboard USAF aircraft and ground vehicles.
9. What pricing options are available for accessing the report?
Pricing options include single-user, multi-user, and enterprise licenses priced at USD 4750, USD 5250, and USD 8750 respectively.
10. Is the market size provided in terms of value or volume?
The market size is provided in terms of value, measured in Million and volume, measured in Billion.
11. Are there any specific market keywords associated with the report?
Yes, the market keyword associated with the report is "Sky Based Communication Industry," which aids in identifying and referencing the specific market segment covered.
12. How do I determine which pricing option suits my needs best?
The pricing options vary based on user requirements and access needs. Individual users may opt for single-user licenses, while businesses requiring broader access may choose multi-user or enterprise licenses for cost-effective access to the report.
13. Are there any additional resources or data provided in the Sky Based Communication Industry report?
While the report offers comprehensive insights, it's advisable to review the specific contents or supplementary materials provided to ascertain if additional resources or data are available.
14. How can I stay updated on further developments or reports in the Sky Based Communication Industry?
To stay informed about further developments, trends, and reports in the Sky Based Communication Industry, consider subscribing to industry newsletters, following relevant companies and organizations, or regularly checking reputable industry news sources and publications.
Methodology
Step 1 - Identification of Relevant Samples Size from Population Database


Step 2 - Approaches for Defining Global Market Size (Value, Volume* & Price*)

Note*: In applicable scenarios
Step 3 - Data Sources
Primary Research
- Web Analytics
- Survey Reports
- Research Institute
- Latest Research Reports
- Opinion Leaders
Secondary Research
- Annual Reports
- White Paper
- Latest Press Release
- Industry Association
- Paid Database
- Investor Presentations

Step 4 - Data Triangulation
Involves using different sources of information in order to increase the validity of a study
These sources are likely to be stakeholders in a program - participants, other researchers, program staff, other community members, and so on.
Then we put all data in single framework & apply various statistical tools to find out the dynamic on the market.
During the analysis stage, feedback from the stakeholder groups would be compared to determine areas of agreement as well as areas of divergence