


Key Insights
The Stereolithography (SLA) 3D printing market is poised for substantial expansion, propelled by escalating adoption across key industries including healthcare, aerospace, and automotive. This growth is attributed to SLA's superior capability in producing high-precision parts with exceptional surface finish, making it ideal for rapid prototyping and niche production runs. Key growth catalysts include innovations in resin materials, enhanced printer accuracy, and a growing demand for customized solutions. While initial investment costs present a challenge for smaller enterprises, the long-term economic benefits and efficiency gains are increasingly attractive, further supported by advanced software optimizing workflows and reducing production cycles. Intense competition among leading providers such as Stratasys, 3D Systems, and Formlabs is fostering continuous innovation and price competitiveness, democratizing SLA technology's accessibility.
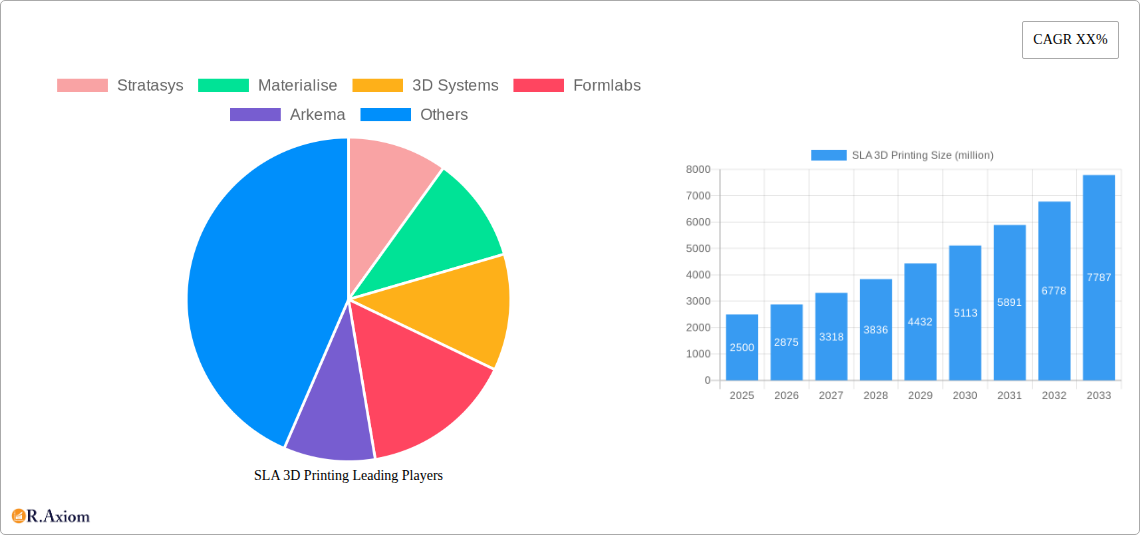
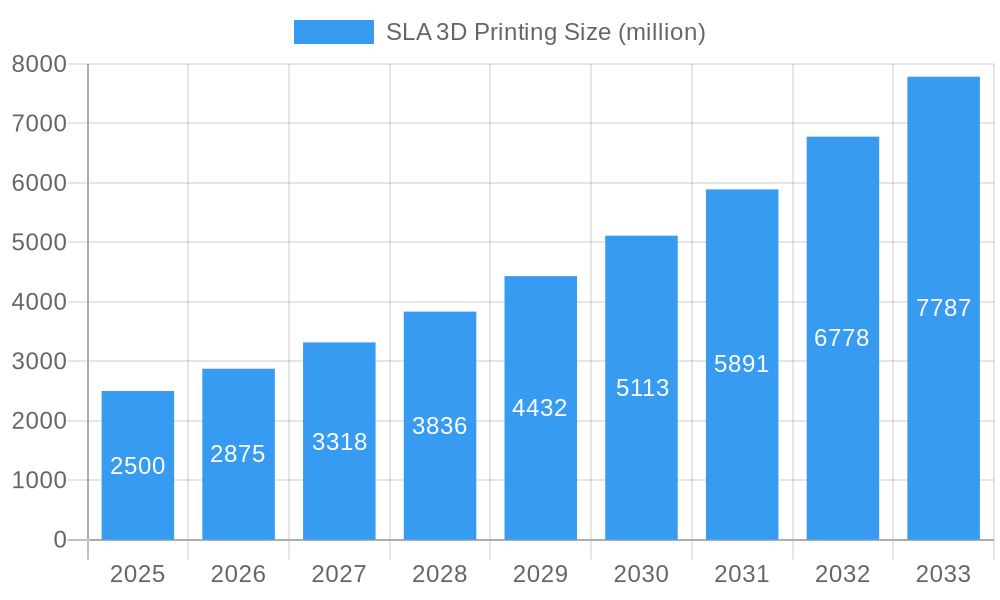
SLA 3D Printing Market Size (In Billion)

We project a robust Compound Annual Growth Rate (CAGR) of 17.2% for the SLA 3D printing market. The market size was valued at $16.16 billion in the base year 2025 and is expected to witness significant growth through 2033. The healthcare sector, particularly in dental applications and medical device manufacturing, is anticipated to be a primary growth engine, driven by the increasing need for personalized medical treatments and surgical planning. Challenges such as comparatively slower printing speeds and the requirement for post-processing may present minor headwinds. However, ongoing technological advancements aimed at mitigating these limitations, coupled with expanding application diversity, ensure a positive and sustained market trajectory. The competitive landscape remains vibrant, characterized by strategic alliances, technological breakthroughs, and geographical expansion efforts by both established and emerging players.
SLA 3D Printing Company Market Share
This detailed market analysis provides critical insights into the SLA 3D printing sector, serving as an essential resource for stakeholders, investors, and businesses navigating this dynamic market. The report offers comprehensive coverage of the period 2019-2033, with a specific focus on the forecast period 2025-2033, using 2025 as the base year. Key market participants analyzed include Stratasys, Materialise, 3D Systems, Formlabs, Arkema, Protolabs, Ultimaker, and Markforged.
SLA 3D Printing Market Concentration & Innovation
This section analyzes the competitive landscape of the SLA 3D printing market, examining market concentration, innovation drivers, regulatory frameworks, product substitutes, end-user trends, and mergers and acquisitions (M&A) activities.
The market exhibits a moderately concentrated structure, with the top five players holding an estimated xx% market share in 2025. Innovation is driven by advancements in resin materials, increased printing speed and resolution, and the development of software solutions for design and workflow optimization. Regulatory frameworks, particularly concerning material safety and environmental impact, influence market growth. The primary substitute for SLA 3D printing is other additive manufacturing technologies, such as FDM and SLS, each vying for market share. End-user trends indicate a growing demand for customized and complex parts across various sectors. M&A activity in the past five years has involved deals valued at over xx million USD, contributing to market consolidation.
- Market Share (2025): Top 5 players: xx%
- M&A Deal Value (2019-2024): Over xx million USD
- Key Innovation Drivers: Resin material advancements, enhanced printing speed and resolution, sophisticated software solutions.
SLA 3D Printing Industry Trends & Insights
This section delves into the key trends and insights shaping the SLA 3D printing market, focusing on market growth drivers, technological disruptions, consumer preferences, and competitive dynamics. The market is experiencing robust growth, fueled by increasing demand across diverse sectors, including healthcare, aerospace, automotive, and consumer goods. Technological advancements, particularly in resin technology and printing speed, contribute significantly to market expansion. Consumer preferences are shifting towards high-precision, intricate parts, driving the adoption of SLA 3D printing. The competitive landscape is dynamic, with existing players investing heavily in R&D and new entrants emerging with innovative offerings. The CAGR for the SLA 3D printing market during the forecast period (2025-2033) is estimated at xx%, with market penetration expected to reach xx% by 2033.
Dominant Markets & Segments in SLA 3D Printing
This section identifies the leading regions, countries, and segments within the SLA 3D printing market.
The North American region holds the dominant position, driven by strong technological innovation, substantial investments in R&D, and a high concentration of key players. Within North America, the United States is the leading country due to its mature market, robust industrial base, and extensive adoption across various sectors. The healthcare segment is a significant driver of market growth, owing to the rising demand for customized medical devices and prosthetics. Other significant segments include aerospace and automotive.
Key Drivers in North America:
- Strong technological innovation and R&D investments
- High concentration of key players
- Mature market and robust industrial base
- Significant adoption across various sectors (healthcare, aerospace, automotive)
Dominant Segment: Healthcare
SLA 3D Printing Product Developments
Recent product developments in SLA 3D printing emphasize enhanced resin properties, increased printing speeds, and improved resolution. This leads to higher accuracy, better surface finish, and faster production cycles. The resulting competitive advantage lies in offering cost-effective, high-quality solutions catering to specific application needs. The integration of smart manufacturing technologies and AI-driven optimization further boosts efficiency and output.
Report Scope & Segmentation Analysis
This report segments the SLA 3D printing market by resin type, application, end-user industry, and geography. The resin type segment includes standard resins, high-temperature resins, biocompatible resins and others. The application segment includes prototyping, tooling, dental, medical, aerospace, and jewelry. Each segment presents distinct growth trajectories and competitive dynamics. Market size estimations and growth projections are provided for each segment, offering a granular view of market evolution.
Key Drivers of SLA 3D Printing Growth
The SLA 3D printing market's growth is fueled by technological advancements, such as the development of new resin materials with enhanced properties, improving printing speeds and resolutions. Economic factors like decreasing printing costs and rising demand for customized products also contribute. Moreover, supportive government policies and regulations promoting innovation in additive manufacturing further accelerate market expansion.
Challenges in the SLA 3D Printing Sector
Challenges include the relatively high initial investment costs of SLA 3D printers, the need for specialized skills to operate and maintain the equipment, and competition from other additive manufacturing technologies. Supply chain disruptions and the availability of skilled labor are also crucial concerns influencing market growth.
Emerging Opportunities in SLA 3D Printing
Emerging opportunities lie in the expansion into new sectors, such as personalized medicine and consumer goods, the development of new resin materials with unique functionalities, and the integration of artificial intelligence for automated workflow optimization. The increasing demand for high-precision parts in various applications presents significant growth prospects.
Leading Players in the SLA 3D Printing Market
Key Developments in SLA 3D Printing Industry
- 2022 Q4: Stratasys launched a new high-speed SLA 3D printer.
- 2023 Q1: Materialise announced a strategic partnership to expand its medical applications.
- 2023 Q2: 3D Systems acquired a company specializing in bioprinting.
- [Add further developments with year/month and impact]
Strategic Outlook for SLA 3D Printing Market
The SLA 3D printing market is poised for continued strong growth, driven by technological innovation, increasing adoption across various sectors, and favorable regulatory support. The focus on developing advanced materials and improving printing processes will be crucial for sustaining market momentum and creating new opportunities for innovation and expansion. Further market consolidation through M&A activity is expected.
SLA 3D Printing Segmentation
-
1. Application
- 1.1. Aerospace and Defense
- 1.2. Tool and Mold Making
- 1.3. Automotive
- 1.4. Healthcare
- 1.5. Academic Institutions
-
2. Types
- 2.1. Metal Printing
- 2.2. Plastics Printing
- 2.3. Ceramics Printing
SLA 3D Printing Segmentation By Geography
-
1. North America
- 1.1. United States
- 1.2. Canada
- 1.3. Mexico
-
2. South America
- 2.1. Brazil
- 2.2. Argentina
- 2.3. Rest of South America
-
3. Europe
- 3.1. United Kingdom
- 3.2. Germany
- 3.3. France
- 3.4. Italy
- 3.5. Spain
- 3.6. Russia
- 3.7. Benelux
- 3.8. Nordics
- 3.9. Rest of Europe
-
4. Middle East & Africa
- 4.1. Turkey
- 4.2. Israel
- 4.3. GCC
- 4.4. North Africa
- 4.5. South Africa
- 4.6. Rest of Middle East & Africa
-
5. Asia Pacific
- 5.1. China
- 5.2. India
- 5.3. Japan
- 5.4. South Korea
- 5.5. ASEAN
- 5.6. Oceania
- 5.7. Rest of Asia Pacific
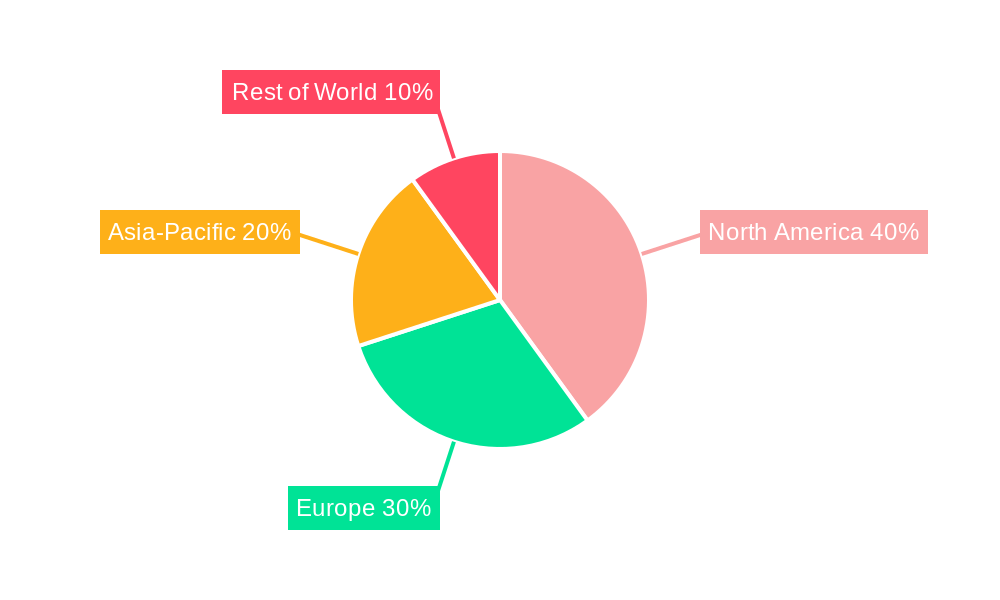
SLA 3D Printing Regional Market Share
Geographic Coverage of SLA 3D Printing
SLA 3D Printing REPORT HIGHLIGHTS
| Aspects | Details |
|---|---|
| Study Period | 2020-2034 |
| Base Year | 2025 |
| Estimated Year | 2026 |
| Forecast Period | 2026-2034 |
| Historical Period | 2020-2025 |
| Growth Rate | CAGR of 17.2% from 2020-2034 |
| Segmentation |
|
Table of Contents
- 1. Introduction
- 1.1. Research Scope
- 1.2. Market Segmentation
- 1.3. Research Methodology
- 1.4. Definitions and Assumptions
- 2. Executive Summary
- 2.1. Introduction
- 3. Market Dynamics
- 3.1. Introduction
- 3.2. Market Drivers
- 3.3. Market Restrains
- 3.4. Market Trends
- 4. Market Factor Analysis
- 4.1. Porters Five Forces
- 4.2. Supply/Value Chain
- 4.3. PESTEL analysis
- 4.4. Market Entropy
- 4.5. Patent/Trademark Analysis
- 5. Global SLA 3D Printing Analysis, Insights and Forecast, 2020-2032
- 5.1. Market Analysis, Insights and Forecast - by Application
- 5.1.1. Aerospace and Defense
- 5.1.2. Tool and Mold Making
- 5.1.3. Automotive
- 5.1.4. Healthcare
- 5.1.5. Academic Institutions
- 5.2. Market Analysis, Insights and Forecast - by Types
- 5.2.1. Metal Printing
- 5.2.2. Plastics Printing
- 5.2.3. Ceramics Printing
- 5.3. Market Analysis, Insights and Forecast - by Region
- 5.3.1. North America
- 5.3.2. South America
- 5.3.3. Europe
- 5.3.4. Middle East & Africa
- 5.3.5. Asia Pacific
- 5.1. Market Analysis, Insights and Forecast - by Application
- 6. North America SLA 3D Printing Analysis, Insights and Forecast, 2020-2032
- 6.1. Market Analysis, Insights and Forecast - by Application
- 6.1.1. Aerospace and Defense
- 6.1.2. Tool and Mold Making
- 6.1.3. Automotive
- 6.1.4. Healthcare
- 6.1.5. Academic Institutions
- 6.2. Market Analysis, Insights and Forecast - by Types
- 6.2.1. Metal Printing
- 6.2.2. Plastics Printing
- 6.2.3. Ceramics Printing
- 6.1. Market Analysis, Insights and Forecast - by Application
- 7. South America SLA 3D Printing Analysis, Insights and Forecast, 2020-2032
- 7.1. Market Analysis, Insights and Forecast - by Application
- 7.1.1. Aerospace and Defense
- 7.1.2. Tool and Mold Making
- 7.1.3. Automotive
- 7.1.4. Healthcare
- 7.1.5. Academic Institutions
- 7.2. Market Analysis, Insights and Forecast - by Types
- 7.2.1. Metal Printing
- 7.2.2. Plastics Printing
- 7.2.3. Ceramics Printing
- 7.1. Market Analysis, Insights and Forecast - by Application
- 8. Europe SLA 3D Printing Analysis, Insights and Forecast, 2020-2032
- 8.1. Market Analysis, Insights and Forecast - by Application
- 8.1.1. Aerospace and Defense
- 8.1.2. Tool and Mold Making
- 8.1.3. Automotive
- 8.1.4. Healthcare
- 8.1.5. Academic Institutions
- 8.2. Market Analysis, Insights and Forecast - by Types
- 8.2.1. Metal Printing
- 8.2.2. Plastics Printing
- 8.2.3. Ceramics Printing
- 8.1. Market Analysis, Insights and Forecast - by Application
- 9. Middle East & Africa SLA 3D Printing Analysis, Insights and Forecast, 2020-2032
- 9.1. Market Analysis, Insights and Forecast - by Application
- 9.1.1. Aerospace and Defense
- 9.1.2. Tool and Mold Making
- 9.1.3. Automotive
- 9.1.4. Healthcare
- 9.1.5. Academic Institutions
- 9.2. Market Analysis, Insights and Forecast - by Types
- 9.2.1. Metal Printing
- 9.2.2. Plastics Printing
- 9.2.3. Ceramics Printing
- 9.1. Market Analysis, Insights and Forecast - by Application
- 10. Asia Pacific SLA 3D Printing Analysis, Insights and Forecast, 2020-2032
- 10.1. Market Analysis, Insights and Forecast - by Application
- 10.1.1. Aerospace and Defense
- 10.1.2. Tool and Mold Making
- 10.1.3. Automotive
- 10.1.4. Healthcare
- 10.1.5. Academic Institutions
- 10.2. Market Analysis, Insights and Forecast - by Types
- 10.2.1. Metal Printing
- 10.2.2. Plastics Printing
- 10.2.3. Ceramics Printing
- 10.1. Market Analysis, Insights and Forecast - by Application
- 11. Competitive Analysis
- 11.1. Global Market Share Analysis 2025
- 11.2. Company Profiles
- 11.2.1 Stratasys
- 11.2.1.1. Overview
- 11.2.1.2. Products
- 11.2.1.3. SWOT Analysis
- 11.2.1.4. Recent Developments
- 11.2.1.5. Financials (Based on Availability)
- 11.2.2 Materialise
- 11.2.2.1. Overview
- 11.2.2.2. Products
- 11.2.2.3. SWOT Analysis
- 11.2.2.4. Recent Developments
- 11.2.2.5. Financials (Based on Availability)
- 11.2.3 3D Systems
- 11.2.3.1. Overview
- 11.2.3.2. Products
- 11.2.3.3. SWOT Analysis
- 11.2.3.4. Recent Developments
- 11.2.3.5. Financials (Based on Availability)
- 11.2.4 Formlabs
- 11.2.4.1. Overview
- 11.2.4.2. Products
- 11.2.4.3. SWOT Analysis
- 11.2.4.4. Recent Developments
- 11.2.4.5. Financials (Based on Availability)
- 11.2.5 Arkema
- 11.2.5.1. Overview
- 11.2.5.2. Products
- 11.2.5.3. SWOT Analysis
- 11.2.5.4. Recent Developments
- 11.2.5.5. Financials (Based on Availability)
- 11.2.6 Protolabs
- 11.2.6.1. Overview
- 11.2.6.2. Products
- 11.2.6.3. SWOT Analysis
- 11.2.6.4. Recent Developments
- 11.2.6.5. Financials (Based on Availability)
- 11.2.7 Ultimaker
- 11.2.7.1. Overview
- 11.2.7.2. Products
- 11.2.7.3. SWOT Analysis
- 11.2.7.4. Recent Developments
- 11.2.7.5. Financials (Based on Availability)
- 11.2.8 Markforged
- 11.2.8.1. Overview
- 11.2.8.2. Products
- 11.2.8.3. SWOT Analysis
- 11.2.8.4. Recent Developments
- 11.2.8.5. Financials (Based on Availability)
- 11.2.1 Stratasys
List of Figures
- Figure 1: Global SLA 3D Printing Revenue Breakdown (billion, %) by Region 2025 & 2033
- Figure 2: North America SLA 3D Printing Revenue (billion), by Application 2025 & 2033
- Figure 3: North America SLA 3D Printing Revenue Share (%), by Application 2025 & 2033
- Figure 4: North America SLA 3D Printing Revenue (billion), by Types 2025 & 2033
- Figure 5: North America SLA 3D Printing Revenue Share (%), by Types 2025 & 2033
- Figure 6: North America SLA 3D Printing Revenue (billion), by Country 2025 & 2033
- Figure 7: North America SLA 3D Printing Revenue Share (%), by Country 2025 & 2033
- Figure 8: South America SLA 3D Printing Revenue (billion), by Application 2025 & 2033
- Figure 9: South America SLA 3D Printing Revenue Share (%), by Application 2025 & 2033
- Figure 10: South America SLA 3D Printing Revenue (billion), by Types 2025 & 2033
- Figure 11: South America SLA 3D Printing Revenue Share (%), by Types 2025 & 2033
- Figure 12: South America SLA 3D Printing Revenue (billion), by Country 2025 & 2033
- Figure 13: South America SLA 3D Printing Revenue Share (%), by Country 2025 & 2033
- Figure 14: Europe SLA 3D Printing Revenue (billion), by Application 2025 & 2033
- Figure 15: Europe SLA 3D Printing Revenue Share (%), by Application 2025 & 2033
- Figure 16: Europe SLA 3D Printing Revenue (billion), by Types 2025 & 2033
- Figure 17: Europe SLA 3D Printing Revenue Share (%), by Types 2025 & 2033
- Figure 18: Europe SLA 3D Printing Revenue (billion), by Country 2025 & 2033
- Figure 19: Europe SLA 3D Printing Revenue Share (%), by Country 2025 & 2033
- Figure 20: Middle East & Africa SLA 3D Printing Revenue (billion), by Application 2025 & 2033
- Figure 21: Middle East & Africa SLA 3D Printing Revenue Share (%), by Application 2025 & 2033
- Figure 22: Middle East & Africa SLA 3D Printing Revenue (billion), by Types 2025 & 2033
- Figure 23: Middle East & Africa SLA 3D Printing Revenue Share (%), by Types 2025 & 2033
- Figure 24: Middle East & Africa SLA 3D Printing Revenue (billion), by Country 2025 & 2033
- Figure 25: Middle East & Africa SLA 3D Printing Revenue Share (%), by Country 2025 & 2033
- Figure 26: Asia Pacific SLA 3D Printing Revenue (billion), by Application 2025 & 2033
- Figure 27: Asia Pacific SLA 3D Printing Revenue Share (%), by Application 2025 & 2033
- Figure 28: Asia Pacific SLA 3D Printing Revenue (billion), by Types 2025 & 2033
- Figure 29: Asia Pacific SLA 3D Printing Revenue Share (%), by Types 2025 & 2033
- Figure 30: Asia Pacific SLA 3D Printing Revenue (billion), by Country 2025 & 2033
- Figure 31: Asia Pacific SLA 3D Printing Revenue Share (%), by Country 2025 & 2033
List of Tables
- Table 1: Global SLA 3D Printing Revenue billion Forecast, by Application 2020 & 2033
- Table 2: Global SLA 3D Printing Revenue billion Forecast, by Types 2020 & 2033
- Table 3: Global SLA 3D Printing Revenue billion Forecast, by Region 2020 & 2033
- Table 4: Global SLA 3D Printing Revenue billion Forecast, by Application 2020 & 2033
- Table 5: Global SLA 3D Printing Revenue billion Forecast, by Types 2020 & 2033
- Table 6: Global SLA 3D Printing Revenue billion Forecast, by Country 2020 & 2033
- Table 7: United States SLA 3D Printing Revenue (billion) Forecast, by Application 2020 & 2033
- Table 8: Canada SLA 3D Printing Revenue (billion) Forecast, by Application 2020 & 2033
- Table 9: Mexico SLA 3D Printing Revenue (billion) Forecast, by Application 2020 & 2033
- Table 10: Global SLA 3D Printing Revenue billion Forecast, by Application 2020 & 2033
- Table 11: Global SLA 3D Printing Revenue billion Forecast, by Types 2020 & 2033
- Table 12: Global SLA 3D Printing Revenue billion Forecast, by Country 2020 & 2033
- Table 13: Brazil SLA 3D Printing Revenue (billion) Forecast, by Application 2020 & 2033
- Table 14: Argentina SLA 3D Printing Revenue (billion) Forecast, by Application 2020 & 2033
- Table 15: Rest of South America SLA 3D Printing Revenue (billion) Forecast, by Application 2020 & 2033
- Table 16: Global SLA 3D Printing Revenue billion Forecast, by Application 2020 & 2033
- Table 17: Global SLA 3D Printing Revenue billion Forecast, by Types 2020 & 2033
- Table 18: Global SLA 3D Printing Revenue billion Forecast, by Country 2020 & 2033
- Table 19: United Kingdom SLA 3D Printing Revenue (billion) Forecast, by Application 2020 & 2033
- Table 20: Germany SLA 3D Printing Revenue (billion) Forecast, by Application 2020 & 2033
- Table 21: France SLA 3D Printing Revenue (billion) Forecast, by Application 2020 & 2033
- Table 22: Italy SLA 3D Printing Revenue (billion) Forecast, by Application 2020 & 2033
- Table 23: Spain SLA 3D Printing Revenue (billion) Forecast, by Application 2020 & 2033
- Table 24: Russia SLA 3D Printing Revenue (billion) Forecast, by Application 2020 & 2033
- Table 25: Benelux SLA 3D Printing Revenue (billion) Forecast, by Application 2020 & 2033
- Table 26: Nordics SLA 3D Printing Revenue (billion) Forecast, by Application 2020 & 2033
- Table 27: Rest of Europe SLA 3D Printing Revenue (billion) Forecast, by Application 2020 & 2033
- Table 28: Global SLA 3D Printing Revenue billion Forecast, by Application 2020 & 2033
- Table 29: Global SLA 3D Printing Revenue billion Forecast, by Types 2020 & 2033
- Table 30: Global SLA 3D Printing Revenue billion Forecast, by Country 2020 & 2033
- Table 31: Turkey SLA 3D Printing Revenue (billion) Forecast, by Application 2020 & 2033
- Table 32: Israel SLA 3D Printing Revenue (billion) Forecast, by Application 2020 & 2033
- Table 33: GCC SLA 3D Printing Revenue (billion) Forecast, by Application 2020 & 2033
- Table 34: North Africa SLA 3D Printing Revenue (billion) Forecast, by Application 2020 & 2033
- Table 35: South Africa SLA 3D Printing Revenue (billion) Forecast, by Application 2020 & 2033
- Table 36: Rest of Middle East & Africa SLA 3D Printing Revenue (billion) Forecast, by Application 2020 & 2033
- Table 37: Global SLA 3D Printing Revenue billion Forecast, by Application 2020 & 2033
- Table 38: Global SLA 3D Printing Revenue billion Forecast, by Types 2020 & 2033
- Table 39: Global SLA 3D Printing Revenue billion Forecast, by Country 2020 & 2033
- Table 40: China SLA 3D Printing Revenue (billion) Forecast, by Application 2020 & 2033
- Table 41: India SLA 3D Printing Revenue (billion) Forecast, by Application 2020 & 2033
- Table 42: Japan SLA 3D Printing Revenue (billion) Forecast, by Application 2020 & 2033
- Table 43: South Korea SLA 3D Printing Revenue (billion) Forecast, by Application 2020 & 2033
- Table 44: ASEAN SLA 3D Printing Revenue (billion) Forecast, by Application 2020 & 2033
- Table 45: Oceania SLA 3D Printing Revenue (billion) Forecast, by Application 2020 & 2033
- Table 46: Rest of Asia Pacific SLA 3D Printing Revenue (billion) Forecast, by Application 2020 & 2033
Frequently Asked Questions
1. What is the projected Compound Annual Growth Rate (CAGR) of the SLA 3D Printing?
The projected CAGR is approximately 17.2%.
2. Which companies are prominent players in the SLA 3D Printing?
Key companies in the market include Stratasys, Materialise, 3D Systems, Formlabs, Arkema, Protolabs, Ultimaker, Markforged.
3. What are the main segments of the SLA 3D Printing?
The market segments include Application, Types.
4. Can you provide details about the market size?
The market size is estimated to be USD 16.16 billion as of 2022.
5. What are some drivers contributing to market growth?
N/A
6. What are the notable trends driving market growth?
N/A
7. Are there any restraints impacting market growth?
N/A
8. Can you provide examples of recent developments in the market?
N/A
9. What pricing options are available for accessing the report?
Pricing options include single-user, multi-user, and enterprise licenses priced at USD 2900.00, USD 4350.00, and USD 5800.00 respectively.
10. Is the market size provided in terms of value or volume?
The market size is provided in terms of value, measured in billion.
11. Are there any specific market keywords associated with the report?
Yes, the market keyword associated with the report is "SLA 3D Printing," which aids in identifying and referencing the specific market segment covered.
12. How do I determine which pricing option suits my needs best?
The pricing options vary based on user requirements and access needs. Individual users may opt for single-user licenses, while businesses requiring broader access may choose multi-user or enterprise licenses for cost-effective access to the report.
13. Are there any additional resources or data provided in the SLA 3D Printing report?
While the report offers comprehensive insights, it's advisable to review the specific contents or supplementary materials provided to ascertain if additional resources or data are available.
14. How can I stay updated on further developments or reports in the SLA 3D Printing?
To stay informed about further developments, trends, and reports in the SLA 3D Printing, consider subscribing to industry newsletters, following relevant companies and organizations, or regularly checking reputable industry news sources and publications.
Methodology
Step 1 - Identification of Relevant Samples Size from Population Database


Step 2 - Approaches for Defining Global Market Size (Value, Volume* & Price*)

Note*: In applicable scenarios
Step 3 - Data Sources
Primary Research
- Web Analytics
- Survey Reports
- Research Institute
- Latest Research Reports
- Opinion Leaders
Secondary Research
- Annual Reports
- White Paper
- Latest Press Release
- Industry Association
- Paid Database
- Investor Presentations

Step 4 - Data Triangulation
Involves using different sources of information in order to increase the validity of a study
These sources are likely to be stakeholders in a program - participants, other researchers, program staff, other community members, and so on.
Then we put all data in single framework & apply various statistical tools to find out the dynamic on the market.
During the analysis stage, feedback from the stakeholder groups would be compared to determine areas of agreement as well as areas of divergence