

Key Insights
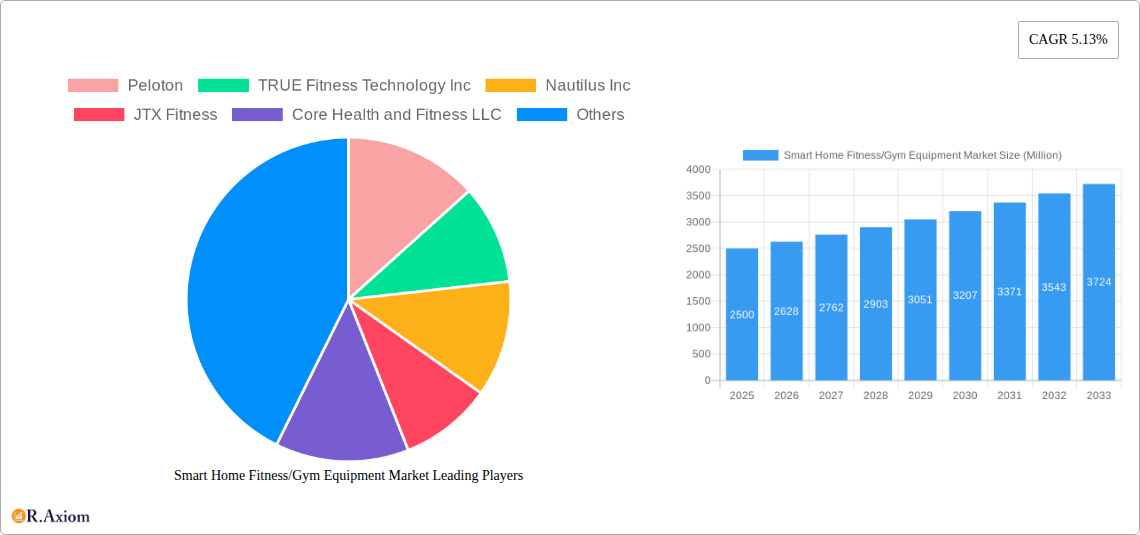
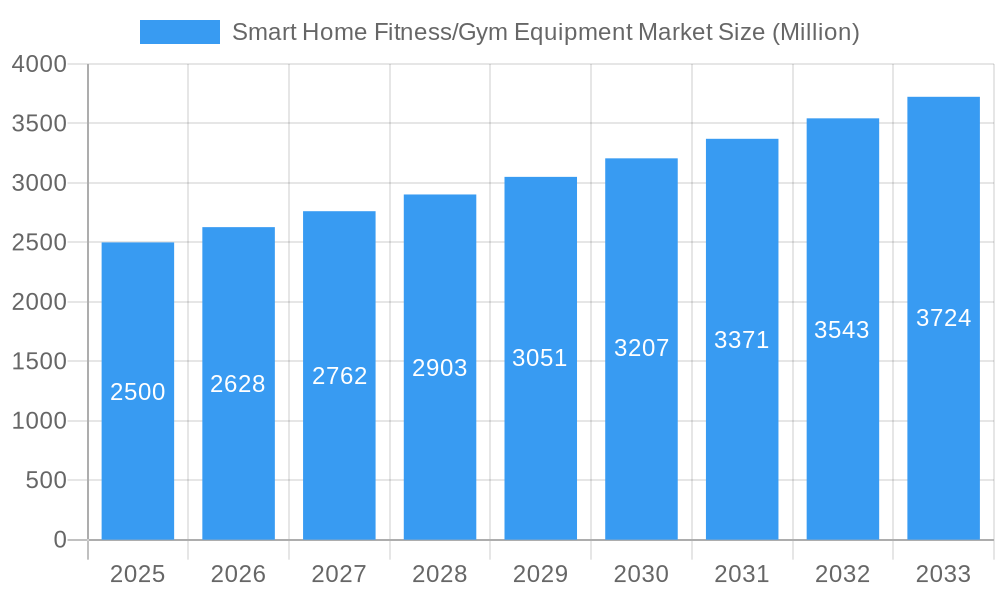
The global smart home fitness/gym equipment market, valued at $2.5 billion in 2025, is projected to experience robust growth, driven by several key factors. The increasing prevalence of sedentary lifestyles, coupled with rising health consciousness and the convenience of at-home workouts, fuels significant demand. Technological advancements, such as the integration of AI, virtual reality (VR), and gamification features in fitness equipment, are enhancing user engagement and driving market expansion. Furthermore, the rising popularity of online fitness classes and personalized workout plans, facilitated by smart home equipment connectivity, contribute to this growth. The market is segmented by product type (cardiovascular and strength training equipment) and distribution channel (supermarkets/hypermarkets, specialized stores, and online platforms), with the online channel expected to witness the fastest growth due to increased accessibility and convenience. Major players like Peloton, Technogym, and ICON Health & Fitness are driving innovation and market competition through continuous product development and strategic partnerships. While initial high costs might present a restraint for some consumers, the long-term health benefits and convenience offered by smart home gym equipment are expected to offset this, leading to sustained market growth.
Smart Home Fitness/Gym Equipment Market Market Size (In Billion)
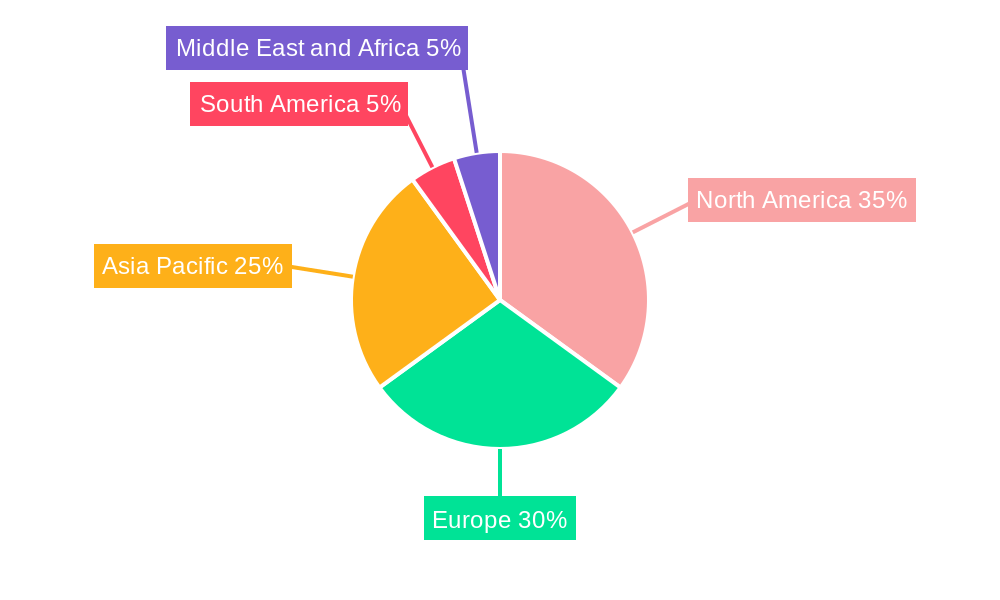
The market's regional distribution shows a diverse landscape. North America and Europe currently hold significant market shares, driven by high disposable incomes and early adoption of fitness technology. However, the Asia-Pacific region is poised for substantial growth, fueled by rising urbanization, increasing health awareness, and a growing middle class. India and China are key growth drivers within this region. Continued technological innovation, particularly focusing on affordability and accessibility, will be crucial for expanding the market in developing economies. The forecast period (2025-2033) anticipates a sustained CAGR of 5.13%, indicating a promising future for the smart home fitness/gym equipment industry, with opportunities for both established players and new entrants.
Smart Home Fitness/Gym Equipment Market Company Market Share
This comprehensive report provides an in-depth analysis of the global Smart Home Fitness/Gym Equipment market, offering valuable insights for stakeholders, investors, and industry professionals. The study period covers 2019-2033, with 2025 as the base and estimated year. The report meticulously examines market trends, competitive dynamics, technological advancements, and growth opportunities, providing a clear picture of the market's trajectory. Key players analyzed include Peloton, TRUE Fitness Technology Inc, Nautilus Inc, JTX Fitness, Core Health & Fitness LLC, Precor Inc, Tonal System Inc, Technogym, ICON Health & Fitness Inc, and Life Fitness Inc. The market is segmented by product type (Cardiovascular Training Equipment, Strength Training Equipment) and distribution channel (Supermarkets/Hypermarkets, Specialized Stores, Online, Other Distribution Channels).
Smart Home Fitness/Gym Equipment Market Concentration & Innovation
The smart home fitness equipment market exhibits a moderately concentrated landscape, with a few major players holding significant market share. However, the emergence of innovative startups and the increasing participation of established fitness brands are fostering greater competition. Market share data for 2024 reveals that the top 5 players account for approximately xx% of the total market value (USD xx Million). Peloton and ICON Health & Fitness (iFIT) are currently leading the market, primarily due to their strong brand recognition and comprehensive digital fitness platforms.
Innovation Drivers:
- Advancements in connected fitness technology, including AI-powered personal training and gamified fitness experiences.
- Integration of wearables and health tracking devices for personalized workout optimization.
- Development of compact and aesthetically pleasing equipment to suit modern living spaces.
Regulatory Frameworks:
Regulatory frameworks concerning data privacy and product safety are impacting the market. Compliance with these regulations is crucial for manufacturers.
Product Substitutes:
Traditional gym memberships and outdoor fitness activities pose a competitive threat. However, the convenience and personalization offered by smart home equipment are key differentiators.
End-User Trends:
The increasing preference for personalized fitness solutions and the growing adoption of home-based workouts are driving market growth.
M&A Activities:
The recent acquisition of Sweat by ICON Health & Fitness for USD 300 Million in February 2023 signifies a strategic move to expand the market reach and diversify offerings. Further consolidation through mergers and acquisitions is anticipated in the coming years. The total value of M&A deals in the market from 2019-2024 is estimated at USD xx Million.
Smart Home Fitness/Gym Equipment Market Industry Trends & Insights
The global smart home fitness/gym equipment market is experiencing significant growth, driven by several key factors. The market exhibited a Compound Annual Growth Rate (CAGR) of xx% during the historical period (2019-2024) and is projected to maintain a CAGR of xx% during the forecast period (2025-2033), reaching a market value of USD xx Million by 2033. This growth is propelled by several factors:
- Rising health consciousness: Growing awareness of the importance of fitness and well-being is a primary driver.
- Technological advancements: The integration of smart technology, AI, and virtual reality is enhancing user experience and engagement.
- Convenience and accessibility: Home-based fitness offers convenience, avoiding the time and cost constraints of traditional gyms.
- Increasing disposable incomes: Rising disposable incomes in several regions are enabling consumers to invest in premium fitness equipment.
- Market Penetration: Market penetration is increasing, particularly in developed economies with high internet penetration and tech-savvy consumers.
The market exhibits a dynamic competitive landscape, with established players and emerging startups vying for market share. Strategic partnerships, such as the October 2023 partnership between Lululemon and Peloton, are reshaping the competitive dynamics.
Dominant Markets & Segments in Smart Home Fitness/Gym Equipment Market
By Product Type:
The strength training equipment segment currently holds a larger market share compared to the cardiovascular training equipment segment due to the wider range of products available and the growing demand for strength-building exercises. Both segments are, however, experiencing robust growth.
By Distribution Channel:
The online distribution channel is experiencing the fastest growth, fueled by the increasing preference for online shopping and the convenience it offers. Specialized stores still retain a significant market share due to their ability to provide expert advice and hands-on product demonstrations.
Geographic Dominance:
North America currently dominates the smart home fitness equipment market, owing to high disposable incomes, tech adoption, and a health-conscious population. However, the Asia-Pacific region is expected to showcase significant growth in the coming years, driven by rising incomes and increasing fitness awareness.
- Key Drivers for North America: Strong economic conditions, high levels of disposable income, high adoption of technology, and well-established e-commerce infrastructure.
- Key Drivers for Asia-Pacific: Rapid economic growth, rising middle class, increasing health awareness, and expanding internet penetration.
Smart Home Fitness/Gym Equipment Market Product Developments
Recent product innovations include the integration of AI-powered personal trainers, virtual reality fitness experiences, and enhanced connectivity features with fitness tracking apps. This focus on personalized and engaging workouts is a significant competitive advantage, attracting a wider range of consumers. The trend towards compact, space-saving designs is also gaining traction in response to the needs of urban living.
Report Scope & Segmentation Analysis
By Product Type:
Cardiovascular Training Equipment: This segment includes treadmills, stationary bikes, ellipticals, rowing machines, etc. The market size is estimated at USD xx Million in 2025, projected to grow at a CAGR of xx% during the forecast period. Competition is intense, with several major players offering innovative products.
Strength Training Equipment: This segment includes smart weight systems, resistance bands, adjustable dumbbells, and other strength training tools. The market size is estimated at USD xx Million in 2025, and is expected to grow at a CAGR of xx% during the forecast period. Competition is strong, with established players and new entrants innovating constantly.
By Distribution Channel:
Supermarkets/Hypermarkets: This channel offers limited options, primarily focusing on low-cost equipment, and contributing a relatively small market share.
Specialized Stores: These stores offer a wider range of equipment with expert guidance, maintaining a significant market share.
Online: The fastest-growing distribution channel, driven by convenience and increased reach.
Other Distribution Channels: This includes direct sales and other niche distribution models.
Key Drivers of Smart Home Fitness/Gym Equipment Market Growth
The market is fueled by rising health consciousness, technological advancements, the convenience of home workouts, increasing disposable incomes, and the growing popularity of personalized fitness solutions. Technological innovations such as AI-powered coaching and gamification are transforming the user experience, while the growing availability of high-speed internet is enhancing the appeal of connected fitness solutions.
Challenges in the Smart Home Fitness/Gym Equipment Market Sector
Challenges include maintaining data security and user privacy, managing supply chain complexities, and navigating evolving regulatory landscapes. Competition is intense, and the high cost of entry poses a barrier for new entrants. The market is also susceptible to cyclical economic trends, affecting consumer spending on discretionary items like fitness equipment.
Emerging Opportunities in Smart Home Fitness/Gym Equipment Market
Opportunities lie in expanding into emerging markets, developing more personalized and immersive fitness experiences using AR/VR, and leveraging data analytics to improve user engagement and provide tailored training programs. Integrating fitness equipment with smart home ecosystems and creating subscription-based fitness content services also presents significant potential.
Leading Players in the Smart Home Fitness/Gym Equipment Market Market
- Peloton
- TRUE Fitness Technology Inc
- Nautilus Inc
- JTX Fitness
- Core Health and Fitness LLC
- Precor Inc
- Tonal System Inc
- Technogym
- ICON Health & Fitness Inc
- Life Fitness Inc
Key Developments in Smart Home Fitness/Gym Equipment Market Industry
October 2023: Lululemon partners with Peloton in a five-year deal encompassing content, apparel, and community initiatives. Lululemon discontinued its mirror-connected fitness service. This partnership signifies a significant shift in the connected fitness landscape, indicating potential consolidation and strategic alliances within the industry.
February 2023: iFIT (ICON Health & Fitness) acquired Sweat, a women's health platform, for USD 300 Million. This acquisition demonstrates a strategic move towards expanding the target audience and enhancing the company's overall fitness offering.
Strategic Outlook for Smart Home Fitness/Gym Equipment Market Market
The smart home fitness equipment market is poised for continued growth, driven by technological innovation, evolving consumer preferences, and expanding global reach. The focus on personalization, integration with smart home ecosystems, and the provision of engaging fitness content will be key success factors for companies in this dynamic market. The market is expected to witness further consolidation through mergers and acquisitions, leading to a more concentrated yet innovative landscape in the coming years.
Smart Home Fitness/Gym Equipment Market Segmentation
-
1. Product Type
- 1.1. Cardiovascular Training Equipment
- 1.2. Strength Training Equipment
-
2. Distribution Channel
- 2.1. Supermarkets/Hypermarkets
- 2.2. Specialized Stores
- 2.3. Online
- 2.4. Other Distribution Channels
Smart Home Fitness/Gym Equipment Market Segmentation By Geography
-
1. Asia Pacific
- 1.1. India
- 1.2. China
- 1.3. Japan
- 1.4. Australia
- 1.5. Rest of Asia Pacific
-
2. North America
- 2.1. United States
- 2.2. Mexico
- 2.3. Rest of North America
-
3. Europe
- 3.1. Germany
- 3.2. United Kingdom
- 3.3. France
- 3.4. Russia
- 3.5. Rest of Europe
-
4. South America
- 4.1. Brazil
- 4.2. Argentina
- 4.3. Rest of South America
-
5. Middle East and Africa
- 5.1. United Arab Emirates
- 5.2. South Africa
- 5.3. Rest of Middle East and Africa
Smart Home Fitness/Gym Equipment Market Regional Market Share
Geographic Coverage of Smart Home Fitness/Gym Equipment Market
Smart Home Fitness/Gym Equipment Market REPORT HIGHLIGHTS
| Aspects | Details |
|---|---|
| Study Period | 2020-2034 |
| Base Year | 2025 |
| Estimated Year | 2026 |
| Forecast Period | 2026-2034 |
| Historical Period | 2020-2025 |
| Growth Rate | CAGR of 5.13% from 2020-2034 |
| Segmentation |
|
Table of Contents
- 1. Introduction
- 1.1. Research Scope
- 1.2. Market Segmentation
- 1.3. Research Objective
- 1.4. Definitions and Assumptions
- 2. Executive Summary
- 2.1. Market Snapshot
- 3. Market Dynamics
- 3.1. Market Drivers
- 3.2. Market Restrains
- 3.3. Market Trends
- 3.4. Market Opportunities
- 4. Market Factor Analysis
- 4.1. Porters Five Forces
- 4.1.1. Bargaining Power of Suppliers
- 4.1.2. Bargaining Power of Buyers
- 4.1.3. Threat of New Entrants
- 4.1.4. Threat of Substitutes
- 4.1.5. Competitive Rivalry
- 4.2. PESTEL analysis
- 4.3. BCG Analysis
- 4.3.1. Stars (High Growth, High Market Share)
- 4.3.2. Cash Cows (Low Growth, High Market Share)
- 4.3.3. Question Mark (High Growth, Low Market Share)
- 4.3.4. Dogs (Low Growth, Low Market Share)
- 4.4. Ansoff Matrix Analysis
- 4.5. Supply Chain Analysis
- 4.6. Regulatory Landscape
- 4.7. Current Market Potential and Opportunity Assessment (TAM–SAM–SOM Framework)
- 4.8. RAX Analyst Note
- 4.1. Porters Five Forces
- 5. Market Analysis, Insights and Forecast 2021-2033
- 5.1. Market Analysis, Insights and Forecast - by Product Type
- 5.1.1. Cardiovascular Training Equipment
- 5.1.2. Strength Training Equipment
- 5.2. Market Analysis, Insights and Forecast - by Distribution Channel
- 5.2.1. Supermarkets/Hypermarkets
- 5.2.2. Specialized Stores
- 5.2.3. Online
- 5.2.4. Other Distribution Channels
- 5.3. Market Analysis, Insights and Forecast - by Region
- 5.3.1. Asia Pacific
- 5.3.2. North America
- 5.3.3. Europe
- 5.3.4. South America
- 5.3.5. Middle East and Africa
- 5.1. Market Analysis, Insights and Forecast - by Product Type
- 6. Global Smart Home Fitness/Gym Equipment Market Analysis, Insights and Forecast, 2021-2033
- 6.1. Market Analysis, Insights and Forecast - by Product Type
- 6.1.1. Cardiovascular Training Equipment
- 6.1.2. Strength Training Equipment
- 6.2. Market Analysis, Insights and Forecast - by Distribution Channel
- 6.2.1. Supermarkets/Hypermarkets
- 6.2.2. Specialized Stores
- 6.2.3. Online
- 6.2.4. Other Distribution Channels
- 6.1. Market Analysis, Insights and Forecast - by Product Type
- 7. Asia Pacific Smart Home Fitness/Gym Equipment Market Analysis, Insights and Forecast, 2020-2032
- 7.1. Market Analysis, Insights and Forecast - by Product Type
- 7.1.1. Cardiovascular Training Equipment
- 7.1.2. Strength Training Equipment
- 7.2. Market Analysis, Insights and Forecast - by Distribution Channel
- 7.2.1. Supermarkets/Hypermarkets
- 7.2.2. Specialized Stores
- 7.2.3. Online
- 7.2.4. Other Distribution Channels
- 7.1. Market Analysis, Insights and Forecast - by Product Type
- 8. North America Smart Home Fitness/Gym Equipment Market Analysis, Insights and Forecast, 2020-2032
- 8.1. Market Analysis, Insights and Forecast - by Product Type
- 8.1.1. Cardiovascular Training Equipment
- 8.1.2. Strength Training Equipment
- 8.2. Market Analysis, Insights and Forecast - by Distribution Channel
- 8.2.1. Supermarkets/Hypermarkets
- 8.2.2. Specialized Stores
- 8.2.3. Online
- 8.2.4. Other Distribution Channels
- 8.1. Market Analysis, Insights and Forecast - by Product Type
- 9. Europe Smart Home Fitness/Gym Equipment Market Analysis, Insights and Forecast, 2020-2032
- 9.1. Market Analysis, Insights and Forecast - by Product Type
- 9.1.1. Cardiovascular Training Equipment
- 9.1.2. Strength Training Equipment
- 9.2. Market Analysis, Insights and Forecast - by Distribution Channel
- 9.2.1. Supermarkets/Hypermarkets
- 9.2.2. Specialized Stores
- 9.2.3. Online
- 9.2.4. Other Distribution Channels
- 9.1. Market Analysis, Insights and Forecast - by Product Type
- 10. South America Smart Home Fitness/Gym Equipment Market Analysis, Insights and Forecast, 2020-2032
- 10.1. Market Analysis, Insights and Forecast - by Product Type
- 10.1.1. Cardiovascular Training Equipment
- 10.1.2. Strength Training Equipment
- 10.2. Market Analysis, Insights and Forecast - by Distribution Channel
- 10.2.1. Supermarkets/Hypermarkets
- 10.2.2. Specialized Stores
- 10.2.3. Online
- 10.2.4. Other Distribution Channels
- 10.1. Market Analysis, Insights and Forecast - by Product Type
- 11. Middle East and Africa Smart Home Fitness/Gym Equipment Market Analysis, Insights and Forecast, 2020-2032
- 11.1. Market Analysis, Insights and Forecast - by Product Type
- 11.1.1. Cardiovascular Training Equipment
- 11.1.2. Strength Training Equipment
- 11.2. Market Analysis, Insights and Forecast - by Distribution Channel
- 11.2.1. Supermarkets/Hypermarkets
- 11.2.2. Specialized Stores
- 11.2.3. Online
- 11.2.4. Other Distribution Channels
- 11.1. Market Analysis, Insights and Forecast - by Product Type
- 12. Competitive Analysis
- 12.1. Company Profiles
- 12.1.1 Peloton
- 12.1.1.1. Company Overview
- 12.1.1.2. Products
- 12.1.1.3. Company Financials
- 12.1.1.4. SWOT Analysis
- 12.1.2 TRUE Fitness Technology Inc
- 12.1.2.1. Company Overview
- 12.1.2.2. Products
- 12.1.2.3. Company Financials
- 12.1.2.4. SWOT Analysis
- 12.1.3 Nautilus Inc
- 12.1.3.1. Company Overview
- 12.1.3.2. Products
- 12.1.3.3. Company Financials
- 12.1.3.4. SWOT Analysis
- 12.1.4 JTX Fitness
- 12.1.4.1. Company Overview
- 12.1.4.2. Products
- 12.1.4.3. Company Financials
- 12.1.4.4. SWOT Analysis
- 12.1.5 Core Health and Fitness LLC
- 12.1.5.1. Company Overview
- 12.1.5.2. Products
- 12.1.5.3. Company Financials
- 12.1.5.4. SWOT Analysis
- 12.1.6 Precor Inc
- 12.1.6.1. Company Overview
- 12.1.6.2. Products
- 12.1.6.3. Company Financials
- 12.1.6.4. SWOT Analysis
- 12.1.7 Tonal System Inc
- 12.1.7.1. Company Overview
- 12.1.7.2. Products
- 12.1.7.3. Company Financials
- 12.1.7.4. SWOT Analysis
- 12.1.8 Technogym
- 12.1.8.1. Company Overview
- 12.1.8.2. Products
- 12.1.8.3. Company Financials
- 12.1.8.4. SWOT Analysis
- 12.1.9 ICON Health & Fitness Inc
- 12.1.9.1. Company Overview
- 12.1.9.2. Products
- 12.1.9.3. Company Financials
- 12.1.9.4. SWOT Analysis
- 12.1.10 Life Fitness Inc
- 12.1.10.1. Company Overview
- 12.1.10.2. Products
- 12.1.10.3. Company Financials
- 12.1.10.4. SWOT Analysis
- 12.1.1 Peloton
- 12.2. Market Entropy
- 12.2.1 Company's Key Areas Served
- 12.2.2 Recent Developments
- 12.3. Company Market Share Analysis 2025
- 12.3.1 Top 5 Companies Market Share Analysis
- 12.3.2 Top 3 Companies Market Share Analysis
- 12.4. List of Potential Customers
- 13. Research Methodology
List of Figures
- Figure 1: Global Smart Home Fitness/Gym Equipment Market Revenue Breakdown (Million, %) by Region 2025 & 2033
- Figure 2: Global Smart Home Fitness/Gym Equipment Market Volume Breakdown (K Units, %) by Region 2025 & 2033
- Figure 3: Asia Pacific Smart Home Fitness/Gym Equipment Market Revenue (Million), by Product Type 2025 & 2033
- Figure 4: Asia Pacific Smart Home Fitness/Gym Equipment Market Volume (K Units), by Product Type 2025 & 2033
- Figure 5: Asia Pacific Smart Home Fitness/Gym Equipment Market Revenue Share (%), by Product Type 2025 & 2033
- Figure 6: Asia Pacific Smart Home Fitness/Gym Equipment Market Volume Share (%), by Product Type 2025 & 2033
- Figure 7: Asia Pacific Smart Home Fitness/Gym Equipment Market Revenue (Million), by Distribution Channel 2025 & 2033
- Figure 8: Asia Pacific Smart Home Fitness/Gym Equipment Market Volume (K Units), by Distribution Channel 2025 & 2033
- Figure 9: Asia Pacific Smart Home Fitness/Gym Equipment Market Revenue Share (%), by Distribution Channel 2025 & 2033
- Figure 10: Asia Pacific Smart Home Fitness/Gym Equipment Market Volume Share (%), by Distribution Channel 2025 & 2033
- Figure 11: Asia Pacific Smart Home Fitness/Gym Equipment Market Revenue (Million), by Country 2025 & 2033
- Figure 12: Asia Pacific Smart Home Fitness/Gym Equipment Market Volume (K Units), by Country 2025 & 2033
- Figure 13: Asia Pacific Smart Home Fitness/Gym Equipment Market Revenue Share (%), by Country 2025 & 2033
- Figure 14: Asia Pacific Smart Home Fitness/Gym Equipment Market Volume Share (%), by Country 2025 & 2033
- Figure 15: North America Smart Home Fitness/Gym Equipment Market Revenue (Million), by Product Type 2025 & 2033
- Figure 16: North America Smart Home Fitness/Gym Equipment Market Volume (K Units), by Product Type 2025 & 2033
- Figure 17: North America Smart Home Fitness/Gym Equipment Market Revenue Share (%), by Product Type 2025 & 2033
- Figure 18: North America Smart Home Fitness/Gym Equipment Market Volume Share (%), by Product Type 2025 & 2033
- Figure 19: North America Smart Home Fitness/Gym Equipment Market Revenue (Million), by Distribution Channel 2025 & 2033
- Figure 20: North America Smart Home Fitness/Gym Equipment Market Volume (K Units), by Distribution Channel 2025 & 2033
- Figure 21: North America Smart Home Fitness/Gym Equipment Market Revenue Share (%), by Distribution Channel 2025 & 2033
- Figure 22: North America Smart Home Fitness/Gym Equipment Market Volume Share (%), by Distribution Channel 2025 & 2033
- Figure 23: North America Smart Home Fitness/Gym Equipment Market Revenue (Million), by Country 2025 & 2033
- Figure 24: North America Smart Home Fitness/Gym Equipment Market Volume (K Units), by Country 2025 & 2033
- Figure 25: North America Smart Home Fitness/Gym Equipment Market Revenue Share (%), by Country 2025 & 2033
- Figure 26: North America Smart Home Fitness/Gym Equipment Market Volume Share (%), by Country 2025 & 2033
- Figure 27: Europe Smart Home Fitness/Gym Equipment Market Revenue (Million), by Product Type 2025 & 2033
- Figure 28: Europe Smart Home Fitness/Gym Equipment Market Volume (K Units), by Product Type 2025 & 2033
- Figure 29: Europe Smart Home Fitness/Gym Equipment Market Revenue Share (%), by Product Type 2025 & 2033
- Figure 30: Europe Smart Home Fitness/Gym Equipment Market Volume Share (%), by Product Type 2025 & 2033
- Figure 31: Europe Smart Home Fitness/Gym Equipment Market Revenue (Million), by Distribution Channel 2025 & 2033
- Figure 32: Europe Smart Home Fitness/Gym Equipment Market Volume (K Units), by Distribution Channel 2025 & 2033
- Figure 33: Europe Smart Home Fitness/Gym Equipment Market Revenue Share (%), by Distribution Channel 2025 & 2033
- Figure 34: Europe Smart Home Fitness/Gym Equipment Market Volume Share (%), by Distribution Channel 2025 & 2033
- Figure 35: Europe Smart Home Fitness/Gym Equipment Market Revenue (Million), by Country 2025 & 2033
- Figure 36: Europe Smart Home Fitness/Gym Equipment Market Volume (K Units), by Country 2025 & 2033
- Figure 37: Europe Smart Home Fitness/Gym Equipment Market Revenue Share (%), by Country 2025 & 2033
- Figure 38: Europe Smart Home Fitness/Gym Equipment Market Volume Share (%), by Country 2025 & 2033
- Figure 39: South America Smart Home Fitness/Gym Equipment Market Revenue (Million), by Product Type 2025 & 2033
- Figure 40: South America Smart Home Fitness/Gym Equipment Market Volume (K Units), by Product Type 2025 & 2033
- Figure 41: South America Smart Home Fitness/Gym Equipment Market Revenue Share (%), by Product Type 2025 & 2033
- Figure 42: South America Smart Home Fitness/Gym Equipment Market Volume Share (%), by Product Type 2025 & 2033
- Figure 43: South America Smart Home Fitness/Gym Equipment Market Revenue (Million), by Distribution Channel 2025 & 2033
- Figure 44: South America Smart Home Fitness/Gym Equipment Market Volume (K Units), by Distribution Channel 2025 & 2033
- Figure 45: South America Smart Home Fitness/Gym Equipment Market Revenue Share (%), by Distribution Channel 2025 & 2033
- Figure 46: South America Smart Home Fitness/Gym Equipment Market Volume Share (%), by Distribution Channel 2025 & 2033
- Figure 47: South America Smart Home Fitness/Gym Equipment Market Revenue (Million), by Country 2025 & 2033
- Figure 48: South America Smart Home Fitness/Gym Equipment Market Volume (K Units), by Country 2025 & 2033
- Figure 49: South America Smart Home Fitness/Gym Equipment Market Revenue Share (%), by Country 2025 & 2033
- Figure 50: South America Smart Home Fitness/Gym Equipment Market Volume Share (%), by Country 2025 & 2033
- Figure 51: Middle East and Africa Smart Home Fitness/Gym Equipment Market Revenue (Million), by Product Type 2025 & 2033
- Figure 52: Middle East and Africa Smart Home Fitness/Gym Equipment Market Volume (K Units), by Product Type 2025 & 2033
- Figure 53: Middle East and Africa Smart Home Fitness/Gym Equipment Market Revenue Share (%), by Product Type 2025 & 2033
- Figure 54: Middle East and Africa Smart Home Fitness/Gym Equipment Market Volume Share (%), by Product Type 2025 & 2033
- Figure 55: Middle East and Africa Smart Home Fitness/Gym Equipment Market Revenue (Million), by Distribution Channel 2025 & 2033
- Figure 56: Middle East and Africa Smart Home Fitness/Gym Equipment Market Volume (K Units), by Distribution Channel 2025 & 2033
- Figure 57: Middle East and Africa Smart Home Fitness/Gym Equipment Market Revenue Share (%), by Distribution Channel 2025 & 2033
- Figure 58: Middle East and Africa Smart Home Fitness/Gym Equipment Market Volume Share (%), by Distribution Channel 2025 & 2033
- Figure 59: Middle East and Africa Smart Home Fitness/Gym Equipment Market Revenue (Million), by Country 2025 & 2033
- Figure 60: Middle East and Africa Smart Home Fitness/Gym Equipment Market Volume (K Units), by Country 2025 & 2033
- Figure 61: Middle East and Africa Smart Home Fitness/Gym Equipment Market Revenue Share (%), by Country 2025 & 2033
- Figure 62: Middle East and Africa Smart Home Fitness/Gym Equipment Market Volume Share (%), by Country 2025 & 2033
List of Tables
- Table 1: Global Smart Home Fitness/Gym Equipment Market Revenue Million Forecast, by Product Type 2020 & 2033
- Table 2: Global Smart Home Fitness/Gym Equipment Market Volume K Units Forecast, by Product Type 2020 & 2033
- Table 3: Global Smart Home Fitness/Gym Equipment Market Revenue Million Forecast, by Distribution Channel 2020 & 2033
- Table 4: Global Smart Home Fitness/Gym Equipment Market Volume K Units Forecast, by Distribution Channel 2020 & 2033
- Table 5: Global Smart Home Fitness/Gym Equipment Market Revenue Million Forecast, by Region 2020 & 2033
- Table 6: Global Smart Home Fitness/Gym Equipment Market Volume K Units Forecast, by Region 2020 & 2033
- Table 7: Global Smart Home Fitness/Gym Equipment Market Revenue Million Forecast, by Product Type 2020 & 2033
- Table 8: Global Smart Home Fitness/Gym Equipment Market Volume K Units Forecast, by Product Type 2020 & 2033
- Table 9: Global Smart Home Fitness/Gym Equipment Market Revenue Million Forecast, by Distribution Channel 2020 & 2033
- Table 10: Global Smart Home Fitness/Gym Equipment Market Volume K Units Forecast, by Distribution Channel 2020 & 2033
- Table 11: Global Smart Home Fitness/Gym Equipment Market Revenue Million Forecast, by Country 2020 & 2033
- Table 12: Global Smart Home Fitness/Gym Equipment Market Volume K Units Forecast, by Country 2020 & 2033
- Table 13: India Smart Home Fitness/Gym Equipment Market Revenue (Million) Forecast, by Application 2020 & 2033
- Table 14: India Smart Home Fitness/Gym Equipment Market Volume (K Units) Forecast, by Application 2020 & 2033
- Table 15: China Smart Home Fitness/Gym Equipment Market Revenue (Million) Forecast, by Application 2020 & 2033
- Table 16: China Smart Home Fitness/Gym Equipment Market Volume (K Units) Forecast, by Application 2020 & 2033
- Table 17: Japan Smart Home Fitness/Gym Equipment Market Revenue (Million) Forecast, by Application 2020 & 2033
- Table 18: Japan Smart Home Fitness/Gym Equipment Market Volume (K Units) Forecast, by Application 2020 & 2033
- Table 19: Australia Smart Home Fitness/Gym Equipment Market Revenue (Million) Forecast, by Application 2020 & 2033
- Table 20: Australia Smart Home Fitness/Gym Equipment Market Volume (K Units) Forecast, by Application 2020 & 2033
- Table 21: Rest of Asia Pacific Smart Home Fitness/Gym Equipment Market Revenue (Million) Forecast, by Application 2020 & 2033
- Table 22: Rest of Asia Pacific Smart Home Fitness/Gym Equipment Market Volume (K Units) Forecast, by Application 2020 & 2033
- Table 23: Global Smart Home Fitness/Gym Equipment Market Revenue Million Forecast, by Product Type 2020 & 2033
- Table 24: Global Smart Home Fitness/Gym Equipment Market Volume K Units Forecast, by Product Type 2020 & 2033
- Table 25: Global Smart Home Fitness/Gym Equipment Market Revenue Million Forecast, by Distribution Channel 2020 & 2033
- Table 26: Global Smart Home Fitness/Gym Equipment Market Volume K Units Forecast, by Distribution Channel 2020 & 2033
- Table 27: Global Smart Home Fitness/Gym Equipment Market Revenue Million Forecast, by Country 2020 & 2033
- Table 28: Global Smart Home Fitness/Gym Equipment Market Volume K Units Forecast, by Country 2020 & 2033
- Table 29: United States Smart Home Fitness/Gym Equipment Market Revenue (Million) Forecast, by Application 2020 & 2033
- Table 30: United States Smart Home Fitness/Gym Equipment Market Volume (K Units) Forecast, by Application 2020 & 2033
- Table 31: Mexico Smart Home Fitness/Gym Equipment Market Revenue (Million) Forecast, by Application 2020 & 2033
- Table 32: Mexico Smart Home Fitness/Gym Equipment Market Volume (K Units) Forecast, by Application 2020 & 2033
- Table 33: Rest of North America Smart Home Fitness/Gym Equipment Market Revenue (Million) Forecast, by Application 2020 & 2033
- Table 34: Rest of North America Smart Home Fitness/Gym Equipment Market Volume (K Units) Forecast, by Application 2020 & 2033
- Table 35: Global Smart Home Fitness/Gym Equipment Market Revenue Million Forecast, by Product Type 2020 & 2033
- Table 36: Global Smart Home Fitness/Gym Equipment Market Volume K Units Forecast, by Product Type 2020 & 2033
- Table 37: Global Smart Home Fitness/Gym Equipment Market Revenue Million Forecast, by Distribution Channel 2020 & 2033
- Table 38: Global Smart Home Fitness/Gym Equipment Market Volume K Units Forecast, by Distribution Channel 2020 & 2033
- Table 39: Global Smart Home Fitness/Gym Equipment Market Revenue Million Forecast, by Country 2020 & 2033
- Table 40: Global Smart Home Fitness/Gym Equipment Market Volume K Units Forecast, by Country 2020 & 2033
- Table 41: Germany Smart Home Fitness/Gym Equipment Market Revenue (Million) Forecast, by Application 2020 & 2033
- Table 42: Germany Smart Home Fitness/Gym Equipment Market Volume (K Units) Forecast, by Application 2020 & 2033
- Table 43: United Kingdom Smart Home Fitness/Gym Equipment Market Revenue (Million) Forecast, by Application 2020 & 2033
- Table 44: United Kingdom Smart Home Fitness/Gym Equipment Market Volume (K Units) Forecast, by Application 2020 & 2033
- Table 45: France Smart Home Fitness/Gym Equipment Market Revenue (Million) Forecast, by Application 2020 & 2033
- Table 46: France Smart Home Fitness/Gym Equipment Market Volume (K Units) Forecast, by Application 2020 & 2033
- Table 47: Russia Smart Home Fitness/Gym Equipment Market Revenue (Million) Forecast, by Application 2020 & 2033
- Table 48: Russia Smart Home Fitness/Gym Equipment Market Volume (K Units) Forecast, by Application 2020 & 2033
- Table 49: Rest of Europe Smart Home Fitness/Gym Equipment Market Revenue (Million) Forecast, by Application 2020 & 2033
- Table 50: Rest of Europe Smart Home Fitness/Gym Equipment Market Volume (K Units) Forecast, by Application 2020 & 2033
- Table 51: Global Smart Home Fitness/Gym Equipment Market Revenue Million Forecast, by Product Type 2020 & 2033
- Table 52: Global Smart Home Fitness/Gym Equipment Market Volume K Units Forecast, by Product Type 2020 & 2033
- Table 53: Global Smart Home Fitness/Gym Equipment Market Revenue Million Forecast, by Distribution Channel 2020 & 2033
- Table 54: Global Smart Home Fitness/Gym Equipment Market Volume K Units Forecast, by Distribution Channel 2020 & 2033
- Table 55: Global Smart Home Fitness/Gym Equipment Market Revenue Million Forecast, by Country 2020 & 2033
- Table 56: Global Smart Home Fitness/Gym Equipment Market Volume K Units Forecast, by Country 2020 & 2033
- Table 57: Brazil Smart Home Fitness/Gym Equipment Market Revenue (Million) Forecast, by Application 2020 & 2033
- Table 58: Brazil Smart Home Fitness/Gym Equipment Market Volume (K Units) Forecast, by Application 2020 & 2033
- Table 59: Argentina Smart Home Fitness/Gym Equipment Market Revenue (Million) Forecast, by Application 2020 & 2033
- Table 60: Argentina Smart Home Fitness/Gym Equipment Market Volume (K Units) Forecast, by Application 2020 & 2033
- Table 61: Rest of South America Smart Home Fitness/Gym Equipment Market Revenue (Million) Forecast, by Application 2020 & 2033
- Table 62: Rest of South America Smart Home Fitness/Gym Equipment Market Volume (K Units) Forecast, by Application 2020 & 2033
- Table 63: Global Smart Home Fitness/Gym Equipment Market Revenue Million Forecast, by Product Type 2020 & 2033
- Table 64: Global Smart Home Fitness/Gym Equipment Market Volume K Units Forecast, by Product Type 2020 & 2033
- Table 65: Global Smart Home Fitness/Gym Equipment Market Revenue Million Forecast, by Distribution Channel 2020 & 2033
- Table 66: Global Smart Home Fitness/Gym Equipment Market Volume K Units Forecast, by Distribution Channel 2020 & 2033
- Table 67: Global Smart Home Fitness/Gym Equipment Market Revenue Million Forecast, by Country 2020 & 2033
- Table 68: Global Smart Home Fitness/Gym Equipment Market Volume K Units Forecast, by Country 2020 & 2033
- Table 69: United Arab Emirates Smart Home Fitness/Gym Equipment Market Revenue (Million) Forecast, by Application 2020 & 2033
- Table 70: United Arab Emirates Smart Home Fitness/Gym Equipment Market Volume (K Units) Forecast, by Application 2020 & 2033
- Table 71: South Africa Smart Home Fitness/Gym Equipment Market Revenue (Million) Forecast, by Application 2020 & 2033
- Table 72: South Africa Smart Home Fitness/Gym Equipment Market Volume (K Units) Forecast, by Application 2020 & 2033
- Table 73: Rest of Middle East and Africa Smart Home Fitness/Gym Equipment Market Revenue (Million) Forecast, by Application 2020 & 2033
- Table 74: Rest of Middle East and Africa Smart Home Fitness/Gym Equipment Market Volume (K Units) Forecast, by Application 2020 & 2033
Frequently Asked Questions
1. What is the projected Compound Annual Growth Rate (CAGR) of the Smart Home Fitness/Gym Equipment Market?
The projected CAGR is approximately 5.13%.
2. Which companies are prominent players in the Smart Home Fitness/Gym Equipment Market?
Key companies in the market include Peloton, TRUE Fitness Technology Inc, Nautilus Inc, JTX Fitness, Core Health and Fitness LLC, Precor Inc, Tonal System Inc, Technogym, ICON Health & Fitness Inc, Life Fitness Inc.
3. What are the main segments of the Smart Home Fitness/Gym Equipment Market?
The market segments include Product Type, Distribution Channel.
4. Can you provide details about the market size?
The market size is estimated to be USD 2.5 Million as of 2022.
5. What are some drivers contributing to market growth?
Transforming Workouts with Ultimate Convenience for Busy Lifestyles; Increasing Awareness and Prioritization of Health.
6. What are the notable trends driving market growth?
Cardiovascular Training Equipment is Expected to Grow at a Faster Rate during the Forecast Period.
7. Are there any restraints impacting market growth?
High Product Cost Restrains Market Growth; Limited Space in Homes.
8. Can you provide examples of recent developments in the market?
October 2023: Lululemon entered a five-year partnership with connected fitness specialist Peloton, signing a content, apparel, and community initiative deal. As a result, Lululemon decided to discontinue its mirror-connected fitness service.
9. What pricing options are available for accessing the report?
Pricing options include single-user, multi-user, and enterprise licenses priced at USD 4750, USD 5250, and USD 8750 respectively.
10. Is the market size provided in terms of value or volume?
The market size is provided in terms of value, measured in Million and volume, measured in K Units.
11. Are there any specific market keywords associated with the report?
Yes, the market keyword associated with the report is "Smart Home Fitness/Gym Equipment Market," which aids in identifying and referencing the specific market segment covered.
12. How do I determine which pricing option suits my needs best?
The pricing options vary based on user requirements and access needs. Individual users may opt for single-user licenses, while businesses requiring broader access may choose multi-user or enterprise licenses for cost-effective access to the report.
13. Are there any additional resources or data provided in the Smart Home Fitness/Gym Equipment Market report?
While the report offers comprehensive insights, it's advisable to review the specific contents or supplementary materials provided to ascertain if additional resources or data are available.
14. How can I stay updated on further developments or reports in the Smart Home Fitness/Gym Equipment Market?
To stay informed about further developments, trends, and reports in the Smart Home Fitness/Gym Equipment Market, consider subscribing to industry newsletters, following relevant companies and organizations, or regularly checking reputable industry news sources and publications.
Methodology
Step 1 - Identification of Relevant Samples Size from Population Database


Step 2 - Approaches for Defining Global Market Size (Value, Volume* & Price*)

Note*: In applicable scenarios
Step 3 - Data Sources
Primary Research
- Web Analytics
- Survey Reports
- Research Institute
- Latest Research Reports
- Opinion Leaders
Secondary Research
- Annual Reports
- White Paper
- Latest Press Release
- Industry Association
- Paid Database
- Investor Presentations

Step 4 - Data Triangulation
Involves using different sources of information in order to increase the validity of a study
These sources are likely to be stakeholders in a program - participants, other researchers, program staff, other community members, and so on.
Then we put all data in single framework & apply various statistical tools to find out the dynamic on the market.
During the analysis stage, feedback from the stakeholder groups would be compared to determine areas of agreement as well as areas of divergence