
Key Insights
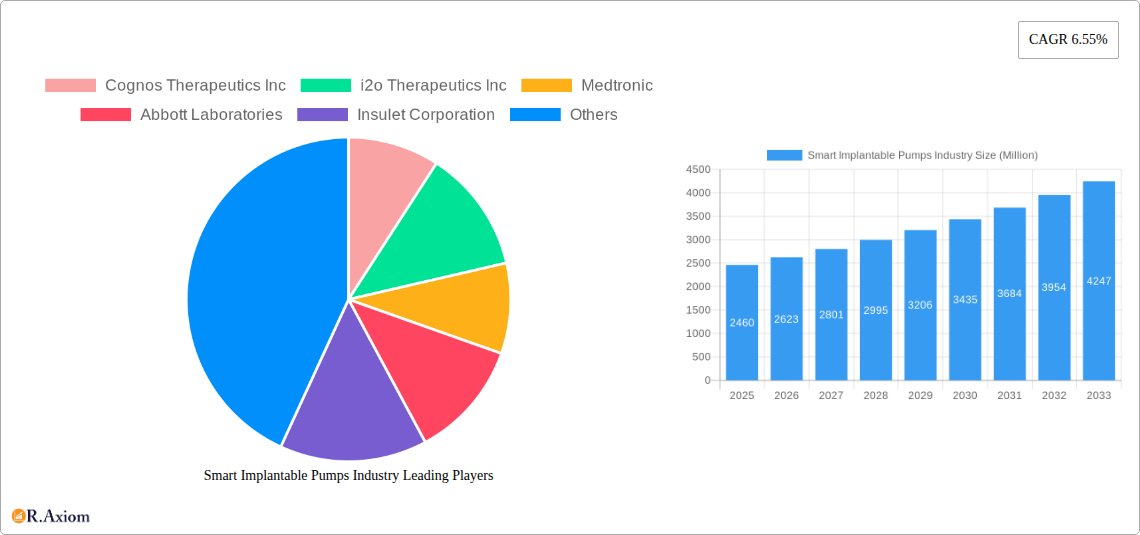
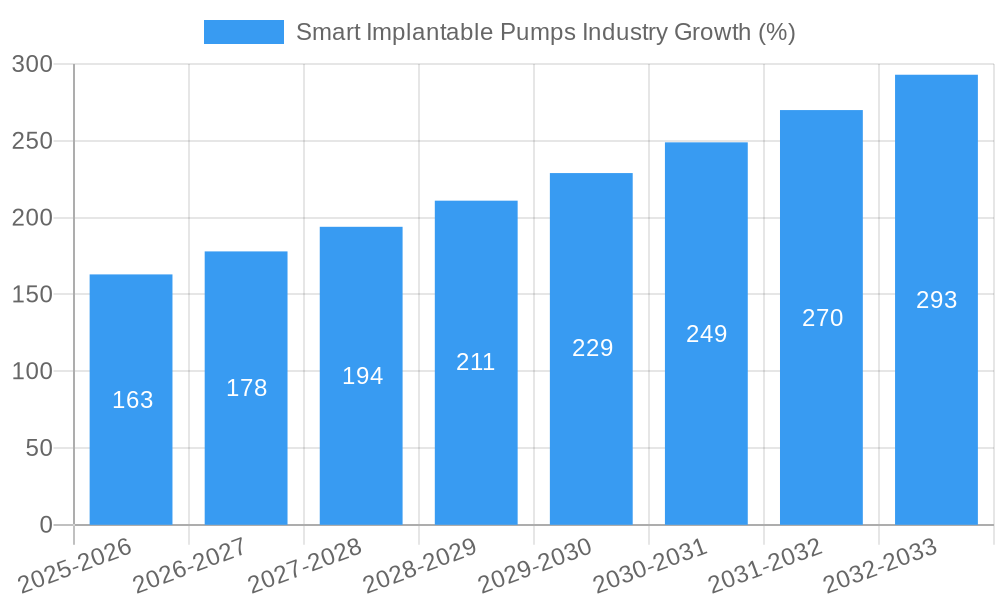
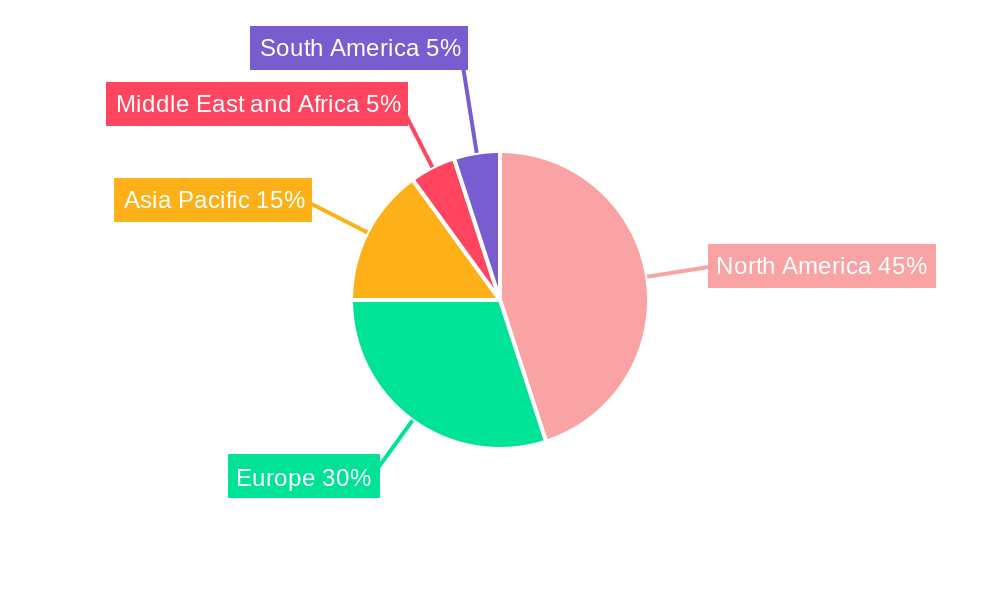
The global smart implantable pumps market is poised for significant growth, projected to reach $2.46 billion in 2025 and maintain a Compound Annual Growth Rate (CAGR) of 6.55% from 2025 to 2033. This expansion is driven by several key factors. Technological advancements leading to smaller, more efficient, and safer implantable pumps are increasing adoption rates. The growing prevalence of chronic conditions requiring long-term drug delivery, such as pain management, spasticity, and cardiovascular diseases, fuels market demand. Furthermore, the increasing preference for minimally invasive procedures and improved patient outcomes associated with implantable pumps are contributing to market growth. The market is segmented by pump type (perfusion pumps, micro pumps), application (pain management, spasticity, cardiovascular diseases, and others), and end-user (hospitals, ambulatory surgical centers, and others). North America currently holds a dominant market share due to advanced healthcare infrastructure and high adoption rates of innovative medical technologies. However, the Asia-Pacific region is expected to witness substantial growth in the coming years, driven by increasing healthcare expenditure and rising prevalence of target conditions.
The competitive landscape is characterized by a mix of established players like Medtronic and Abbott Laboratories, and emerging companies such as Cognos Therapeutics and i2o Therapeutics. These companies are focusing on research and development to enhance pump technology, expand product portfolios, and secure strategic partnerships to strengthen their market positions. Despite the promising growth trajectory, challenges such as stringent regulatory approvals, high initial investment costs, and potential complications associated with implantable devices represent restraints to market expansion. However, ongoing technological improvements and a focus on patient safety are expected to mitigate these challenges and further drive market growth throughout the forecast period. The market's future hinges on continuous innovation, regulatory compliance, and the successful management of associated risks.
Smart Implantable Pumps Industry: A Comprehensive Market Report (2019-2033)
This comprehensive report provides an in-depth analysis of the global smart implantable pumps industry, covering market size, growth projections, key segments, leading players, and future trends. The study period spans from 2019 to 2033, with 2025 serving as the base and estimated year. The report offers actionable insights for industry stakeholders, including manufacturers, investors, and regulatory bodies. The total market value in 2025 is estimated at xx Million, projected to reach xx Million by 2033, exhibiting a CAGR of xx% during the forecast period (2025-2033).
Smart Implantable Pumps Industry Market Concentration & Innovation
The smart implantable pumps market is characterized by a moderately concentrated landscape with several key players holding significant market share. Medtronic and Abbott Laboratories are currently among the dominant players, benefiting from established distribution networks and extensive research & development capabilities. However, smaller companies like Cognos Therapeutics Inc and i2o Therapeutics Inc are driving innovation with niche technologies. Market share data for 2025 shows Medtronic holding approximately xx% share, followed by Abbott Laboratories at xx%, with the remaining market share distributed among other players. The average M&A deal value in the last five years is approximately xx Million, demonstrating substantial investment in the sector. Innovation is driven by advancements in miniaturization, wireless communication, and improved biocompatibility, leading to more efficient and patient-friendly devices. Regulatory frameworks, such as those set by the FDA, play a crucial role in shaping product development and market entry. The existence of substitute therapies, like conventional drug delivery methods, creates competitive pressure, necessitating continuous innovation. End-user trends reveal an increasing preference for minimally invasive procedures and personalized medicine, shaping market demand.
- Market Concentration: Moderately concentrated, with Medtronic and Abbott Laboratories leading.
- Innovation Drivers: Miniaturization, wireless technology, biocompatibility improvements.
- Regulatory Landscape: Significant influence of FDA and similar global bodies.
- Product Substitutes: Conventional drug delivery methods.
- M&A Activity: Significant activity with an average deal value of xx Million in the last five years.
- End-user Trends: Growing preference for minimally invasive procedures and personalized medicine.
Smart Implantable Pumps Industry Industry Trends & Insights
The smart implantable pumps market is experiencing robust growth driven by factors such as the increasing prevalence of chronic diseases requiring long-term drug delivery, technological advancements, and rising healthcare expenditure globally. The market witnessed significant technological disruptions, including the development of smaller, more efficient pumps with enhanced functionalities such as remote monitoring and programmable drug delivery. Consumer preferences are increasingly shifting towards personalized treatment options and convenient, minimally invasive procedures. The competitive landscape is dynamic, characterized by both established players expanding their product portfolios and new entrants introducing innovative solutions. The market penetration rate of smart implantable pumps is projected to increase from xx% in 2025 to xx% by 2033, signifying strong market growth.
Dominant Markets & Segments in Smart Implantable Pumps Industry
The North American region currently dominates the smart implantable pumps market, fueled by robust healthcare infrastructure, high adoption rates of advanced medical technologies, and favorable regulatory environments. Within the segments, perfusion pumps hold a significant market share due to their widespread use in cardiovascular applications. The pain management application segment is also experiencing strong growth driven by the rising prevalence of chronic pain conditions. Hospitals and ambulatory surgical centers constitute the majority of end-users, contributing to the market's expansion.
- Leading Region: North America
- Dominant Pump Type: Perfusion Pumps
- Leading Application: Pain Management and Cardiovascular
- Primary End User: Hospitals
Key Drivers for Dominance:
- North America: Well-developed healthcare infrastructure, high disposable income, favorable regulatory environment.
- Perfusion Pumps: Established technology, crucial role in various medical procedures.
- Pain Management: Increasing prevalence of chronic pain conditions.
- Hospitals: High concentration of patients and established procedural infrastructure.
Smart Implantable Pumps Industry Product Developments
Recent product developments focus on incorporating advanced features such as wireless connectivity, remote monitoring capabilities, and improved biocompatibility. This allows for better patient management, reduced hospital readmissions, and enhanced treatment efficacy. Miniaturization efforts are ongoing, aiming to create smaller, less invasive devices. The integration of smart features is further improving patient comfort and compliance with treatment regimens.
Report Scope & Segmentation Analysis
This report segments the smart implantable pumps market based on pump type (perfusion pumps, micro pumps), application (pain, spasticity, cardiovascular, others), and end-user (hospitals, ambulatory surgical centers, others). Each segment exhibits distinct growth trajectories and competitive dynamics, influenced by factors such as technological advancements, regulatory changes, and evolving clinical practices. The market size for each segment is projected to grow significantly over the forecast period, with perfusion pumps and cardiovascular applications showing particularly strong growth potential. The competitive landscape within each segment varies, with some dominated by a few major players, while others present more fragmented markets.
Key Drivers of Smart Implantable Pumps Industry Growth
The growth of the smart implantable pumps industry is driven by several factors including technological advancements that deliver more efficient and reliable devices, an aging global population with an increased incidence of chronic diseases requiring continuous drug delivery, rising healthcare expenditure, and favorable government initiatives that aim to improve healthcare outcomes. Furthermore, the increasing demand for minimally invasive procedures and the growing preference for remote patient monitoring systems are fueling the market growth.
Challenges in the Smart Implantable Pumps Industry Sector
Challenges facing the smart implantable pumps industry include stringent regulatory approvals required for new products, complexities involved in manufacturing and ensuring device reliability, managing the cost of advanced technologies, and competition from existing drug delivery systems. Supply chain disruptions, particularly in relation to specialized components, can also impact production and market availability. These factors can collectively affect market growth and access to these vital medical devices.
Emerging Opportunities in Smart Implantable Pumps Industry
Emerging opportunities include the development of biocompatible and biodegradable materials, advancements in wireless communication technologies, miniaturization, and improved battery life. Expansion into untapped markets in emerging economies also presents substantial growth potential. The growing interest in personalized medicine opens possibilities for customized implantable pumps with tailored drug delivery profiles.
Leading Players in the Smart Implantable Pumps Industry Market
- Cognos Therapeutics Inc
- i2o Therapeutics Inc
- Medtronic
- Abbott Laboratories
- Insulet Corporation
- OrphaCare GmbH
- Tandem Diabetes
- Intera Oncology
Key Developments in Smart Implantable Pumps Industry Industry
- August 2023: US FDA approved ICU Medical Inc.’s Plum Duo infusion pump with LifeShield infusion safety software for commercial use.
- June 2023: Medtronic entered into an agreement to acquire EOFlow Co. Ltd, the manufacturer of the EOPatch device- a tubeless, wearable, and fully disposable insulin delivery device.
Strategic Outlook for Smart Implantable Pumps Industry Market
The future of the smart implantable pumps market looks promising, driven by continued technological advancements, an aging global population, and increasing healthcare spending. The development of more sophisticated and user-friendly devices, combined with the expansion into new applications and markets, will fuel further growth. Strategic partnerships and acquisitions will continue to shape the industry landscape, promoting innovation and market consolidation.
Smart Implantable Pumps Industry Segmentation
-
1. Pump Type
- 1.1. Perfusion Pumps
- 1.2. Micro Pumps
-
2. Application
- 2.1. Pain
- 2.2. Spasticity
- 2.3. Cardiovascular
- 2.4. Others
-
3. End User
- 3.1. Hospitals
- 3.2. Ambulatory Surgical Centers
- 3.3. Others
Smart Implantable Pumps Industry Segmentation By Geography
-
1. North America
- 1.1. United States
- 1.2. Canada
- 1.3. Mexico
-
2. Europe
- 2.1. Germany
- 2.2. United Kingdom
- 2.3. France
- 2.4. Italy
- 2.5. Spain
- 2.6. Rest of Europe
-
3. Asia Pacific
- 3.1. China
- 3.2. Japan
- 3.3. India
- 3.4. Australia
- 3.5. South Korea
- 3.6. Rest of Asia Pacific
-
4. Middle East and Africa
- 4.1. GCC
- 4.2. South Africa
- 4.3. Rest of Middle East and Africa
-
5. South America
- 5.1. Brazil
- 5.2. Argentina
- 5.3. Rest of South America
Smart Implantable Pumps Industry REPORT HIGHLIGHTS
| Aspects | Details |
|---|---|
| Study Period | 2019-2033 |
| Base Year | 2024 |
| Estimated Year | 2025 |
| Forecast Period | 2025-2033 |
| Historical Period | 2019-2024 |
| Growth Rate | CAGR of 6.55% from 2019-2033 |
| Segmentation |
|
Table of Contents
- 1. Introduction
- 1.1. Research Scope
- 1.2. Market Segmentation
- 1.3. Research Methodology
- 1.4. Definitions and Assumptions
- 2. Executive Summary
- 2.1. Introduction
- 3. Market Dynamics
- 3.1. Introduction
- 3.2. Market Drivers
- 3.2.1 High Prevalence and Incidence of Chronic Diseases such as Spasticity & Chronic Pain; Growing Geriatric Population; Growing Healthcare Consciousness
- 3.2.2 Rising Healthcare Expenditure and Favorable Reimbursement Policies
- 3.3. Market Restrains
- 3.3.1. Stringent Regulatory Framework and Product Recalls
- 3.4. Market Trends
- 3.4.1. Cardiovascular Segment is Expected to Witness a Significant Growth Over the Forecast Period
- 4. Market Factor Analysis
- 4.1. Porters Five Forces
- 4.2. Supply/Value Chain
- 4.3. PESTEL analysis
- 4.4. Market Entropy
- 4.5. Patent/Trademark Analysis
- 5. Global Smart Implantable Pumps Industry Analysis, Insights and Forecast, 2019-2031
- 5.1. Market Analysis, Insights and Forecast - by Pump Type
- 5.1.1. Perfusion Pumps
- 5.1.2. Micro Pumps
- 5.2. Market Analysis, Insights and Forecast - by Application
- 5.2.1. Pain
- 5.2.2. Spasticity
- 5.2.3. Cardiovascular
- 5.2.4. Others
- 5.3. Market Analysis, Insights and Forecast - by End User
- 5.3.1. Hospitals
- 5.3.2. Ambulatory Surgical Centers
- 5.3.3. Others
- 5.4. Market Analysis, Insights and Forecast - by Region
- 5.4.1. North America
- 5.4.2. Europe
- 5.4.3. Asia Pacific
- 5.4.4. Middle East and Africa
- 5.4.5. South America
- 5.1. Market Analysis, Insights and Forecast - by Pump Type
- 6. North America Smart Implantable Pumps Industry Analysis, Insights and Forecast, 2019-2031
- 6.1. Market Analysis, Insights and Forecast - by Pump Type
- 6.1.1. Perfusion Pumps
- 6.1.2. Micro Pumps
- 6.2. Market Analysis, Insights and Forecast - by Application
- 6.2.1. Pain
- 6.2.2. Spasticity
- 6.2.3. Cardiovascular
- 6.2.4. Others
- 6.3. Market Analysis, Insights and Forecast - by End User
- 6.3.1. Hospitals
- 6.3.2. Ambulatory Surgical Centers
- 6.3.3. Others
- 6.1. Market Analysis, Insights and Forecast - by Pump Type
- 7. Europe Smart Implantable Pumps Industry Analysis, Insights and Forecast, 2019-2031
- 7.1. Market Analysis, Insights and Forecast - by Pump Type
- 7.1.1. Perfusion Pumps
- 7.1.2. Micro Pumps
- 7.2. Market Analysis, Insights and Forecast - by Application
- 7.2.1. Pain
- 7.2.2. Spasticity
- 7.2.3. Cardiovascular
- 7.2.4. Others
- 7.3. Market Analysis, Insights and Forecast - by End User
- 7.3.1. Hospitals
- 7.3.2. Ambulatory Surgical Centers
- 7.3.3. Others
- 7.1. Market Analysis, Insights and Forecast - by Pump Type
- 8. Asia Pacific Smart Implantable Pumps Industry Analysis, Insights and Forecast, 2019-2031
- 8.1. Market Analysis, Insights and Forecast - by Pump Type
- 8.1.1. Perfusion Pumps
- 8.1.2. Micro Pumps
- 8.2. Market Analysis, Insights and Forecast - by Application
- 8.2.1. Pain
- 8.2.2. Spasticity
- 8.2.3. Cardiovascular
- 8.2.4. Others
- 8.3. Market Analysis, Insights and Forecast - by End User
- 8.3.1. Hospitals
- 8.3.2. Ambulatory Surgical Centers
- 8.3.3. Others
- 8.1. Market Analysis, Insights and Forecast - by Pump Type
- 9. Middle East and Africa Smart Implantable Pumps Industry Analysis, Insights and Forecast, 2019-2031
- 9.1. Market Analysis, Insights and Forecast - by Pump Type
- 9.1.1. Perfusion Pumps
- 9.1.2. Micro Pumps
- 9.2. Market Analysis, Insights and Forecast - by Application
- 9.2.1. Pain
- 9.2.2. Spasticity
- 9.2.3. Cardiovascular
- 9.2.4. Others
- 9.3. Market Analysis, Insights and Forecast - by End User
- 9.3.1. Hospitals
- 9.3.2. Ambulatory Surgical Centers
- 9.3.3. Others
- 9.1. Market Analysis, Insights and Forecast - by Pump Type
- 10. South America Smart Implantable Pumps Industry Analysis, Insights and Forecast, 2019-2031
- 10.1. Market Analysis, Insights and Forecast - by Pump Type
- 10.1.1. Perfusion Pumps
- 10.1.2. Micro Pumps
- 10.2. Market Analysis, Insights and Forecast - by Application
- 10.2.1. Pain
- 10.2.2. Spasticity
- 10.2.3. Cardiovascular
- 10.2.4. Others
- 10.3. Market Analysis, Insights and Forecast - by End User
- 10.3.1. Hospitals
- 10.3.2. Ambulatory Surgical Centers
- 10.3.3. Others
- 10.1. Market Analysis, Insights and Forecast - by Pump Type
- 11. North America Smart Implantable Pumps Industry Analysis, Insights and Forecast, 2019-2031
- 11.1. Market Analysis, Insights and Forecast - By Country/Sub-region
- 11.1.1. undefined
- 12. Europe Smart Implantable Pumps Industry Analysis, Insights and Forecast, 2019-2031
- 12.1. Market Analysis, Insights and Forecast - By Country/Sub-region
- 12.1.1. undefined
- 13. Asia Pacific Smart Implantable Pumps Industry Analysis, Insights and Forecast, 2019-2031
- 13.1. Market Analysis, Insights and Forecast - By Country/Sub-region
- 13.1.1. undefined
- 14. Middle East and Africa Smart Implantable Pumps Industry Analysis, Insights and Forecast, 2019-2031
- 14.1. Market Analysis, Insights and Forecast - By Country/Sub-region
- 14.1.1. undefined
- 15. South America Smart Implantable Pumps Industry Analysis, Insights and Forecast, 2019-2031
- 15.1. Market Analysis, Insights and Forecast - By Country/Sub-region
- 15.1.1. undefined
- 16. Competitive Analysis
- 16.1. Global Market Share Analysis 2024
- 16.2. Company Profiles
- 16.2.1 Cognos Therapeutics Inc
- 16.2.1.1. Overview
- 16.2.1.2. Products
- 16.2.1.3. SWOT Analysis
- 16.2.1.4. Recent Developments
- 16.2.1.5. Financials (Based on Availability)
- 16.2.2 i2o Therapeutics Inc
- 16.2.2.1. Overview
- 16.2.2.2. Products
- 16.2.2.3. SWOT Analysis
- 16.2.2.4. Recent Developments
- 16.2.2.5. Financials (Based on Availability)
- 16.2.3 Medtronic
- 16.2.3.1. Overview
- 16.2.3.2. Products
- 16.2.3.3. SWOT Analysis
- 16.2.3.4. Recent Developments
- 16.2.3.5. Financials (Based on Availability)
- 16.2.4 Abbott Laboratories
- 16.2.4.1. Overview
- 16.2.4.2. Products
- 16.2.4.3. SWOT Analysis
- 16.2.4.4. Recent Developments
- 16.2.4.5. Financials (Based on Availability)
- 16.2.5 Insulet Corporation
- 16.2.5.1. Overview
- 16.2.5.2. Products
- 16.2.5.3. SWOT Analysis
- 16.2.5.4. Recent Developments
- 16.2.5.5. Financials (Based on Availability)
- 16.2.6 OrphaCare GmbH
- 16.2.6.1. Overview
- 16.2.6.2. Products
- 16.2.6.3. SWOT Analysis
- 16.2.6.4. Recent Developments
- 16.2.6.5. Financials (Based on Availability)
- 16.2.7 Tandem Diabetes
- 16.2.7.1. Overview
- 16.2.7.2. Products
- 16.2.7.3. SWOT Analysis
- 16.2.7.4. Recent Developments
- 16.2.7.5. Financials (Based on Availability)
- 16.2.8 Intera Oncology
- 16.2.8.1. Overview
- 16.2.8.2. Products
- 16.2.8.3. SWOT Analysis
- 16.2.8.4. Recent Developments
- 16.2.8.5. Financials (Based on Availability)
- 16.2.1 Cognos Therapeutics Inc
List of Figures
- Figure 1: Global Smart Implantable Pumps Industry Revenue Breakdown (Million, %) by Region 2024 & 2032
- Figure 2: Global Smart Implantable Pumps Industry Volume Breakdown (K Units, %) by Region 2024 & 2032
- Figure 3: North America Smart Implantable Pumps Industry Revenue (Million), by Country 2024 & 2032
- Figure 4: North America Smart Implantable Pumps Industry Volume (K Units), by Country 2024 & 2032
- Figure 5: North America Smart Implantable Pumps Industry Revenue Share (%), by Country 2024 & 2032
- Figure 6: North America Smart Implantable Pumps Industry Volume Share (%), by Country 2024 & 2032
- Figure 7: Europe Smart Implantable Pumps Industry Revenue (Million), by Country 2024 & 2032
- Figure 8: Europe Smart Implantable Pumps Industry Volume (K Units), by Country 2024 & 2032
- Figure 9: Europe Smart Implantable Pumps Industry Revenue Share (%), by Country 2024 & 2032
- Figure 10: Europe Smart Implantable Pumps Industry Volume Share (%), by Country 2024 & 2032
- Figure 11: Asia Pacific Smart Implantable Pumps Industry Revenue (Million), by Country 2024 & 2032
- Figure 12: Asia Pacific Smart Implantable Pumps Industry Volume (K Units), by Country 2024 & 2032
- Figure 13: Asia Pacific Smart Implantable Pumps Industry Revenue Share (%), by Country 2024 & 2032
- Figure 14: Asia Pacific Smart Implantable Pumps Industry Volume Share (%), by Country 2024 & 2032
- Figure 15: Middle East and Africa Smart Implantable Pumps Industry Revenue (Million), by Country 2024 & 2032
- Figure 16: Middle East and Africa Smart Implantable Pumps Industry Volume (K Units), by Country 2024 & 2032
- Figure 17: Middle East and Africa Smart Implantable Pumps Industry Revenue Share (%), by Country 2024 & 2032
- Figure 18: Middle East and Africa Smart Implantable Pumps Industry Volume Share (%), by Country 2024 & 2032
- Figure 19: South America Smart Implantable Pumps Industry Revenue (Million), by Country 2024 & 2032
- Figure 20: South America Smart Implantable Pumps Industry Volume (K Units), by Country 2024 & 2032
- Figure 21: South America Smart Implantable Pumps Industry Revenue Share (%), by Country 2024 & 2032
- Figure 22: South America Smart Implantable Pumps Industry Volume Share (%), by Country 2024 & 2032
- Figure 23: North America Smart Implantable Pumps Industry Revenue (Million), by Pump Type 2024 & 2032
- Figure 24: North America Smart Implantable Pumps Industry Volume (K Units), by Pump Type 2024 & 2032
- Figure 25: North America Smart Implantable Pumps Industry Revenue Share (%), by Pump Type 2024 & 2032
- Figure 26: North America Smart Implantable Pumps Industry Volume Share (%), by Pump Type 2024 & 2032
- Figure 27: North America Smart Implantable Pumps Industry Revenue (Million), by Application 2024 & 2032
- Figure 28: North America Smart Implantable Pumps Industry Volume (K Units), by Application 2024 & 2032
- Figure 29: North America Smart Implantable Pumps Industry Revenue Share (%), by Application 2024 & 2032
- Figure 30: North America Smart Implantable Pumps Industry Volume Share (%), by Application 2024 & 2032
- Figure 31: North America Smart Implantable Pumps Industry Revenue (Million), by End User 2024 & 2032
- Figure 32: North America Smart Implantable Pumps Industry Volume (K Units), by End User 2024 & 2032
- Figure 33: North America Smart Implantable Pumps Industry Revenue Share (%), by End User 2024 & 2032
- Figure 34: North America Smart Implantable Pumps Industry Volume Share (%), by End User 2024 & 2032
- Figure 35: North America Smart Implantable Pumps Industry Revenue (Million), by Country 2024 & 2032
- Figure 36: North America Smart Implantable Pumps Industry Volume (K Units), by Country 2024 & 2032
- Figure 37: North America Smart Implantable Pumps Industry Revenue Share (%), by Country 2024 & 2032
- Figure 38: North America Smart Implantable Pumps Industry Volume Share (%), by Country 2024 & 2032
- Figure 39: Europe Smart Implantable Pumps Industry Revenue (Million), by Pump Type 2024 & 2032
- Figure 40: Europe Smart Implantable Pumps Industry Volume (K Units), by Pump Type 2024 & 2032
- Figure 41: Europe Smart Implantable Pumps Industry Revenue Share (%), by Pump Type 2024 & 2032
- Figure 42: Europe Smart Implantable Pumps Industry Volume Share (%), by Pump Type 2024 & 2032
- Figure 43: Europe Smart Implantable Pumps Industry Revenue (Million), by Application 2024 & 2032
- Figure 44: Europe Smart Implantable Pumps Industry Volume (K Units), by Application 2024 & 2032
- Figure 45: Europe Smart Implantable Pumps Industry Revenue Share (%), by Application 2024 & 2032
- Figure 46: Europe Smart Implantable Pumps Industry Volume Share (%), by Application 2024 & 2032
- Figure 47: Europe Smart Implantable Pumps Industry Revenue (Million), by End User 2024 & 2032
- Figure 48: Europe Smart Implantable Pumps Industry Volume (K Units), by End User 2024 & 2032
- Figure 49: Europe Smart Implantable Pumps Industry Revenue Share (%), by End User 2024 & 2032
- Figure 50: Europe Smart Implantable Pumps Industry Volume Share (%), by End User 2024 & 2032
- Figure 51: Europe Smart Implantable Pumps Industry Revenue (Million), by Country 2024 & 2032
- Figure 52: Europe Smart Implantable Pumps Industry Volume (K Units), by Country 2024 & 2032
- Figure 53: Europe Smart Implantable Pumps Industry Revenue Share (%), by Country 2024 & 2032
- Figure 54: Europe Smart Implantable Pumps Industry Volume Share (%), by Country 2024 & 2032
- Figure 55: Asia Pacific Smart Implantable Pumps Industry Revenue (Million), by Pump Type 2024 & 2032
- Figure 56: Asia Pacific Smart Implantable Pumps Industry Volume (K Units), by Pump Type 2024 & 2032
- Figure 57: Asia Pacific Smart Implantable Pumps Industry Revenue Share (%), by Pump Type 2024 & 2032
- Figure 58: Asia Pacific Smart Implantable Pumps Industry Volume Share (%), by Pump Type 2024 & 2032
- Figure 59: Asia Pacific Smart Implantable Pumps Industry Revenue (Million), by Application 2024 & 2032
- Figure 60: Asia Pacific Smart Implantable Pumps Industry Volume (K Units), by Application 2024 & 2032
- Figure 61: Asia Pacific Smart Implantable Pumps Industry Revenue Share (%), by Application 2024 & 2032
- Figure 62: Asia Pacific Smart Implantable Pumps Industry Volume Share (%), by Application 2024 & 2032
- Figure 63: Asia Pacific Smart Implantable Pumps Industry Revenue (Million), by End User 2024 & 2032
- Figure 64: Asia Pacific Smart Implantable Pumps Industry Volume (K Units), by End User 2024 & 2032
- Figure 65: Asia Pacific Smart Implantable Pumps Industry Revenue Share (%), by End User 2024 & 2032
- Figure 66: Asia Pacific Smart Implantable Pumps Industry Volume Share (%), by End User 2024 & 2032
- Figure 67: Asia Pacific Smart Implantable Pumps Industry Revenue (Million), by Country 2024 & 2032
- Figure 68: Asia Pacific Smart Implantable Pumps Industry Volume (K Units), by Country 2024 & 2032
- Figure 69: Asia Pacific Smart Implantable Pumps Industry Revenue Share (%), by Country 2024 & 2032
- Figure 70: Asia Pacific Smart Implantable Pumps Industry Volume Share (%), by Country 2024 & 2032
- Figure 71: Middle East and Africa Smart Implantable Pumps Industry Revenue (Million), by Pump Type 2024 & 2032
- Figure 72: Middle East and Africa Smart Implantable Pumps Industry Volume (K Units), by Pump Type 2024 & 2032
- Figure 73: Middle East and Africa Smart Implantable Pumps Industry Revenue Share (%), by Pump Type 2024 & 2032
- Figure 74: Middle East and Africa Smart Implantable Pumps Industry Volume Share (%), by Pump Type 2024 & 2032
- Figure 75: Middle East and Africa Smart Implantable Pumps Industry Revenue (Million), by Application 2024 & 2032
- Figure 76: Middle East and Africa Smart Implantable Pumps Industry Volume (K Units), by Application 2024 & 2032
- Figure 77: Middle East and Africa Smart Implantable Pumps Industry Revenue Share (%), by Application 2024 & 2032
- Figure 78: Middle East and Africa Smart Implantable Pumps Industry Volume Share (%), by Application 2024 & 2032
- Figure 79: Middle East and Africa Smart Implantable Pumps Industry Revenue (Million), by End User 2024 & 2032
- Figure 80: Middle East and Africa Smart Implantable Pumps Industry Volume (K Units), by End User 2024 & 2032
- Figure 81: Middle East and Africa Smart Implantable Pumps Industry Revenue Share (%), by End User 2024 & 2032
- Figure 82: Middle East and Africa Smart Implantable Pumps Industry Volume Share (%), by End User 2024 & 2032
- Figure 83: Middle East and Africa Smart Implantable Pumps Industry Revenue (Million), by Country 2024 & 2032
- Figure 84: Middle East and Africa Smart Implantable Pumps Industry Volume (K Units), by Country 2024 & 2032
- Figure 85: Middle East and Africa Smart Implantable Pumps Industry Revenue Share (%), by Country 2024 & 2032
- Figure 86: Middle East and Africa Smart Implantable Pumps Industry Volume Share (%), by Country 2024 & 2032
- Figure 87: South America Smart Implantable Pumps Industry Revenue (Million), by Pump Type 2024 & 2032
- Figure 88: South America Smart Implantable Pumps Industry Volume (K Units), by Pump Type 2024 & 2032
- Figure 89: South America Smart Implantable Pumps Industry Revenue Share (%), by Pump Type 2024 & 2032
- Figure 90: South America Smart Implantable Pumps Industry Volume Share (%), by Pump Type 2024 & 2032
- Figure 91: South America Smart Implantable Pumps Industry Revenue (Million), by Application 2024 & 2032
- Figure 92: South America Smart Implantable Pumps Industry Volume (K Units), by Application 2024 & 2032
- Figure 93: South America Smart Implantable Pumps Industry Revenue Share (%), by Application 2024 & 2032
- Figure 94: South America Smart Implantable Pumps Industry Volume Share (%), by Application 2024 & 2032
- Figure 95: South America Smart Implantable Pumps Industry Revenue (Million), by End User 2024 & 2032
- Figure 96: South America Smart Implantable Pumps Industry Volume (K Units), by End User 2024 & 2032
- Figure 97: South America Smart Implantable Pumps Industry Revenue Share (%), by End User 2024 & 2032
- Figure 98: South America Smart Implantable Pumps Industry Volume Share (%), by End User 2024 & 2032
- Figure 99: South America Smart Implantable Pumps Industry Revenue (Million), by Country 2024 & 2032
- Figure 100: South America Smart Implantable Pumps Industry Volume (K Units), by Country 2024 & 2032
- Figure 101: South America Smart Implantable Pumps Industry Revenue Share (%), by Country 2024 & 2032
- Figure 102: South America Smart Implantable Pumps Industry Volume Share (%), by Country 2024 & 2032
List of Tables
- Table 1: Global Smart Implantable Pumps Industry Revenue Million Forecast, by Region 2019 & 2032
- Table 2: Global Smart Implantable Pumps Industry Volume K Units Forecast, by Region 2019 & 2032
- Table 3: Global Smart Implantable Pumps Industry Revenue Million Forecast, by Pump Type 2019 & 2032
- Table 4: Global Smart Implantable Pumps Industry Volume K Units Forecast, by Pump Type 2019 & 2032
- Table 5: Global Smart Implantable Pumps Industry Revenue Million Forecast, by Application 2019 & 2032
- Table 6: Global Smart Implantable Pumps Industry Volume K Units Forecast, by Application 2019 & 2032
- Table 7: Global Smart Implantable Pumps Industry Revenue Million Forecast, by End User 2019 & 2032
- Table 8: Global Smart Implantable Pumps Industry Volume K Units Forecast, by End User 2019 & 2032
- Table 9: Global Smart Implantable Pumps Industry Revenue Million Forecast, by Region 2019 & 2032
- Table 10: Global Smart Implantable Pumps Industry Volume K Units Forecast, by Region 2019 & 2032
- Table 11: Global Smart Implantable Pumps Industry Revenue Million Forecast, by Country 2019 & 2032
- Table 12: Global Smart Implantable Pumps Industry Volume K Units Forecast, by Country 2019 & 2032
- Table 13: Global Smart Implantable Pumps Industry Revenue Million Forecast, by Country 2019 & 2032
- Table 14: Global Smart Implantable Pumps Industry Volume K Units Forecast, by Country 2019 & 2032
- Table 15: Global Smart Implantable Pumps Industry Revenue Million Forecast, by Country 2019 & 2032
- Table 16: Global Smart Implantable Pumps Industry Volume K Units Forecast, by Country 2019 & 2032
- Table 17: Global Smart Implantable Pumps Industry Revenue Million Forecast, by Country 2019 & 2032
- Table 18: Global Smart Implantable Pumps Industry Volume K Units Forecast, by Country 2019 & 2032
- Table 19: Global Smart Implantable Pumps Industry Revenue Million Forecast, by Country 2019 & 2032
- Table 20: Global Smart Implantable Pumps Industry Volume K Units Forecast, by Country 2019 & 2032
- Table 21: Global Smart Implantable Pumps Industry Revenue Million Forecast, by Pump Type 2019 & 2032
- Table 22: Global Smart Implantable Pumps Industry Volume K Units Forecast, by Pump Type 2019 & 2032
- Table 23: Global Smart Implantable Pumps Industry Revenue Million Forecast, by Application 2019 & 2032
- Table 24: Global Smart Implantable Pumps Industry Volume K Units Forecast, by Application 2019 & 2032
- Table 25: Global Smart Implantable Pumps Industry Revenue Million Forecast, by End User 2019 & 2032
- Table 26: Global Smart Implantable Pumps Industry Volume K Units Forecast, by End User 2019 & 2032
- Table 27: Global Smart Implantable Pumps Industry Revenue Million Forecast, by Country 2019 & 2032
- Table 28: Global Smart Implantable Pumps Industry Volume K Units Forecast, by Country 2019 & 2032
- Table 29: United States Smart Implantable Pumps Industry Revenue (Million) Forecast, by Application 2019 & 2032
- Table 30: United States Smart Implantable Pumps Industry Volume (K Units) Forecast, by Application 2019 & 2032
- Table 31: Canada Smart Implantable Pumps Industry Revenue (Million) Forecast, by Application 2019 & 2032
- Table 32: Canada Smart Implantable Pumps Industry Volume (K Units) Forecast, by Application 2019 & 2032
- Table 33: Mexico Smart Implantable Pumps Industry Revenue (Million) Forecast, by Application 2019 & 2032
- Table 34: Mexico Smart Implantable Pumps Industry Volume (K Units) Forecast, by Application 2019 & 2032
- Table 35: Global Smart Implantable Pumps Industry Revenue Million Forecast, by Pump Type 2019 & 2032
- Table 36: Global Smart Implantable Pumps Industry Volume K Units Forecast, by Pump Type 2019 & 2032
- Table 37: Global Smart Implantable Pumps Industry Revenue Million Forecast, by Application 2019 & 2032
- Table 38: Global Smart Implantable Pumps Industry Volume K Units Forecast, by Application 2019 & 2032
- Table 39: Global Smart Implantable Pumps Industry Revenue Million Forecast, by End User 2019 & 2032
- Table 40: Global Smart Implantable Pumps Industry Volume K Units Forecast, by End User 2019 & 2032
- Table 41: Global Smart Implantable Pumps Industry Revenue Million Forecast, by Country 2019 & 2032
- Table 42: Global Smart Implantable Pumps Industry Volume K Units Forecast, by Country 2019 & 2032
- Table 43: Germany Smart Implantable Pumps Industry Revenue (Million) Forecast, by Application 2019 & 2032
- Table 44: Germany Smart Implantable Pumps Industry Volume (K Units) Forecast, by Application 2019 & 2032
- Table 45: United Kingdom Smart Implantable Pumps Industry Revenue (Million) Forecast, by Application 2019 & 2032
- Table 46: United Kingdom Smart Implantable Pumps Industry Volume (K Units) Forecast, by Application 2019 & 2032
- Table 47: France Smart Implantable Pumps Industry Revenue (Million) Forecast, by Application 2019 & 2032
- Table 48: France Smart Implantable Pumps Industry Volume (K Units) Forecast, by Application 2019 & 2032
- Table 49: Italy Smart Implantable Pumps Industry Revenue (Million) Forecast, by Application 2019 & 2032
- Table 50: Italy Smart Implantable Pumps Industry Volume (K Units) Forecast, by Application 2019 & 2032
- Table 51: Spain Smart Implantable Pumps Industry Revenue (Million) Forecast, by Application 2019 & 2032
- Table 52: Spain Smart Implantable Pumps Industry Volume (K Units) Forecast, by Application 2019 & 2032
- Table 53: Rest of Europe Smart Implantable Pumps Industry Revenue (Million) Forecast, by Application 2019 & 2032
- Table 54: Rest of Europe Smart Implantable Pumps Industry Volume (K Units) Forecast, by Application 2019 & 2032
- Table 55: Global Smart Implantable Pumps Industry Revenue Million Forecast, by Pump Type 2019 & 2032
- Table 56: Global Smart Implantable Pumps Industry Volume K Units Forecast, by Pump Type 2019 & 2032
- Table 57: Global Smart Implantable Pumps Industry Revenue Million Forecast, by Application 2019 & 2032
- Table 58: Global Smart Implantable Pumps Industry Volume K Units Forecast, by Application 2019 & 2032
- Table 59: Global Smart Implantable Pumps Industry Revenue Million Forecast, by End User 2019 & 2032
- Table 60: Global Smart Implantable Pumps Industry Volume K Units Forecast, by End User 2019 & 2032
- Table 61: Global Smart Implantable Pumps Industry Revenue Million Forecast, by Country 2019 & 2032
- Table 62: Global Smart Implantable Pumps Industry Volume K Units Forecast, by Country 2019 & 2032
- Table 63: China Smart Implantable Pumps Industry Revenue (Million) Forecast, by Application 2019 & 2032
- Table 64: China Smart Implantable Pumps Industry Volume (K Units) Forecast, by Application 2019 & 2032
- Table 65: Japan Smart Implantable Pumps Industry Revenue (Million) Forecast, by Application 2019 & 2032
- Table 66: Japan Smart Implantable Pumps Industry Volume (K Units) Forecast, by Application 2019 & 2032
- Table 67: India Smart Implantable Pumps Industry Revenue (Million) Forecast, by Application 2019 & 2032
- Table 68: India Smart Implantable Pumps Industry Volume (K Units) Forecast, by Application 2019 & 2032
- Table 69: Australia Smart Implantable Pumps Industry Revenue (Million) Forecast, by Application 2019 & 2032
- Table 70: Australia Smart Implantable Pumps Industry Volume (K Units) Forecast, by Application 2019 & 2032
- Table 71: South Korea Smart Implantable Pumps Industry Revenue (Million) Forecast, by Application 2019 & 2032
- Table 72: South Korea Smart Implantable Pumps Industry Volume (K Units) Forecast, by Application 2019 & 2032
- Table 73: Rest of Asia Pacific Smart Implantable Pumps Industry Revenue (Million) Forecast, by Application 2019 & 2032
- Table 74: Rest of Asia Pacific Smart Implantable Pumps Industry Volume (K Units) Forecast, by Application 2019 & 2032
- Table 75: Global Smart Implantable Pumps Industry Revenue Million Forecast, by Pump Type 2019 & 2032
- Table 76: Global Smart Implantable Pumps Industry Volume K Units Forecast, by Pump Type 2019 & 2032
- Table 77: Global Smart Implantable Pumps Industry Revenue Million Forecast, by Application 2019 & 2032
- Table 78: Global Smart Implantable Pumps Industry Volume K Units Forecast, by Application 2019 & 2032
- Table 79: Global Smart Implantable Pumps Industry Revenue Million Forecast, by End User 2019 & 2032
- Table 80: Global Smart Implantable Pumps Industry Volume K Units Forecast, by End User 2019 & 2032
- Table 81: Global Smart Implantable Pumps Industry Revenue Million Forecast, by Country 2019 & 2032
- Table 82: Global Smart Implantable Pumps Industry Volume K Units Forecast, by Country 2019 & 2032
- Table 83: GCC Smart Implantable Pumps Industry Revenue (Million) Forecast, by Application 2019 & 2032
- Table 84: GCC Smart Implantable Pumps Industry Volume (K Units) Forecast, by Application 2019 & 2032
- Table 85: South Africa Smart Implantable Pumps Industry Revenue (Million) Forecast, by Application 2019 & 2032
- Table 86: South Africa Smart Implantable Pumps Industry Volume (K Units) Forecast, by Application 2019 & 2032
- Table 87: Rest of Middle East and Africa Smart Implantable Pumps Industry Revenue (Million) Forecast, by Application 2019 & 2032
- Table 88: Rest of Middle East and Africa Smart Implantable Pumps Industry Volume (K Units) Forecast, by Application 2019 & 2032
- Table 89: Global Smart Implantable Pumps Industry Revenue Million Forecast, by Pump Type 2019 & 2032
- Table 90: Global Smart Implantable Pumps Industry Volume K Units Forecast, by Pump Type 2019 & 2032
- Table 91: Global Smart Implantable Pumps Industry Revenue Million Forecast, by Application 2019 & 2032
- Table 92: Global Smart Implantable Pumps Industry Volume K Units Forecast, by Application 2019 & 2032
- Table 93: Global Smart Implantable Pumps Industry Revenue Million Forecast, by End User 2019 & 2032
- Table 94: Global Smart Implantable Pumps Industry Volume K Units Forecast, by End User 2019 & 2032
- Table 95: Global Smart Implantable Pumps Industry Revenue Million Forecast, by Country 2019 & 2032
- Table 96: Global Smart Implantable Pumps Industry Volume K Units Forecast, by Country 2019 & 2032
- Table 97: Brazil Smart Implantable Pumps Industry Revenue (Million) Forecast, by Application 2019 & 2032
- Table 98: Brazil Smart Implantable Pumps Industry Volume (K Units) Forecast, by Application 2019 & 2032
- Table 99: Argentina Smart Implantable Pumps Industry Revenue (Million) Forecast, by Application 2019 & 2032
- Table 100: Argentina Smart Implantable Pumps Industry Volume (K Units) Forecast, by Application 2019 & 2032
- Table 101: Rest of South America Smart Implantable Pumps Industry Revenue (Million) Forecast, by Application 2019 & 2032
- Table 102: Rest of South America Smart Implantable Pumps Industry Volume (K Units) Forecast, by Application 2019 & 2032
Frequently Asked Questions
1. What is the projected Compound Annual Growth Rate (CAGR) of the Smart Implantable Pumps Industry?
The projected CAGR is approximately 6.55%.
2. Which companies are prominent players in the Smart Implantable Pumps Industry?
Key companies in the market include Cognos Therapeutics Inc, i2o Therapeutics Inc, Medtronic, Abbott Laboratories, Insulet Corporation, OrphaCare GmbH, Tandem Diabetes, Intera Oncology.
3. What are the main segments of the Smart Implantable Pumps Industry?
The market segments include Pump Type, Application, End User.
4. Can you provide details about the market size?
The market size is estimated to be USD 2.46 Million as of 2022.
5. What are some drivers contributing to market growth?
High Prevalence and Incidence of Chronic Diseases such as Spasticity & Chronic Pain; Growing Geriatric Population; Growing Healthcare Consciousness. Rising Healthcare Expenditure and Favorable Reimbursement Policies.
6. What are the notable trends driving market growth?
Cardiovascular Segment is Expected to Witness a Significant Growth Over the Forecast Period.
7. Are there any restraints impacting market growth?
Stringent Regulatory Framework and Product Recalls.
8. Can you provide examples of recent developments in the market?
In August 2023, the US FDA approved ICU Medical Inc.’s Plum Duo infusion pump with LifeShield infusion safety software for commercial use.
9. What pricing options are available for accessing the report?
Pricing options include single-user, multi-user, and enterprise licenses priced at USD 4750, USD 5250, and USD 8750 respectively.
10. Is the market size provided in terms of value or volume?
The market size is provided in terms of value, measured in Million and volume, measured in K Units.
11. Are there any specific market keywords associated with the report?
Yes, the market keyword associated with the report is "Smart Implantable Pumps Industry," which aids in identifying and referencing the specific market segment covered.
12. How do I determine which pricing option suits my needs best?
The pricing options vary based on user requirements and access needs. Individual users may opt for single-user licenses, while businesses requiring broader access may choose multi-user or enterprise licenses for cost-effective access to the report.
13. Are there any additional resources or data provided in the Smart Implantable Pumps Industry report?
While the report offers comprehensive insights, it's advisable to review the specific contents or supplementary materials provided to ascertain if additional resources or data are available.
14. How can I stay updated on further developments or reports in the Smart Implantable Pumps Industry?
To stay informed about further developments, trends, and reports in the Smart Implantable Pumps Industry, consider subscribing to industry newsletters, following relevant companies and organizations, or regularly checking reputable industry news sources and publications.
Methodology
Step 1 - Identification of Relevant Samples Size from Population Database


Step 2 - Approaches for Defining Global Market Size (Value, Volume* & Price*)

Note*: In applicable scenarios
Step 3 - Data Sources
Primary Research
- Web Analytics
- Survey Reports
- Research Institute
- Latest Research Reports
- Opinion Leaders
Secondary Research
- Annual Reports
- White Paper
- Latest Press Release
- Industry Association
- Paid Database
- Investor Presentations

Step 4 - Data Triangulation
Involves using different sources of information in order to increase the validity of a study
These sources are likely to be stakeholders in a program - participants, other researchers, program staff, other community members, and so on.
Then we put all data in single framework & apply various statistical tools to find out the dynamic on the market.
During the analysis stage, feedback from the stakeholder groups would be compared to determine areas of agreement as well as areas of divergence


