
Key Insights
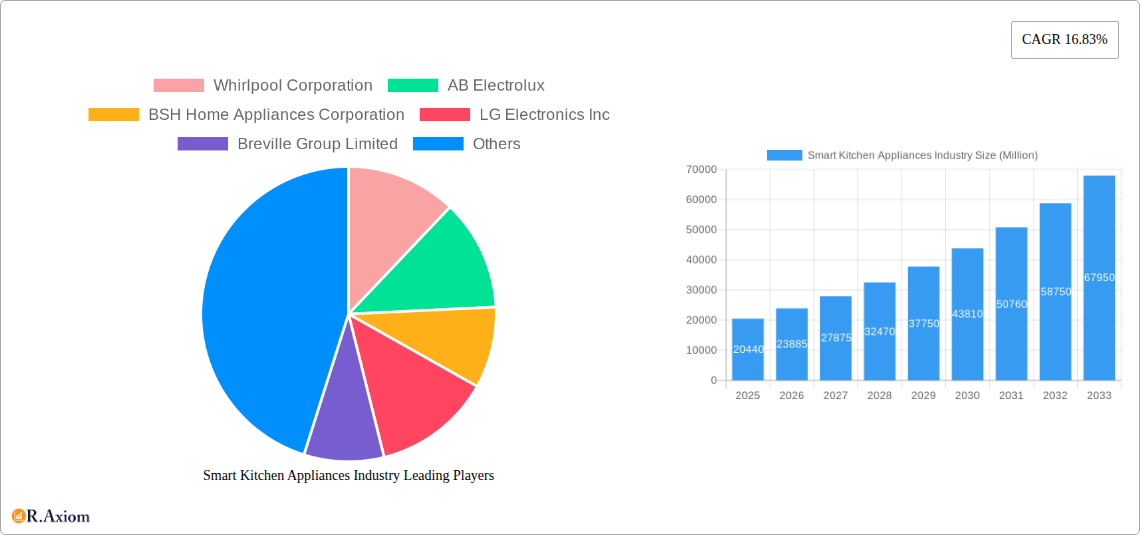
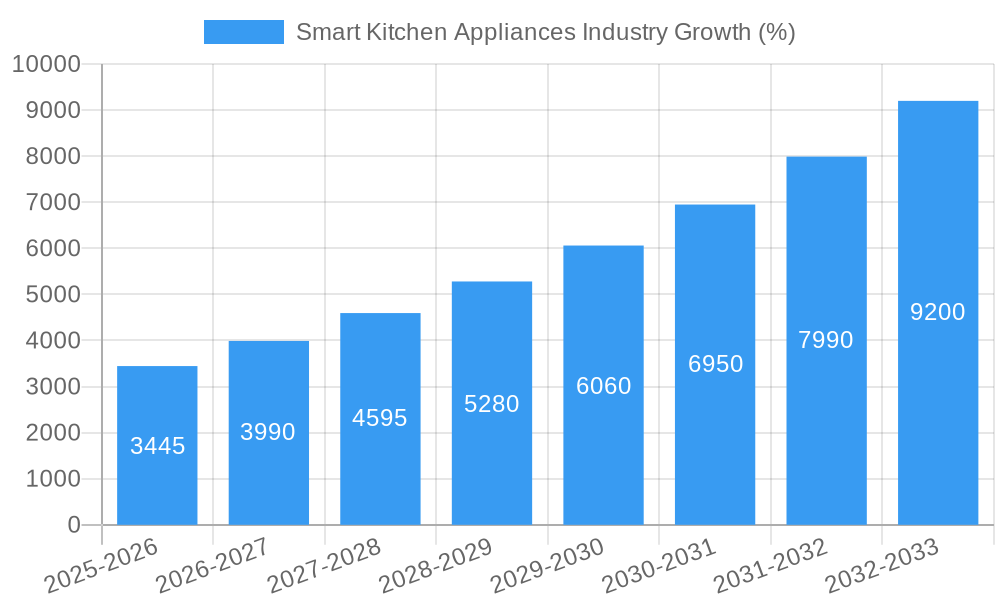
The global smart kitchen appliances market is experiencing robust growth, projected to reach \$20.44 billion in 2025 and exhibiting a Compound Annual Growth Rate (CAGR) of 16.83% from 2025 to 2033. This expansion is driven by several key factors. The increasing adoption of smart home technology, coupled with a rising demand for convenience and energy efficiency, fuels consumer interest in connected appliances. Furthermore, advancements in artificial intelligence (AI) and the Internet of Things (IoT) are leading to more sophisticated appliances with enhanced features, such as voice control, automated cooking functions, and intelligent inventory management. The integration of these technologies into everyday kitchen appliances streamlines cooking processes, reduces food waste, and improves overall kitchen efficiency. This trend is particularly pronounced in developed regions like North America and Europe, where disposable incomes are higher, and technological adoption rates are significant. However, the market also faces challenges, such as the relatively high initial cost of smart appliances and concerns regarding data privacy and security.
The market segmentation reveals significant opportunities across various product types. Smart refrigerators, with their inventory tracking and personalized recommendations, are leading the charge. Smart ovens and dishwashers also contribute significantly to market growth, driven by their automation capabilities and convenience. The growth of online retail channels is further accelerating market penetration, allowing consumers easy access to a wide range of products. While residential consumers represent the largest segment, the commercial sector is also exhibiting increasing adoption, particularly in restaurants and hotels seeking to optimize operations and enhance customer experience. Key players like Whirlpool, Electrolux, and Samsung are actively investing in research and development to innovate and expand their product portfolios, driving further market competition and innovation. Geographic growth is expected across all regions, with Asia Pacific exhibiting high potential driven by increasing urbanization and rising middle-class disposable incomes.
Smart Kitchen Appliances Industry: A Comprehensive Market Report (2019-2033)
This in-depth report provides a comprehensive analysis of the global smart kitchen appliances industry, covering market size, segmentation, growth drivers, challenges, and key players. The study period spans from 2019 to 2033, with 2025 serving as the base and estimated year. The report offers invaluable insights for industry stakeholders, investors, and businesses seeking to navigate this dynamic market. The total market value is predicted to reach xx Million by 2033.
Smart Kitchen Appliances Industry Market Concentration & Innovation
The smart kitchen appliances market exhibits a moderately concentrated landscape, with key players like Whirlpool Corporation, AB Electrolux, BSH Home Appliances Corporation, and Samsung Electronics Co Ltd holding significant market share. However, the presence of several smaller, innovative companies contributes to competitive dynamics. Market share data for 2024 reveals Whirlpool Corporation holds approximately 15% market share, followed by AB Electrolux at 12%, and BSH Home Appliances Corporation at 10%. Samsung Electronics Co Ltd holds approximately 8% market share.
Innovation Drivers:
- Increasing consumer demand for convenience and smart home integration.
- Advancements in AI, IoT, and connectivity technologies.
- Focus on energy efficiency and sustainability.
Regulatory Frameworks:
- Government regulations concerning energy consumption and safety standards influence product development.
- Data privacy concerns related to connected appliances are shaping industry practices.
Product Substitutes:
- Traditional kitchen appliances pose a significant competitive threat.
- The emergence of subscription-based services offering meal preparation and delivery also impacts the market.
End-User Trends:
- Growing adoption of smart home ecosystems and integrated appliances.
- Shift towards personalized and customized kitchen solutions.
M&A Activities:
- The industry has witnessed several mergers and acquisitions in recent years, with deal values ranging from xx Million to xx Million, primarily driven by expansion strategies and technological advancements. For example, in 2022, a major acquisition valued at approximately xx Million consolidated two leading smart oven manufacturers.
Smart Kitchen Appliances Industry Industry Trends & Insights
The global smart kitchen appliances market is experiencing robust growth, driven by several key factors. The market registered a CAGR of xx% during the historical period (2019-2024) and is projected to maintain a CAGR of xx% during the forecast period (2025-2033). This growth is fueled by increasing disposable incomes, urbanization, and a rising preference for convenient and technologically advanced kitchen appliances. Market penetration of smart refrigerators, a key segment, is estimated at 25% in 2025, with projections indicating a significant rise to 45% by 2033.
Technological disruptions, such as the integration of AI and machine learning, are significantly impacting the industry. Consumers are increasingly attracted to features like voice control, automated cooking functions, and remote monitoring capabilities. This preference for personalization and smart home integration is driving innovation and shaping product development. The competitive dynamics are intense, with established players and new entrants vying for market share through product differentiation, strategic partnerships, and aggressive marketing campaigns.
Dominant Markets & Segments in Smart Kitchen Appliances Industry
Leading Regions/Countries:
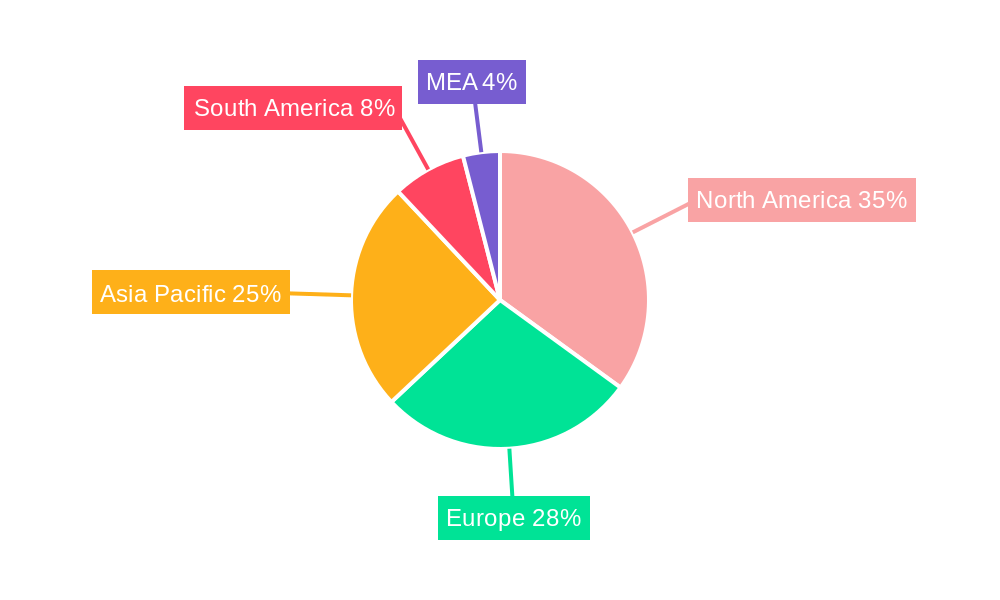
North America and Europe currently dominate the smart kitchen appliances market due to higher disposable incomes, early adoption of technology, and established infrastructure for smart home solutions. However, Asia-Pacific is exhibiting the fastest growth rate, driven by increasing urbanization and rising consumer spending.
Dominant Segments:
- By Product Type: Smart refrigerators constitute the largest segment, followed by smart ovens and smart dishwashers. This is driven by their wide-ranging functionalities, enhancing convenience and efficiency. Smart cookware and cooktops are experiencing the highest growth rate.
- By Distribution Channel: Online sales are growing rapidly, owing to the increasing popularity of e-commerce and user convenience. However, multi-brand stores remain the dominant distribution channel.
- By End-User: The residential segment accounts for the majority of market share, with commercial applications showing considerable growth potential in areas such as restaurants and hotels.
Key Drivers:
- North America: High disposable incomes, technological advancement, and strong consumer preference for smart home technology.
- Europe: Well-developed smart home infrastructure and a focus on energy-efficient appliances.
- Asia-Pacific: Rapid urbanization, increasing disposable incomes, and a young population embracing new technologies.
Smart Kitchen Appliances Industry Product Developments
Recent product innovations focus on enhanced connectivity, AI-powered features, and personalized user experiences. Manufacturers are integrating advanced sensors, cloud connectivity, and voice assistants to offer seamless integration with smart home ecosystems. This includes features like automated recipe suggestions, intelligent inventory management, and remote appliance control. These advancements aim to improve cooking efficiency, reduce food waste, and enhance the overall kitchen experience, providing a significant competitive advantage to early adopters.
Report Scope & Segmentation Analysis
This report provides a comprehensive analysis of the smart kitchen appliances market, segmented by product type (smart ovens, smart dishwashers, smart refrigerators, smart cookware and cooktops, smart scale and thermometers, other product types), distribution channel (multi-brand stores, exclusive stores, online, other distribution channels), and end-user (residential, commercial). Each segment’s growth projection, market size, and competitive dynamics are analyzed in detail, providing a granular view of the market landscape. For instance, the smart refrigerator segment is projected to experience significant growth due to its diverse functionalities.
Key Drivers of Smart Kitchen Appliances Industry Growth
Several factors contribute to the growth of the smart kitchen appliances market. Technological advancements, including AI and IoT integration, are driving innovation and creating new functionalities. Rising disposable incomes, particularly in developing economies, are increasing consumer purchasing power. Government initiatives promoting energy efficiency and sustainable practices also encourage the adoption of smart appliances. Furthermore, changing consumer lifestyles, with a growing focus on convenience and time optimization, bolster the market's expansion.
Challenges in the Smart Kitchen Appliances Industry Sector
The smart kitchen appliances industry faces several challenges. High initial costs associated with smart appliances might deter some consumers. Concerns regarding data privacy and security are also significant, requiring robust security measures. Supply chain disruptions, especially those experienced recently, can impact production and delivery timelines. The market also encounters intense competition from established and emerging players, necessitating continuous product innovation. The total impact of these challenges is estimated to reduce the overall market growth by approximately 2% annually.
Emerging Opportunities in Smart Kitchen Appliances Industry
Several emerging opportunities exist within the smart kitchen appliances market. The growing popularity of smart home ecosystems provides opportunities for integration and expansion. The rising demand for personalized and customized appliances presents scope for tailoring products to individual needs. Expansion into developing markets with growing middle-class populations holds considerable potential. Advancements in sustainable technologies, focusing on energy efficiency and water conservation, present a significant opportunity to capture environmentally conscious consumer segments.
Leading Players in the Smart Kitchen Appliances Industry Market
- Whirlpool Corporation
- AB Electrolux
- BSH Home Appliances Corporation
- LG Electronics Inc
- Breville Group Limited
- Miele
- Samsung Electronics Co Ltd
- Haier Group
- Philips
- Panasonic Corporation
Key Developments in Smart Kitchen Appliances Industry Industry
- May 2023: LG Electronics released the InstaView refrigerator featuring customizable color-changing door panels (up to 190,000 color combinations), enhancing personalization.
- January 2023: Samsung Electronics introduced enhancements to its Bespoke Home series, including new refrigerator models and AI Pro Cooking capabilities for its Bespoke AI Oven, focusing on personalization and sustainability.
Strategic Outlook for Smart Kitchen Appliances Industry Market
The smart kitchen appliances market is poised for continued growth, driven by technological advancements, evolving consumer preferences, and expansion into new markets. Strategic partnerships, focused innovation, and addressing the challenges related to data privacy and supply chain will be crucial for success. The market's future hinges on providing seamless integration within smart home ecosystems, personalized user experiences, and sustainable solutions. The integration of advanced features like AI-powered recipe generation and automated meal planning will further drive growth and consumer adoption.
Smart Kitchen Appliances Industry Segmentation
-
1. Product Type
- 1.1. Smart Ovens
- 1.2. Smart Dishwashers
- 1.3. Smart Refrigerators
- 1.4. Smart Cookware and Cooktops
- 1.5. Smart Scale and Thermometers
- 1.6. Other Product Types
-
2. Distribution Channel
- 2.1. Multi-brand Stores
- 2.2. Exclusive Stores
- 2.3. Online
- 2.4. Other Distribution Channels
-
3. End User
- 3.1. Residential
- 3.2. Commercial
Smart Kitchen Appliances Industry Segmentation By Geography
- 1. North America
- 2. Europe
- 3. Asia Pacific
- 4. South America
- 5. Middle East
Smart Kitchen Appliances Industry REPORT HIGHLIGHTS
| Aspects | Details |
|---|---|
| Study Period | 2019-2033 |
| Base Year | 2024 |
| Estimated Year | 2025 |
| Forecast Period | 2025-2033 |
| Historical Period | 2019-2024 |
| Growth Rate | CAGR of 16.83% from 2019-2033 |
| Segmentation |
|
Table of Contents
- 1. Introduction
- 1.1. Research Scope
- 1.2. Market Segmentation
- 1.3. Research Methodology
- 1.4. Definitions and Assumptions
- 2. Executive Summary
- 2.1. Introduction
- 3. Market Dynamics
- 3.1. Introduction
- 3.2. Market Drivers
- 3.2.1. The Growth in the Hospitality Sector is Shifting to Commercial Smart Kitchen Appliances; Surge in Urban Population and Rise in Expenditure on Home Renovations Driving Market Growth
- 3.3. Market Restrains
- 3.3.1. Concerns About Data Privacy Among End Users Can Impedes Market Growth; High Cost of Maintenance and Upkeep
- 3.4. Market Trends
- 3.4.1. The Rising Adoption of Artificial Intelligence in Smart Kitchen Appliances
- 4. Market Factor Analysis
- 4.1. Porters Five Forces
- 4.2. Supply/Value Chain
- 4.3. PESTEL analysis
- 4.4. Market Entropy
- 4.5. Patent/Trademark Analysis
- 5. Global Smart Kitchen Appliances Industry Analysis, Insights and Forecast, 2019-2031
- 5.1. Market Analysis, Insights and Forecast - by Product Type
- 5.1.1. Smart Ovens
- 5.1.2. Smart Dishwashers
- 5.1.3. Smart Refrigerators
- 5.1.4. Smart Cookware and Cooktops
- 5.1.5. Smart Scale and Thermometers
- 5.1.6. Other Product Types
- 5.2. Market Analysis, Insights and Forecast - by Distribution Channel
- 5.2.1. Multi-brand Stores
- 5.2.2. Exclusive Stores
- 5.2.3. Online
- 5.2.4. Other Distribution Channels
- 5.3. Market Analysis, Insights and Forecast - by End User
- 5.3.1. Residential
- 5.3.2. Commercial
- 5.4. Market Analysis, Insights and Forecast - by Region
- 5.4.1. North America
- 5.4.2. Europe
- 5.4.3. Asia Pacific
- 5.4.4. South America
- 5.4.5. Middle East
- 5.1. Market Analysis, Insights and Forecast - by Product Type
- 6. North America Smart Kitchen Appliances Industry Analysis, Insights and Forecast, 2019-2031
- 6.1. Market Analysis, Insights and Forecast - by Product Type
- 6.1.1. Smart Ovens
- 6.1.2. Smart Dishwashers
- 6.1.3. Smart Refrigerators
- 6.1.4. Smart Cookware and Cooktops
- 6.1.5. Smart Scale and Thermometers
- 6.1.6. Other Product Types
- 6.2. Market Analysis, Insights and Forecast - by Distribution Channel
- 6.2.1. Multi-brand Stores
- 6.2.2. Exclusive Stores
- 6.2.3. Online
- 6.2.4. Other Distribution Channels
- 6.3. Market Analysis, Insights and Forecast - by End User
- 6.3.1. Residential
- 6.3.2. Commercial
- 6.1. Market Analysis, Insights and Forecast - by Product Type
- 7. Europe Smart Kitchen Appliances Industry Analysis, Insights and Forecast, 2019-2031
- 7.1. Market Analysis, Insights and Forecast - by Product Type
- 7.1.1. Smart Ovens
- 7.1.2. Smart Dishwashers
- 7.1.3. Smart Refrigerators
- 7.1.4. Smart Cookware and Cooktops
- 7.1.5. Smart Scale and Thermometers
- 7.1.6. Other Product Types
- 7.2. Market Analysis, Insights and Forecast - by Distribution Channel
- 7.2.1. Multi-brand Stores
- 7.2.2. Exclusive Stores
- 7.2.3. Online
- 7.2.4. Other Distribution Channels
- 7.3. Market Analysis, Insights and Forecast - by End User
- 7.3.1. Residential
- 7.3.2. Commercial
- 7.1. Market Analysis, Insights and Forecast - by Product Type
- 8. Asia Pacific Smart Kitchen Appliances Industry Analysis, Insights and Forecast, 2019-2031
- 8.1. Market Analysis, Insights and Forecast - by Product Type
- 8.1.1. Smart Ovens
- 8.1.2. Smart Dishwashers
- 8.1.3. Smart Refrigerators
- 8.1.4. Smart Cookware and Cooktops
- 8.1.5. Smart Scale and Thermometers
- 8.1.6. Other Product Types
- 8.2. Market Analysis, Insights and Forecast - by Distribution Channel
- 8.2.1. Multi-brand Stores
- 8.2.2. Exclusive Stores
- 8.2.3. Online
- 8.2.4. Other Distribution Channels
- 8.3. Market Analysis, Insights and Forecast - by End User
- 8.3.1. Residential
- 8.3.2. Commercial
- 8.1. Market Analysis, Insights and Forecast - by Product Type
- 9. South America Smart Kitchen Appliances Industry Analysis, Insights and Forecast, 2019-2031
- 9.1. Market Analysis, Insights and Forecast - by Product Type
- 9.1.1. Smart Ovens
- 9.1.2. Smart Dishwashers
- 9.1.3. Smart Refrigerators
- 9.1.4. Smart Cookware and Cooktops
- 9.1.5. Smart Scale and Thermometers
- 9.1.6. Other Product Types
- 9.2. Market Analysis, Insights and Forecast - by Distribution Channel
- 9.2.1. Multi-brand Stores
- 9.2.2. Exclusive Stores
- 9.2.3. Online
- 9.2.4. Other Distribution Channels
- 9.3. Market Analysis, Insights and Forecast - by End User
- 9.3.1. Residential
- 9.3.2. Commercial
- 9.1. Market Analysis, Insights and Forecast - by Product Type
- 10. Middle East Smart Kitchen Appliances Industry Analysis, Insights and Forecast, 2019-2031
- 10.1. Market Analysis, Insights and Forecast - by Product Type
- 10.1.1. Smart Ovens
- 10.1.2. Smart Dishwashers
- 10.1.3. Smart Refrigerators
- 10.1.4. Smart Cookware and Cooktops
- 10.1.5. Smart Scale and Thermometers
- 10.1.6. Other Product Types
- 10.2. Market Analysis, Insights and Forecast - by Distribution Channel
- 10.2.1. Multi-brand Stores
- 10.2.2. Exclusive Stores
- 10.2.3. Online
- 10.2.4. Other Distribution Channels
- 10.3. Market Analysis, Insights and Forecast - by End User
- 10.3.1. Residential
- 10.3.2. Commercial
- 10.1. Market Analysis, Insights and Forecast - by Product Type
- 11. North America Smart Kitchen Appliances Industry Analysis, Insights and Forecast, 2019-2031
- 11.1. Market Analysis, Insights and Forecast - By Country/Sub-region
- 11.1.1 United States
- 11.1.2 Canada
- 11.1.3 Mexico
- 12. Europe Smart Kitchen Appliances Industry Analysis, Insights and Forecast, 2019-2031
- 12.1. Market Analysis, Insights and Forecast - By Country/Sub-region
- 12.1.1 Germany
- 12.1.2 United Kingdom
- 12.1.3 France
- 12.1.4 Spain
- 12.1.5 Italy
- 12.1.6 Spain
- 12.1.7 Belgium
- 12.1.8 Netherland
- 12.1.9 Nordics
- 12.1.10 Rest of Europe
- 13. Asia Pacific Smart Kitchen Appliances Industry Analysis, Insights and Forecast, 2019-2031
- 13.1. Market Analysis, Insights and Forecast - By Country/Sub-region
- 13.1.1 China
- 13.1.2 Japan
- 13.1.3 India
- 13.1.4 South Korea
- 13.1.5 Southeast Asia
- 13.1.6 Australia
- 13.1.7 Indonesia
- 13.1.8 Phillipes
- 13.1.9 Singapore
- 13.1.10 Thailandc
- 13.1.11 Rest of Asia Pacific
- 14. South America Smart Kitchen Appliances Industry Analysis, Insights and Forecast, 2019-2031
- 14.1. Market Analysis, Insights and Forecast - By Country/Sub-region
- 14.1.1 Brazil
- 14.1.2 Argentina
- 14.1.3 Peru
- 14.1.4 Chile
- 14.1.5 Colombia
- 14.1.6 Ecuador
- 14.1.7 Venezuela
- 14.1.8 Rest of South America
- 15. MEA Smart Kitchen Appliances Industry Analysis, Insights and Forecast, 2019-2031
- 15.1. Market Analysis, Insights and Forecast - By Country/Sub-region
- 15.1.1 United Arab Emirates
- 15.1.2 Saudi Arabia
- 15.1.3 South Africa
- 15.1.4 Rest of Middle East and Africa
- 16. Competitive Analysis
- 16.1. Global Market Share Analysis 2024
- 16.2. Company Profiles
- 16.2.1 Whirlpool Corporation
- 16.2.1.1. Overview
- 16.2.1.2. Products
- 16.2.1.3. SWOT Analysis
- 16.2.1.4. Recent Developments
- 16.2.1.5. Financials (Based on Availability)
- 16.2.2 AB Electrolux
- 16.2.2.1. Overview
- 16.2.2.2. Products
- 16.2.2.3. SWOT Analysis
- 16.2.2.4. Recent Developments
- 16.2.2.5. Financials (Based on Availability)
- 16.2.3 BSH Home Appliances Corporation
- 16.2.3.1. Overview
- 16.2.3.2. Products
- 16.2.3.3. SWOT Analysis
- 16.2.3.4. Recent Developments
- 16.2.3.5. Financials (Based on Availability)
- 16.2.4 LG Electronics Inc
- 16.2.4.1. Overview
- 16.2.4.2. Products
- 16.2.4.3. SWOT Analysis
- 16.2.4.4. Recent Developments
- 16.2.4.5. Financials (Based on Availability)
- 16.2.5 Breville Group Limited
- 16.2.5.1. Overview
- 16.2.5.2. Products
- 16.2.5.3. SWOT Analysis
- 16.2.5.4. Recent Developments
- 16.2.5.5. Financials (Based on Availability)
- 16.2.6 Miele
- 16.2.6.1. Overview
- 16.2.6.2. Products
- 16.2.6.3. SWOT Analysis
- 16.2.6.4. Recent Developments
- 16.2.6.5. Financials (Based on Availability)
- 16.2.7 Samsung Electronics Co Ltd
- 16.2.7.1. Overview
- 16.2.7.2. Products
- 16.2.7.3. SWOT Analysis
- 16.2.7.4. Recent Developments
- 16.2.7.5. Financials (Based on Availability)
- 16.2.8 Haier Group
- 16.2.8.1. Overview
- 16.2.8.2. Products
- 16.2.8.3. SWOT Analysis
- 16.2.8.4. Recent Developments
- 16.2.8.5. Financials (Based on Availability)
- 16.2.9 Philips
- 16.2.9.1. Overview
- 16.2.9.2. Products
- 16.2.9.3. SWOT Analysis
- 16.2.9.4. Recent Developments
- 16.2.9.5. Financials (Based on Availability)
- 16.2.10 Panasonic Corporation
- 16.2.10.1. Overview
- 16.2.10.2. Products
- 16.2.10.3. SWOT Analysis
- 16.2.10.4. Recent Developments
- 16.2.10.5. Financials (Based on Availability)
- 16.2.1 Whirlpool Corporation
List of Figures
- Figure 1: Global Smart Kitchen Appliances Industry Revenue Breakdown (Million, %) by Region 2024 & 2032
- Figure 2: North America Smart Kitchen Appliances Industry Revenue (Million), by Country 2024 & 2032
- Figure 3: North America Smart Kitchen Appliances Industry Revenue Share (%), by Country 2024 & 2032
- Figure 4: Europe Smart Kitchen Appliances Industry Revenue (Million), by Country 2024 & 2032
- Figure 5: Europe Smart Kitchen Appliances Industry Revenue Share (%), by Country 2024 & 2032
- Figure 6: Asia Pacific Smart Kitchen Appliances Industry Revenue (Million), by Country 2024 & 2032
- Figure 7: Asia Pacific Smart Kitchen Appliances Industry Revenue Share (%), by Country 2024 & 2032
- Figure 8: South America Smart Kitchen Appliances Industry Revenue (Million), by Country 2024 & 2032
- Figure 9: South America Smart Kitchen Appliances Industry Revenue Share (%), by Country 2024 & 2032
- Figure 10: MEA Smart Kitchen Appliances Industry Revenue (Million), by Country 2024 & 2032
- Figure 11: MEA Smart Kitchen Appliances Industry Revenue Share (%), by Country 2024 & 2032
- Figure 12: North America Smart Kitchen Appliances Industry Revenue (Million), by Product Type 2024 & 2032
- Figure 13: North America Smart Kitchen Appliances Industry Revenue Share (%), by Product Type 2024 & 2032
- Figure 14: North America Smart Kitchen Appliances Industry Revenue (Million), by Distribution Channel 2024 & 2032
- Figure 15: North America Smart Kitchen Appliances Industry Revenue Share (%), by Distribution Channel 2024 & 2032
- Figure 16: North America Smart Kitchen Appliances Industry Revenue (Million), by End User 2024 & 2032
- Figure 17: North America Smart Kitchen Appliances Industry Revenue Share (%), by End User 2024 & 2032
- Figure 18: North America Smart Kitchen Appliances Industry Revenue (Million), by Country 2024 & 2032
- Figure 19: North America Smart Kitchen Appliances Industry Revenue Share (%), by Country 2024 & 2032
- Figure 20: Europe Smart Kitchen Appliances Industry Revenue (Million), by Product Type 2024 & 2032
- Figure 21: Europe Smart Kitchen Appliances Industry Revenue Share (%), by Product Type 2024 & 2032
- Figure 22: Europe Smart Kitchen Appliances Industry Revenue (Million), by Distribution Channel 2024 & 2032
- Figure 23: Europe Smart Kitchen Appliances Industry Revenue Share (%), by Distribution Channel 2024 & 2032
- Figure 24: Europe Smart Kitchen Appliances Industry Revenue (Million), by End User 2024 & 2032
- Figure 25: Europe Smart Kitchen Appliances Industry Revenue Share (%), by End User 2024 & 2032
- Figure 26: Europe Smart Kitchen Appliances Industry Revenue (Million), by Country 2024 & 2032
- Figure 27: Europe Smart Kitchen Appliances Industry Revenue Share (%), by Country 2024 & 2032
- Figure 28: Asia Pacific Smart Kitchen Appliances Industry Revenue (Million), by Product Type 2024 & 2032
- Figure 29: Asia Pacific Smart Kitchen Appliances Industry Revenue Share (%), by Product Type 2024 & 2032
- Figure 30: Asia Pacific Smart Kitchen Appliances Industry Revenue (Million), by Distribution Channel 2024 & 2032
- Figure 31: Asia Pacific Smart Kitchen Appliances Industry Revenue Share (%), by Distribution Channel 2024 & 2032
- Figure 32: Asia Pacific Smart Kitchen Appliances Industry Revenue (Million), by End User 2024 & 2032
- Figure 33: Asia Pacific Smart Kitchen Appliances Industry Revenue Share (%), by End User 2024 & 2032
- Figure 34: Asia Pacific Smart Kitchen Appliances Industry Revenue (Million), by Country 2024 & 2032
- Figure 35: Asia Pacific Smart Kitchen Appliances Industry Revenue Share (%), by Country 2024 & 2032
- Figure 36: South America Smart Kitchen Appliances Industry Revenue (Million), by Product Type 2024 & 2032
- Figure 37: South America Smart Kitchen Appliances Industry Revenue Share (%), by Product Type 2024 & 2032
- Figure 38: South America Smart Kitchen Appliances Industry Revenue (Million), by Distribution Channel 2024 & 2032
- Figure 39: South America Smart Kitchen Appliances Industry Revenue Share (%), by Distribution Channel 2024 & 2032
- Figure 40: South America Smart Kitchen Appliances Industry Revenue (Million), by End User 2024 & 2032
- Figure 41: South America Smart Kitchen Appliances Industry Revenue Share (%), by End User 2024 & 2032
- Figure 42: South America Smart Kitchen Appliances Industry Revenue (Million), by Country 2024 & 2032
- Figure 43: South America Smart Kitchen Appliances Industry Revenue Share (%), by Country 2024 & 2032
- Figure 44: Middle East Smart Kitchen Appliances Industry Revenue (Million), by Product Type 2024 & 2032
- Figure 45: Middle East Smart Kitchen Appliances Industry Revenue Share (%), by Product Type 2024 & 2032
- Figure 46: Middle East Smart Kitchen Appliances Industry Revenue (Million), by Distribution Channel 2024 & 2032
- Figure 47: Middle East Smart Kitchen Appliances Industry Revenue Share (%), by Distribution Channel 2024 & 2032
- Figure 48: Middle East Smart Kitchen Appliances Industry Revenue (Million), by End User 2024 & 2032
- Figure 49: Middle East Smart Kitchen Appliances Industry Revenue Share (%), by End User 2024 & 2032
- Figure 50: Middle East Smart Kitchen Appliances Industry Revenue (Million), by Country 2024 & 2032
- Figure 51: Middle East Smart Kitchen Appliances Industry Revenue Share (%), by Country 2024 & 2032
List of Tables
- Table 1: Global Smart Kitchen Appliances Industry Revenue Million Forecast, by Region 2019 & 2032
- Table 2: Global Smart Kitchen Appliances Industry Revenue Million Forecast, by Product Type 2019 & 2032
- Table 3: Global Smart Kitchen Appliances Industry Revenue Million Forecast, by Distribution Channel 2019 & 2032
- Table 4: Global Smart Kitchen Appliances Industry Revenue Million Forecast, by End User 2019 & 2032
- Table 5: Global Smart Kitchen Appliances Industry Revenue Million Forecast, by Region 2019 & 2032
- Table 6: Global Smart Kitchen Appliances Industry Revenue Million Forecast, by Country 2019 & 2032
- Table 7: United States Smart Kitchen Appliances Industry Revenue (Million) Forecast, by Application 2019 & 2032
- Table 8: Canada Smart Kitchen Appliances Industry Revenue (Million) Forecast, by Application 2019 & 2032
- Table 9: Mexico Smart Kitchen Appliances Industry Revenue (Million) Forecast, by Application 2019 & 2032
- Table 10: Global Smart Kitchen Appliances Industry Revenue Million Forecast, by Country 2019 & 2032
- Table 11: Germany Smart Kitchen Appliances Industry Revenue (Million) Forecast, by Application 2019 & 2032
- Table 12: United Kingdom Smart Kitchen Appliances Industry Revenue (Million) Forecast, by Application 2019 & 2032
- Table 13: France Smart Kitchen Appliances Industry Revenue (Million) Forecast, by Application 2019 & 2032
- Table 14: Spain Smart Kitchen Appliances Industry Revenue (Million) Forecast, by Application 2019 & 2032
- Table 15: Italy Smart Kitchen Appliances Industry Revenue (Million) Forecast, by Application 2019 & 2032
- Table 16: Spain Smart Kitchen Appliances Industry Revenue (Million) Forecast, by Application 2019 & 2032
- Table 17: Belgium Smart Kitchen Appliances Industry Revenue (Million) Forecast, by Application 2019 & 2032
- Table 18: Netherland Smart Kitchen Appliances Industry Revenue (Million) Forecast, by Application 2019 & 2032
- Table 19: Nordics Smart Kitchen Appliances Industry Revenue (Million) Forecast, by Application 2019 & 2032
- Table 20: Rest of Europe Smart Kitchen Appliances Industry Revenue (Million) Forecast, by Application 2019 & 2032
- Table 21: Global Smart Kitchen Appliances Industry Revenue Million Forecast, by Country 2019 & 2032
- Table 22: China Smart Kitchen Appliances Industry Revenue (Million) Forecast, by Application 2019 & 2032
- Table 23: Japan Smart Kitchen Appliances Industry Revenue (Million) Forecast, by Application 2019 & 2032
- Table 24: India Smart Kitchen Appliances Industry Revenue (Million) Forecast, by Application 2019 & 2032
- Table 25: South Korea Smart Kitchen Appliances Industry Revenue (Million) Forecast, by Application 2019 & 2032
- Table 26: Southeast Asia Smart Kitchen Appliances Industry Revenue (Million) Forecast, by Application 2019 & 2032
- Table 27: Australia Smart Kitchen Appliances Industry Revenue (Million) Forecast, by Application 2019 & 2032
- Table 28: Indonesia Smart Kitchen Appliances Industry Revenue (Million) Forecast, by Application 2019 & 2032
- Table 29: Phillipes Smart Kitchen Appliances Industry Revenue (Million) Forecast, by Application 2019 & 2032
- Table 30: Singapore Smart Kitchen Appliances Industry Revenue (Million) Forecast, by Application 2019 & 2032
- Table 31: Thailandc Smart Kitchen Appliances Industry Revenue (Million) Forecast, by Application 2019 & 2032
- Table 32: Rest of Asia Pacific Smart Kitchen Appliances Industry Revenue (Million) Forecast, by Application 2019 & 2032
- Table 33: Global Smart Kitchen Appliances Industry Revenue Million Forecast, by Country 2019 & 2032
- Table 34: Brazil Smart Kitchen Appliances Industry Revenue (Million) Forecast, by Application 2019 & 2032
- Table 35: Argentina Smart Kitchen Appliances Industry Revenue (Million) Forecast, by Application 2019 & 2032
- Table 36: Peru Smart Kitchen Appliances Industry Revenue (Million) Forecast, by Application 2019 & 2032
- Table 37: Chile Smart Kitchen Appliances Industry Revenue (Million) Forecast, by Application 2019 & 2032
- Table 38: Colombia Smart Kitchen Appliances Industry Revenue (Million) Forecast, by Application 2019 & 2032
- Table 39: Ecuador Smart Kitchen Appliances Industry Revenue (Million) Forecast, by Application 2019 & 2032
- Table 40: Venezuela Smart Kitchen Appliances Industry Revenue (Million) Forecast, by Application 2019 & 2032
- Table 41: Rest of South America Smart Kitchen Appliances Industry Revenue (Million) Forecast, by Application 2019 & 2032
- Table 42: Global Smart Kitchen Appliances Industry Revenue Million Forecast, by Country 2019 & 2032
- Table 43: United Arab Emirates Smart Kitchen Appliances Industry Revenue (Million) Forecast, by Application 2019 & 2032
- Table 44: Saudi Arabia Smart Kitchen Appliances Industry Revenue (Million) Forecast, by Application 2019 & 2032
- Table 45: South Africa Smart Kitchen Appliances Industry Revenue (Million) Forecast, by Application 2019 & 2032
- Table 46: Rest of Middle East and Africa Smart Kitchen Appliances Industry Revenue (Million) Forecast, by Application 2019 & 2032
- Table 47: Global Smart Kitchen Appliances Industry Revenue Million Forecast, by Product Type 2019 & 2032
- Table 48: Global Smart Kitchen Appliances Industry Revenue Million Forecast, by Distribution Channel 2019 & 2032
- Table 49: Global Smart Kitchen Appliances Industry Revenue Million Forecast, by End User 2019 & 2032
- Table 50: Global Smart Kitchen Appliances Industry Revenue Million Forecast, by Country 2019 & 2032
- Table 51: Global Smart Kitchen Appliances Industry Revenue Million Forecast, by Product Type 2019 & 2032
- Table 52: Global Smart Kitchen Appliances Industry Revenue Million Forecast, by Distribution Channel 2019 & 2032
- Table 53: Global Smart Kitchen Appliances Industry Revenue Million Forecast, by End User 2019 & 2032
- Table 54: Global Smart Kitchen Appliances Industry Revenue Million Forecast, by Country 2019 & 2032
- Table 55: Global Smart Kitchen Appliances Industry Revenue Million Forecast, by Product Type 2019 & 2032
- Table 56: Global Smart Kitchen Appliances Industry Revenue Million Forecast, by Distribution Channel 2019 & 2032
- Table 57: Global Smart Kitchen Appliances Industry Revenue Million Forecast, by End User 2019 & 2032
- Table 58: Global Smart Kitchen Appliances Industry Revenue Million Forecast, by Country 2019 & 2032
- Table 59: Global Smart Kitchen Appliances Industry Revenue Million Forecast, by Product Type 2019 & 2032
- Table 60: Global Smart Kitchen Appliances Industry Revenue Million Forecast, by Distribution Channel 2019 & 2032
- Table 61: Global Smart Kitchen Appliances Industry Revenue Million Forecast, by End User 2019 & 2032
- Table 62: Global Smart Kitchen Appliances Industry Revenue Million Forecast, by Country 2019 & 2032
- Table 63: Global Smart Kitchen Appliances Industry Revenue Million Forecast, by Product Type 2019 & 2032
- Table 64: Global Smart Kitchen Appliances Industry Revenue Million Forecast, by Distribution Channel 2019 & 2032
- Table 65: Global Smart Kitchen Appliances Industry Revenue Million Forecast, by End User 2019 & 2032
- Table 66: Global Smart Kitchen Appliances Industry Revenue Million Forecast, by Country 2019 & 2032
Frequently Asked Questions
1. What is the projected Compound Annual Growth Rate (CAGR) of the Smart Kitchen Appliances Industry?
The projected CAGR is approximately 16.83%.
2. Which companies are prominent players in the Smart Kitchen Appliances Industry?
Key companies in the market include Whirlpool Corporation, AB Electrolux, BSH Home Appliances Corporation, LG Electronics Inc, Breville Group Limited, Miele, Samsung Electronics Co Ltd, Haier Group, Philips, Panasonic Corporation.
3. What are the main segments of the Smart Kitchen Appliances Industry?
The market segments include Product Type, Distribution Channel, End User.
4. Can you provide details about the market size?
The market size is estimated to be USD 20.44 Million as of 2022.
5. What are some drivers contributing to market growth?
The Growth in the Hospitality Sector is Shifting to Commercial Smart Kitchen Appliances; Surge in Urban Population and Rise in Expenditure on Home Renovations Driving Market Growth.
6. What are the notable trends driving market growth?
The Rising Adoption of Artificial Intelligence in Smart Kitchen Appliances.
7. Are there any restraints impacting market growth?
Concerns About Data Privacy Among End Users Can Impedes Market Growth; High Cost of Maintenance and Upkeep.
8. Can you provide examples of recent developments in the market?
May 2023: LG Electronics released the InstaView refrigerator featuring door panels that can change colors, offering enhanced customization. Users can alter the colors according to their mood, with the LED panels providing access to an impressive selection of up to 190,0001 color combinations.
9. What pricing options are available for accessing the report?
Pricing options include single-user, multi-user, and enterprise licenses priced at USD 4750, USD 5250, and USD 8750 respectively.
10. Is the market size provided in terms of value or volume?
The market size is provided in terms of value, measured in Million.
11. Are there any specific market keywords associated with the report?
Yes, the market keyword associated with the report is "Smart Kitchen Appliances Industry," which aids in identifying and referencing the specific market segment covered.
12. How do I determine which pricing option suits my needs best?
The pricing options vary based on user requirements and access needs. Individual users may opt for single-user licenses, while businesses requiring broader access may choose multi-user or enterprise licenses for cost-effective access to the report.
13. Are there any additional resources or data provided in the Smart Kitchen Appliances Industry report?
While the report offers comprehensive insights, it's advisable to review the specific contents or supplementary materials provided to ascertain if additional resources or data are available.
14. How can I stay updated on further developments or reports in the Smart Kitchen Appliances Industry?
To stay informed about further developments, trends, and reports in the Smart Kitchen Appliances Industry, consider subscribing to industry newsletters, following relevant companies and organizations, or regularly checking reputable industry news sources and publications.
Methodology
Step 1 - Identification of Relevant Samples Size from Population Database


Step 2 - Approaches for Defining Global Market Size (Value, Volume* & Price*)

Note*: In applicable scenarios
Step 3 - Data Sources
Primary Research
- Web Analytics
- Survey Reports
- Research Institute
- Latest Research Reports
- Opinion Leaders
Secondary Research
- Annual Reports
- White Paper
- Latest Press Release
- Industry Association
- Paid Database
- Investor Presentations

Step 4 - Data Triangulation
Involves using different sources of information in order to increase the validity of a study
These sources are likely to be stakeholders in a program - participants, other researchers, program staff, other community members, and so on.
Then we put all data in single framework & apply various statistical tools to find out the dynamic on the market.
During the analysis stage, feedback from the stakeholder groups would be compared to determine areas of agreement as well as areas of divergence


