Key Insights
The global soft tissue allografts market is poised for substantial growth, propelled by an aging demographic, the increasing incidence of chronic diseases requiring reconstructive surgeries, and advancements in allograft processing and preservation. The market is projected to expand at a Compound Annual Growth Rate (CAGR) of 7.9%. Key growth drivers include the rising demand for minimally invasive procedures, the favorable adoption of allografts as a safe and effective alternative to autografts, and the expanding applications across orthopedic, dental, and wound care specialties. The orthopedic segment leads, attributed to sports injuries and osteoarthritis, while dental applications are accelerating due to implant and reconstructive procedure demand. North America dominates, supported by robust healthcare infrastructure and R&D investment. However, regulatory hurdles and procedural costs present challenges. High market competition spurs innovation, strategic alliances, and geographic expansion, with ongoing consolidation anticipated.
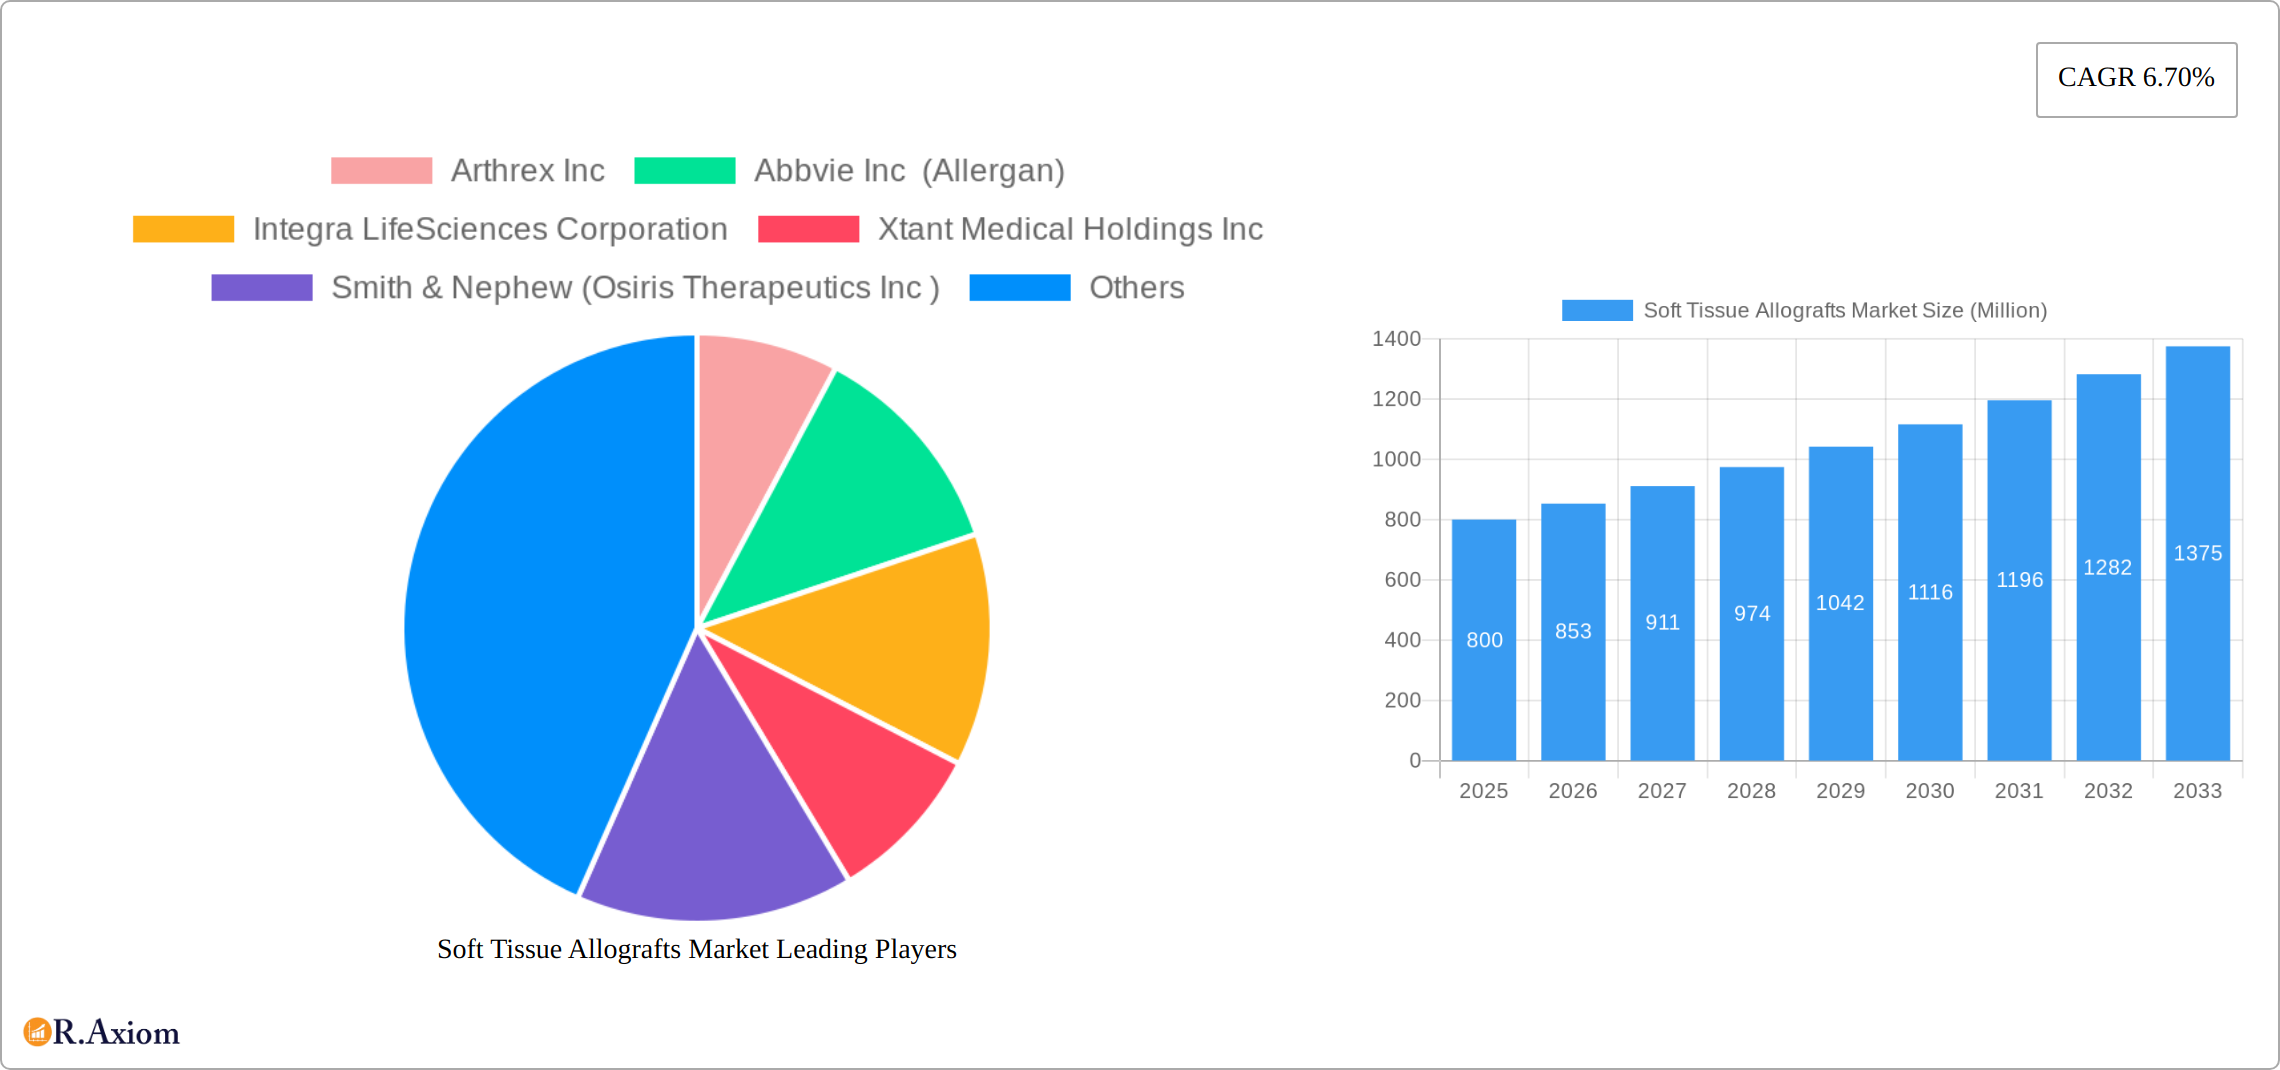
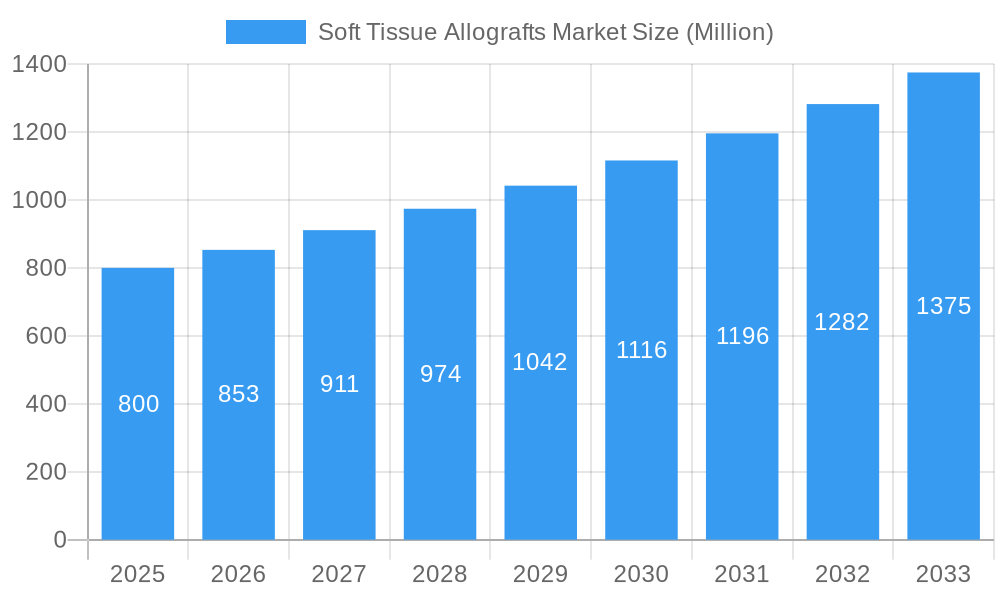
Soft Tissue Allografts Market Market Size (In Billion)
Segmentation within the soft tissue allografts market offers varied growth prospects. Cartilage, tendon, and meniscus allografts are pivotal in orthopedics. Dental allografts show strong growth, driven by periodontal disease prevalence and bone grafting demand. The wound care segment is a promising area for future expansion, addressing chronic wounds with advanced healing solutions. Continued research into novel processing techniques will enhance tissue compatibility and minimize rejection. Emerging markets, particularly in Asia-Pacific and Latin America, will significantly contribute to overall market expansion. The market size for 2025 is estimated at $14.71 billion.
Soft Tissue Allografts Market Company Market Share
Soft Tissue Allografts Market: A Comprehensive Report, 2019-2033
This comprehensive report provides an in-depth analysis of the Soft Tissue Allografts market, offering valuable insights for stakeholders across the industry. Covering the period from 2019 to 2033, with a base year of 2025 and a forecast period of 2025-2033, this report analyzes market dynamics, segmentation, key players, and future growth potential. The report projects a xx Million market value by 2033, showcasing significant growth opportunities.
Soft Tissue Allografts Market Concentration & Innovation
The Soft Tissue Allografts market exhibits a moderately concentrated landscape, with key players such as Arthrex Inc, Abbvie Inc (Allergan), Integra LifeSciences Corporation, Xtant Medical Holdings Inc, Smith & Nephew (Osiris Therapeutics Inc), Johnson & Johnson Inc, BD (Becton Dickinson and Company), Medtronic Plc, Conmed Corporation, Stryker Corporation, Zimmer Biomet, and Bone Bank Allografts holding significant market share. Precise market share data for each company is unavailable but it can be estimated with the use of available data to be in range of xx to xx% for each key player. Innovation is a significant driver, with companies investing heavily in research and development to improve product efficacy, safety, and ease of use.
Regulatory frameworks, particularly concerning tissue sourcing, processing, and safety, play a crucial role. The market faces competition from synthetic substitutes, yet the demand for allografts persists, driven by their biocompatibility and natural integration within the body. Mergers and acquisitions (M&A) activities are prevalent, with deal values varying considerably depending on the target company's size and portfolio. For example, a recent major acquisition in the market involved a xx Million deal, which strengthened the acquirer's product portfolio and market presence significantly.
- Key Market Concentration Metrics: Market share held by top 5 players: xx%; Average M&A deal value (2019-2024): xx Million.
- Innovation Drivers: Improved processing techniques, novel sterilization methods, advanced biomaterial integration.
- Regulatory Landscape: Stringent regulations on tissue sourcing, processing, and quality control.
- End-User Trends: Increasing demand for minimally invasive procedures and improved patient outcomes.
Soft Tissue Allografts Market Industry Trends & Insights
The Soft Tissue Allografts market is experiencing robust growth, driven by several factors. The rising prevalence of orthopedic injuries and the increasing demand for reconstructive surgeries are key market drivers. Technological advancements, particularly in tissue processing and preservation techniques, are enhancing the safety and efficacy of allografts, further fueling market expansion. Consumer preferences are shifting towards minimally invasive procedures and faster recovery times, resulting in increased adoption of allografts over traditional treatments. The market exhibits intense competitive dynamics, with companies continuously striving to improve their product offerings and expand their market share. This leads to continuous innovation and development of improved technologies. The market is projected to experience a Compound Annual Growth Rate (CAGR) of xx% during the forecast period (2025-2033). Market penetration remains significant, with allografts being a standard of care for several procedures.
Dominant Markets & Segments in Soft Tissue Allografts Market
The orthopedic application segment holds the largest market share, driven by the high incidence of sports injuries and age-related degenerative conditions. The United States currently dominates the global market, fueled by robust healthcare infrastructure and high per capita healthcare expenditure. Within types, tendon allografts represent a considerable segment, followed closely by cartilage and meniscus allografts.
- Leading Region: North America (particularly the United States)
- Key Drivers for US Dominance: Advanced healthcare infrastructure, high healthcare expenditure, technological advancements.
- Leading Application Segment: Orthopedics (due to high incidence of sports injuries and degenerative diseases)
- Leading Type Segment: Tendon allografts, due to the high volume of ligament reconstruction procedures.
- Dominant End-Users: Hospitals and orthopedic clinics because of high surgical volumes.
Soft Tissue Allografts Market Product Developments
The soft tissue allograft market is experiencing significant advancements, driven by a focus on improving graft viability, biomechanical properties, and integration with host tissue. Cryopreservation techniques are enhancing graft survival rates and minimizing rejection risks. Companies are investing heavily in research and development to create allografts with superior performance characteristics, leading to faster patient recovery times and improved clinical outcomes. This commitment to innovation is directly addressing the increasing demand for effective and reliable soft tissue replacement solutions.
Report Scope & Segmentation Analysis
This comprehensive report provides a detailed analysis of the Soft Tissue Allografts market, segmented by various key parameters to offer a granular understanding of market dynamics. The segmentation includes:
- Type: Cartilage Allograft, Tendon Allograft, Meniscus Allograft, Dental Allograft, and Other Types
- Application: Orthopedic, Dentistry, Wound Care, and Other Applications
- End-User: Hospitals, Aesthetic Centers, Orthopedic Clinics, Dental Clinics, and Other End Users
Key Drivers of Soft Tissue Allografts Market Growth
Several factors are propelling the growth of the soft tissue allografts market. The increasing incidence of sports injuries, age-related degenerative conditions (such as osteoarthritis and tendon tears), and a growing elderly population are key contributors. Furthermore, the rising adoption of minimally invasive surgical techniques, which often utilize allografts, and the demand for faster patient recovery times are significantly impacting market growth. Continuous technological advancements in tissue processing and preservation, resulting in improved graft viability and reduced rejection rates, are further stimulating market expansion. Supportive regulatory frameworks globally are also fostering the adoption and widespread use of allografts.
Challenges in the Soft Tissue Allografts Market Sector
The market faces challenges, including stringent regulatory requirements for tissue processing and sourcing, which can increase costs and complicate product launch. Supply chain constraints related to the availability of donor tissue can limit production capacity. Intense competition among existing players and the emergence of new technologies also pose a challenge to established companies. These factors can hinder market growth and affect profitability.
Emerging Opportunities in Soft Tissue Allografts Market
The soft tissue allograft market presents substantial emerging opportunities. The development of personalized medicine approaches, utilizing advanced technologies to create customized allografts tailored to individual patient needs, is a significant area of focus. Advances in tissue engineering and regenerative medicine hold immense promise for creating superior allografts with enhanced functionality. Expansion into emerging markets with developing healthcare infrastructure and increasing disposable incomes represents another lucrative opportunity. The integration of advanced imaging techniques and minimally invasive surgical procedures offers further potential for improved surgical precision and patient outcomes, driving market growth.
Leading Players in the Soft Tissue Allografts Market Market
- Arthrex Inc
- Abbvie Inc (Allergan)
- Integra LifeSciences Corporation
- Xtant Medical Holdings Inc
- Smith & Nephew (Osiris Therapeutics Inc)
- Johnson & Johnson Inc
- BD (Becton Dickinson and Company)
- Medtronic Plc
- Conmed Corporation
- Stryker Corporation
- Zimmer Biomet
- Bone Bank Allografts
Key Developments in Soft Tissue Allografts Market Industry
- August 2022: A groundbreaking first meniscal transplant using donor cartilage was performed in Scotland, showcasing the growing acceptance and application of allografts in complex orthopedic procedures.
- July 2022: AlloSource expanded its AlloConnex product line to include a quadricep tendon, demonstrating a strong commitment to innovation and product diversification to cater to a broader range of clinical needs.
- [Add other recent key developments here with dates and brief descriptions]
Strategic Outlook for Soft Tissue Allografts Market Market
The Soft Tissue Allografts market is poised for sustained growth driven by technological innovations, increasing awareness among healthcare professionals, and rising demand for minimally invasive surgical procedures. Expansion into emerging markets and the development of customized allografts present lucrative opportunities. Companies that strategically invest in research and development, strengthen their supply chains, and effectively navigate the regulatory landscape will be well-positioned to capitalize on this market's significant growth potential.
Soft Tissue Allografts Market Segmentation
-
1. Type
- 1.1. Cartilage Allograft
- 1.2. Tendon Allograft
- 1.3. Meniscus Allograft
- 1.4. Dental Allograft
- 1.5. Other Types
-
2. Application
- 2.1. Orthopedic
- 2.2. Dentistry
- 2.3. Wound Care
- 2.4. Other Applications
-
3. End User
- 3.1. Hospitals
- 3.2. Aesthetic Centres
- 3.3. Orthopedic Clinics
- 3.4. Dental Clinics
- 3.5. Other End Users
Soft Tissue Allografts Market Segmentation By Geography
-
1. North America
- 1.1. United States
- 1.2. Canada
- 1.3. Mexico
-
2. Europe
- 2.1. Germany
- 2.2. United Kingdom
- 2.3. France
- 2.4. Italy
- 2.5. Spain
- 2.6. Rest of Europe
-
3. Asia Pacific
- 3.1. China
- 3.2. Japan
- 3.3. India
- 3.4. Australia
- 3.5. South Korea
- 3.6. Rest of Asia Pacific
-
4. Middle East and Africa
- 4.1. GCC
- 4.2. South Africa
- 4.3. Rest of Middle East and Africa
-
5. South America
- 5.1. Brazil
- 5.2. Argentina
- 5.3. Rest of South America
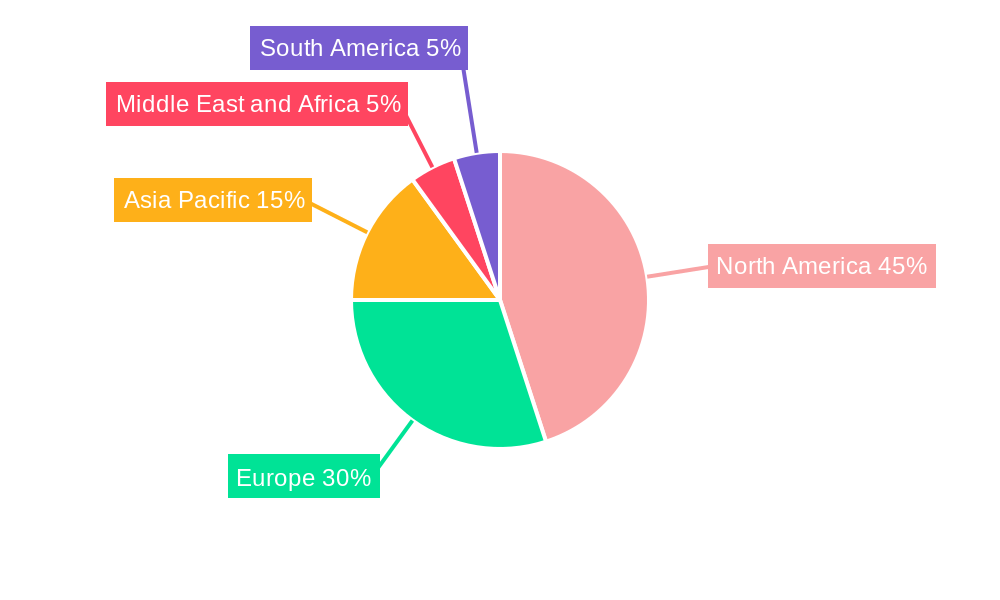
Soft Tissue Allografts Market Regional Market Share
Geographic Coverage of Soft Tissue Allografts Market
Soft Tissue Allografts Market REPORT HIGHLIGHTS
| Aspects | Details |
|---|---|
| Study Period | 2020-2034 |
| Base Year | 2025 |
| Estimated Year | 2026 |
| Forecast Period | 2026-2034 |
| Historical Period | 2020-2025 |
| Growth Rate | CAGR of 7.9% from 2020-2034 |
| Segmentation |
|
Table of Contents
- 1. Introduction
- 1.1. Research Scope
- 1.2. Market Segmentation
- 1.3. Research Methodology
- 1.4. Definitions and Assumptions
- 2. Executive Summary
- 2.1. Introduction
- 3. Market Dynamics
- 3.1. Introduction
- 3.2. Market Drivers
- 3.2.1. Growing Cases of Orthopedics and Dentistry Related with Aging; Increasing Demand for Soft Tissue Allografts in Athletics and Other Sports; Advancements in Soft Tissue Replacement
- 3.3. Market Restrains
- 3.3.1. High Cost of Treatment; Complicated Reimbursement and Regulatory Policies
- 3.4. Market Trends
- 3.4.1. Orthopedic Segment is Expected to Hold a Significant Market Share Over the Forecast Period
- 4. Market Factor Analysis
- 4.1. Porters Five Forces
- 4.2. Supply/Value Chain
- 4.3. PESTEL analysis
- 4.4. Market Entropy
- 4.5. Patent/Trademark Analysis
- 5. Global Soft Tissue Allografts Market Analysis, Insights and Forecast, 2020-2032
- 5.1. Market Analysis, Insights and Forecast - by Type
- 5.1.1. Cartilage Allograft
- 5.1.2. Tendon Allograft
- 5.1.3. Meniscus Allograft
- 5.1.4. Dental Allograft
- 5.1.5. Other Types
- 5.2. Market Analysis, Insights and Forecast - by Application
- 5.2.1. Orthopedic
- 5.2.2. Dentistry
- 5.2.3. Wound Care
- 5.2.4. Other Applications
- 5.3. Market Analysis, Insights and Forecast - by End User
- 5.3.1. Hospitals
- 5.3.2. Aesthetic Centres
- 5.3.3. Orthopedic Clinics
- 5.3.4. Dental Clinics
- 5.3.5. Other End Users
- 5.4. Market Analysis, Insights and Forecast - by Region
- 5.4.1. North America
- 5.4.2. Europe
- 5.4.3. Asia Pacific
- 5.4.4. Middle East and Africa
- 5.4.5. South America
- 5.1. Market Analysis, Insights and Forecast - by Type
- 6. North America Soft Tissue Allografts Market Analysis, Insights and Forecast, 2020-2032
- 6.1. Market Analysis, Insights and Forecast - by Type
- 6.1.1. Cartilage Allograft
- 6.1.2. Tendon Allograft
- 6.1.3. Meniscus Allograft
- 6.1.4. Dental Allograft
- 6.1.5. Other Types
- 6.2. Market Analysis, Insights and Forecast - by Application
- 6.2.1. Orthopedic
- 6.2.2. Dentistry
- 6.2.3. Wound Care
- 6.2.4. Other Applications
- 6.3. Market Analysis, Insights and Forecast - by End User
- 6.3.1. Hospitals
- 6.3.2. Aesthetic Centres
- 6.3.3. Orthopedic Clinics
- 6.3.4. Dental Clinics
- 6.3.5. Other End Users
- 6.1. Market Analysis, Insights and Forecast - by Type
- 7. Europe Soft Tissue Allografts Market Analysis, Insights and Forecast, 2020-2032
- 7.1. Market Analysis, Insights and Forecast - by Type
- 7.1.1. Cartilage Allograft
- 7.1.2. Tendon Allograft
- 7.1.3. Meniscus Allograft
- 7.1.4. Dental Allograft
- 7.1.5. Other Types
- 7.2. Market Analysis, Insights and Forecast - by Application
- 7.2.1. Orthopedic
- 7.2.2. Dentistry
- 7.2.3. Wound Care
- 7.2.4. Other Applications
- 7.3. Market Analysis, Insights and Forecast - by End User
- 7.3.1. Hospitals
- 7.3.2. Aesthetic Centres
- 7.3.3. Orthopedic Clinics
- 7.3.4. Dental Clinics
- 7.3.5. Other End Users
- 7.1. Market Analysis, Insights and Forecast - by Type
- 8. Asia Pacific Soft Tissue Allografts Market Analysis, Insights and Forecast, 2020-2032
- 8.1. Market Analysis, Insights and Forecast - by Type
- 8.1.1. Cartilage Allograft
- 8.1.2. Tendon Allograft
- 8.1.3. Meniscus Allograft
- 8.1.4. Dental Allograft
- 8.1.5. Other Types
- 8.2. Market Analysis, Insights and Forecast - by Application
- 8.2.1. Orthopedic
- 8.2.2. Dentistry
- 8.2.3. Wound Care
- 8.2.4. Other Applications
- 8.3. Market Analysis, Insights and Forecast - by End User
- 8.3.1. Hospitals
- 8.3.2. Aesthetic Centres
- 8.3.3. Orthopedic Clinics
- 8.3.4. Dental Clinics
- 8.3.5. Other End Users
- 8.1. Market Analysis, Insights and Forecast - by Type
- 9. Middle East and Africa Soft Tissue Allografts Market Analysis, Insights and Forecast, 2020-2032
- 9.1. Market Analysis, Insights and Forecast - by Type
- 9.1.1. Cartilage Allograft
- 9.1.2. Tendon Allograft
- 9.1.3. Meniscus Allograft
- 9.1.4. Dental Allograft
- 9.1.5. Other Types
- 9.2. Market Analysis, Insights and Forecast - by Application
- 9.2.1. Orthopedic
- 9.2.2. Dentistry
- 9.2.3. Wound Care
- 9.2.4. Other Applications
- 9.3. Market Analysis, Insights and Forecast - by End User
- 9.3.1. Hospitals
- 9.3.2. Aesthetic Centres
- 9.3.3. Orthopedic Clinics
- 9.3.4. Dental Clinics
- 9.3.5. Other End Users
- 9.1. Market Analysis, Insights and Forecast - by Type
- 10. South America Soft Tissue Allografts Market Analysis, Insights and Forecast, 2020-2032
- 10.1. Market Analysis, Insights and Forecast - by Type
- 10.1.1. Cartilage Allograft
- 10.1.2. Tendon Allograft
- 10.1.3. Meniscus Allograft
- 10.1.4. Dental Allograft
- 10.1.5. Other Types
- 10.2. Market Analysis, Insights and Forecast - by Application
- 10.2.1. Orthopedic
- 10.2.2. Dentistry
- 10.2.3. Wound Care
- 10.2.4. Other Applications
- 10.3. Market Analysis, Insights and Forecast - by End User
- 10.3.1. Hospitals
- 10.3.2. Aesthetic Centres
- 10.3.3. Orthopedic Clinics
- 10.3.4. Dental Clinics
- 10.3.5. Other End Users
- 10.1. Market Analysis, Insights and Forecast - by Type
- 11. Competitive Analysis
- 11.1. Global Market Share Analysis 2025
- 11.2. Company Profiles
- 11.2.1 Arthrex Inc
- 11.2.1.1. Overview
- 11.2.1.2. Products
- 11.2.1.3. SWOT Analysis
- 11.2.1.4. Recent Developments
- 11.2.1.5. Financials (Based on Availability)
- 11.2.2 Abbvie Inc (Allergan)
- 11.2.2.1. Overview
- 11.2.2.2. Products
- 11.2.2.3. SWOT Analysis
- 11.2.2.4. Recent Developments
- 11.2.2.5. Financials (Based on Availability)
- 11.2.3 Integra LifeSciences Corporation
- 11.2.3.1. Overview
- 11.2.3.2. Products
- 11.2.3.3. SWOT Analysis
- 11.2.3.4. Recent Developments
- 11.2.3.5. Financials (Based on Availability)
- 11.2.4 Xtant Medical Holdings Inc
- 11.2.4.1. Overview
- 11.2.4.2. Products
- 11.2.4.3. SWOT Analysis
- 11.2.4.4. Recent Developments
- 11.2.4.5. Financials (Based on Availability)
- 11.2.5 Smith & Nephew (Osiris Therapeutics Inc )
- 11.2.5.1. Overview
- 11.2.5.2. Products
- 11.2.5.3. SWOT Analysis
- 11.2.5.4. Recent Developments
- 11.2.5.5. Financials (Based on Availability)
- 11.2.6 Johnson & Johnson Inc
- 11.2.6.1. Overview
- 11.2.6.2. Products
- 11.2.6.3. SWOT Analysis
- 11.2.6.4. Recent Developments
- 11.2.6.5. Financials (Based on Availability)
- 11.2.7 BD (Becton Dickinson and Company)
- 11.2.7.1. Overview
- 11.2.7.2. Products
- 11.2.7.3. SWOT Analysis
- 11.2.7.4. Recent Developments
- 11.2.7.5. Financials (Based on Availability)
- 11.2.8 Medtronic Plc
- 11.2.8.1. Overview
- 11.2.8.2. Products
- 11.2.8.3. SWOT Analysis
- 11.2.8.4. Recent Developments
- 11.2.8.5. Financials (Based on Availability)
- 11.2.9 Conmed Corporation
- 11.2.9.1. Overview
- 11.2.9.2. Products
- 11.2.9.3. SWOT Analysis
- 11.2.9.4. Recent Developments
- 11.2.9.5. Financials (Based on Availability)
- 11.2.10 Stryker Corporation
- 11.2.10.1. Overview
- 11.2.10.2. Products
- 11.2.10.3. SWOT Analysis
- 11.2.10.4. Recent Developments
- 11.2.10.5. Financials (Based on Availability)
- 11.2.11 Zimmer Biomet
- 11.2.11.1. Overview
- 11.2.11.2. Products
- 11.2.11.3. SWOT Analysis
- 11.2.11.4. Recent Developments
- 11.2.11.5. Financials (Based on Availability)
- 11.2.12 Bone Bank Allografts
- 11.2.12.1. Overview
- 11.2.12.2. Products
- 11.2.12.3. SWOT Analysis
- 11.2.12.4. Recent Developments
- 11.2.12.5. Financials (Based on Availability)
- 11.2.1 Arthrex Inc
List of Figures
- Figure 1: Global Soft Tissue Allografts Market Revenue Breakdown (billion, %) by Region 2025 & 2033
- Figure 2: Global Soft Tissue Allografts Market Volume Breakdown (K Unit, %) by Region 2025 & 2033
- Figure 3: North America Soft Tissue Allografts Market Revenue (billion), by Type 2025 & 2033
- Figure 4: North America Soft Tissue Allografts Market Volume (K Unit), by Type 2025 & 2033
- Figure 5: North America Soft Tissue Allografts Market Revenue Share (%), by Type 2025 & 2033
- Figure 6: North America Soft Tissue Allografts Market Volume Share (%), by Type 2025 & 2033
- Figure 7: North America Soft Tissue Allografts Market Revenue (billion), by Application 2025 & 2033
- Figure 8: North America Soft Tissue Allografts Market Volume (K Unit), by Application 2025 & 2033
- Figure 9: North America Soft Tissue Allografts Market Revenue Share (%), by Application 2025 & 2033
- Figure 10: North America Soft Tissue Allografts Market Volume Share (%), by Application 2025 & 2033
- Figure 11: North America Soft Tissue Allografts Market Revenue (billion), by End User 2025 & 2033
- Figure 12: North America Soft Tissue Allografts Market Volume (K Unit), by End User 2025 & 2033
- Figure 13: North America Soft Tissue Allografts Market Revenue Share (%), by End User 2025 & 2033
- Figure 14: North America Soft Tissue Allografts Market Volume Share (%), by End User 2025 & 2033
- Figure 15: North America Soft Tissue Allografts Market Revenue (billion), by Country 2025 & 2033
- Figure 16: North America Soft Tissue Allografts Market Volume (K Unit), by Country 2025 & 2033
- Figure 17: North America Soft Tissue Allografts Market Revenue Share (%), by Country 2025 & 2033
- Figure 18: North America Soft Tissue Allografts Market Volume Share (%), by Country 2025 & 2033
- Figure 19: Europe Soft Tissue Allografts Market Revenue (billion), by Type 2025 & 2033
- Figure 20: Europe Soft Tissue Allografts Market Volume (K Unit), by Type 2025 & 2033
- Figure 21: Europe Soft Tissue Allografts Market Revenue Share (%), by Type 2025 & 2033
- Figure 22: Europe Soft Tissue Allografts Market Volume Share (%), by Type 2025 & 2033
- Figure 23: Europe Soft Tissue Allografts Market Revenue (billion), by Application 2025 & 2033
- Figure 24: Europe Soft Tissue Allografts Market Volume (K Unit), by Application 2025 & 2033
- Figure 25: Europe Soft Tissue Allografts Market Revenue Share (%), by Application 2025 & 2033
- Figure 26: Europe Soft Tissue Allografts Market Volume Share (%), by Application 2025 & 2033
- Figure 27: Europe Soft Tissue Allografts Market Revenue (billion), by End User 2025 & 2033
- Figure 28: Europe Soft Tissue Allografts Market Volume (K Unit), by End User 2025 & 2033
- Figure 29: Europe Soft Tissue Allografts Market Revenue Share (%), by End User 2025 & 2033
- Figure 30: Europe Soft Tissue Allografts Market Volume Share (%), by End User 2025 & 2033
- Figure 31: Europe Soft Tissue Allografts Market Revenue (billion), by Country 2025 & 2033
- Figure 32: Europe Soft Tissue Allografts Market Volume (K Unit), by Country 2025 & 2033
- Figure 33: Europe Soft Tissue Allografts Market Revenue Share (%), by Country 2025 & 2033
- Figure 34: Europe Soft Tissue Allografts Market Volume Share (%), by Country 2025 & 2033
- Figure 35: Asia Pacific Soft Tissue Allografts Market Revenue (billion), by Type 2025 & 2033
- Figure 36: Asia Pacific Soft Tissue Allografts Market Volume (K Unit), by Type 2025 & 2033
- Figure 37: Asia Pacific Soft Tissue Allografts Market Revenue Share (%), by Type 2025 & 2033
- Figure 38: Asia Pacific Soft Tissue Allografts Market Volume Share (%), by Type 2025 & 2033
- Figure 39: Asia Pacific Soft Tissue Allografts Market Revenue (billion), by Application 2025 & 2033
- Figure 40: Asia Pacific Soft Tissue Allografts Market Volume (K Unit), by Application 2025 & 2033
- Figure 41: Asia Pacific Soft Tissue Allografts Market Revenue Share (%), by Application 2025 & 2033
- Figure 42: Asia Pacific Soft Tissue Allografts Market Volume Share (%), by Application 2025 & 2033
- Figure 43: Asia Pacific Soft Tissue Allografts Market Revenue (billion), by End User 2025 & 2033
- Figure 44: Asia Pacific Soft Tissue Allografts Market Volume (K Unit), by End User 2025 & 2033
- Figure 45: Asia Pacific Soft Tissue Allografts Market Revenue Share (%), by End User 2025 & 2033
- Figure 46: Asia Pacific Soft Tissue Allografts Market Volume Share (%), by End User 2025 & 2033
- Figure 47: Asia Pacific Soft Tissue Allografts Market Revenue (billion), by Country 2025 & 2033
- Figure 48: Asia Pacific Soft Tissue Allografts Market Volume (K Unit), by Country 2025 & 2033
- Figure 49: Asia Pacific Soft Tissue Allografts Market Revenue Share (%), by Country 2025 & 2033
- Figure 50: Asia Pacific Soft Tissue Allografts Market Volume Share (%), by Country 2025 & 2033
- Figure 51: Middle East and Africa Soft Tissue Allografts Market Revenue (billion), by Type 2025 & 2033
- Figure 52: Middle East and Africa Soft Tissue Allografts Market Volume (K Unit), by Type 2025 & 2033
- Figure 53: Middle East and Africa Soft Tissue Allografts Market Revenue Share (%), by Type 2025 & 2033
- Figure 54: Middle East and Africa Soft Tissue Allografts Market Volume Share (%), by Type 2025 & 2033
- Figure 55: Middle East and Africa Soft Tissue Allografts Market Revenue (billion), by Application 2025 & 2033
- Figure 56: Middle East and Africa Soft Tissue Allografts Market Volume (K Unit), by Application 2025 & 2033
- Figure 57: Middle East and Africa Soft Tissue Allografts Market Revenue Share (%), by Application 2025 & 2033
- Figure 58: Middle East and Africa Soft Tissue Allografts Market Volume Share (%), by Application 2025 & 2033
- Figure 59: Middle East and Africa Soft Tissue Allografts Market Revenue (billion), by End User 2025 & 2033
- Figure 60: Middle East and Africa Soft Tissue Allografts Market Volume (K Unit), by End User 2025 & 2033
- Figure 61: Middle East and Africa Soft Tissue Allografts Market Revenue Share (%), by End User 2025 & 2033
- Figure 62: Middle East and Africa Soft Tissue Allografts Market Volume Share (%), by End User 2025 & 2033
- Figure 63: Middle East and Africa Soft Tissue Allografts Market Revenue (billion), by Country 2025 & 2033
- Figure 64: Middle East and Africa Soft Tissue Allografts Market Volume (K Unit), by Country 2025 & 2033
- Figure 65: Middle East and Africa Soft Tissue Allografts Market Revenue Share (%), by Country 2025 & 2033
- Figure 66: Middle East and Africa Soft Tissue Allografts Market Volume Share (%), by Country 2025 & 2033
- Figure 67: South America Soft Tissue Allografts Market Revenue (billion), by Type 2025 & 2033
- Figure 68: South America Soft Tissue Allografts Market Volume (K Unit), by Type 2025 & 2033
- Figure 69: South America Soft Tissue Allografts Market Revenue Share (%), by Type 2025 & 2033
- Figure 70: South America Soft Tissue Allografts Market Volume Share (%), by Type 2025 & 2033
- Figure 71: South America Soft Tissue Allografts Market Revenue (billion), by Application 2025 & 2033
- Figure 72: South America Soft Tissue Allografts Market Volume (K Unit), by Application 2025 & 2033
- Figure 73: South America Soft Tissue Allografts Market Revenue Share (%), by Application 2025 & 2033
- Figure 74: South America Soft Tissue Allografts Market Volume Share (%), by Application 2025 & 2033
- Figure 75: South America Soft Tissue Allografts Market Revenue (billion), by End User 2025 & 2033
- Figure 76: South America Soft Tissue Allografts Market Volume (K Unit), by End User 2025 & 2033
- Figure 77: South America Soft Tissue Allografts Market Revenue Share (%), by End User 2025 & 2033
- Figure 78: South America Soft Tissue Allografts Market Volume Share (%), by End User 2025 & 2033
- Figure 79: South America Soft Tissue Allografts Market Revenue (billion), by Country 2025 & 2033
- Figure 80: South America Soft Tissue Allografts Market Volume (K Unit), by Country 2025 & 2033
- Figure 81: South America Soft Tissue Allografts Market Revenue Share (%), by Country 2025 & 2033
- Figure 82: South America Soft Tissue Allografts Market Volume Share (%), by Country 2025 & 2033
List of Tables
- Table 1: Global Soft Tissue Allografts Market Revenue billion Forecast, by Type 2020 & 2033
- Table 2: Global Soft Tissue Allografts Market Volume K Unit Forecast, by Type 2020 & 2033
- Table 3: Global Soft Tissue Allografts Market Revenue billion Forecast, by Application 2020 & 2033
- Table 4: Global Soft Tissue Allografts Market Volume K Unit Forecast, by Application 2020 & 2033
- Table 5: Global Soft Tissue Allografts Market Revenue billion Forecast, by End User 2020 & 2033
- Table 6: Global Soft Tissue Allografts Market Volume K Unit Forecast, by End User 2020 & 2033
- Table 7: Global Soft Tissue Allografts Market Revenue billion Forecast, by Region 2020 & 2033
- Table 8: Global Soft Tissue Allografts Market Volume K Unit Forecast, by Region 2020 & 2033
- Table 9: Global Soft Tissue Allografts Market Revenue billion Forecast, by Type 2020 & 2033
- Table 10: Global Soft Tissue Allografts Market Volume K Unit Forecast, by Type 2020 & 2033
- Table 11: Global Soft Tissue Allografts Market Revenue billion Forecast, by Application 2020 & 2033
- Table 12: Global Soft Tissue Allografts Market Volume K Unit Forecast, by Application 2020 & 2033
- Table 13: Global Soft Tissue Allografts Market Revenue billion Forecast, by End User 2020 & 2033
- Table 14: Global Soft Tissue Allografts Market Volume K Unit Forecast, by End User 2020 & 2033
- Table 15: Global Soft Tissue Allografts Market Revenue billion Forecast, by Country 2020 & 2033
- Table 16: Global Soft Tissue Allografts Market Volume K Unit Forecast, by Country 2020 & 2033
- Table 17: United States Soft Tissue Allografts Market Revenue (billion) Forecast, by Application 2020 & 2033
- Table 18: United States Soft Tissue Allografts Market Volume (K Unit) Forecast, by Application 2020 & 2033
- Table 19: Canada Soft Tissue Allografts Market Revenue (billion) Forecast, by Application 2020 & 2033
- Table 20: Canada Soft Tissue Allografts Market Volume (K Unit) Forecast, by Application 2020 & 2033
- Table 21: Mexico Soft Tissue Allografts Market Revenue (billion) Forecast, by Application 2020 & 2033
- Table 22: Mexico Soft Tissue Allografts Market Volume (K Unit) Forecast, by Application 2020 & 2033
- Table 23: Global Soft Tissue Allografts Market Revenue billion Forecast, by Type 2020 & 2033
- Table 24: Global Soft Tissue Allografts Market Volume K Unit Forecast, by Type 2020 & 2033
- Table 25: Global Soft Tissue Allografts Market Revenue billion Forecast, by Application 2020 & 2033
- Table 26: Global Soft Tissue Allografts Market Volume K Unit Forecast, by Application 2020 & 2033
- Table 27: Global Soft Tissue Allografts Market Revenue billion Forecast, by End User 2020 & 2033
- Table 28: Global Soft Tissue Allografts Market Volume K Unit Forecast, by End User 2020 & 2033
- Table 29: Global Soft Tissue Allografts Market Revenue billion Forecast, by Country 2020 & 2033
- Table 30: Global Soft Tissue Allografts Market Volume K Unit Forecast, by Country 2020 & 2033
- Table 31: Germany Soft Tissue Allografts Market Revenue (billion) Forecast, by Application 2020 & 2033
- Table 32: Germany Soft Tissue Allografts Market Volume (K Unit) Forecast, by Application 2020 & 2033
- Table 33: United Kingdom Soft Tissue Allografts Market Revenue (billion) Forecast, by Application 2020 & 2033
- Table 34: United Kingdom Soft Tissue Allografts Market Volume (K Unit) Forecast, by Application 2020 & 2033
- Table 35: France Soft Tissue Allografts Market Revenue (billion) Forecast, by Application 2020 & 2033
- Table 36: France Soft Tissue Allografts Market Volume (K Unit) Forecast, by Application 2020 & 2033
- Table 37: Italy Soft Tissue Allografts Market Revenue (billion) Forecast, by Application 2020 & 2033
- Table 38: Italy Soft Tissue Allografts Market Volume (K Unit) Forecast, by Application 2020 & 2033
- Table 39: Spain Soft Tissue Allografts Market Revenue (billion) Forecast, by Application 2020 & 2033
- Table 40: Spain Soft Tissue Allografts Market Volume (K Unit) Forecast, by Application 2020 & 2033
- Table 41: Rest of Europe Soft Tissue Allografts Market Revenue (billion) Forecast, by Application 2020 & 2033
- Table 42: Rest of Europe Soft Tissue Allografts Market Volume (K Unit) Forecast, by Application 2020 & 2033
- Table 43: Global Soft Tissue Allografts Market Revenue billion Forecast, by Type 2020 & 2033
- Table 44: Global Soft Tissue Allografts Market Volume K Unit Forecast, by Type 2020 & 2033
- Table 45: Global Soft Tissue Allografts Market Revenue billion Forecast, by Application 2020 & 2033
- Table 46: Global Soft Tissue Allografts Market Volume K Unit Forecast, by Application 2020 & 2033
- Table 47: Global Soft Tissue Allografts Market Revenue billion Forecast, by End User 2020 & 2033
- Table 48: Global Soft Tissue Allografts Market Volume K Unit Forecast, by End User 2020 & 2033
- Table 49: Global Soft Tissue Allografts Market Revenue billion Forecast, by Country 2020 & 2033
- Table 50: Global Soft Tissue Allografts Market Volume K Unit Forecast, by Country 2020 & 2033
- Table 51: China Soft Tissue Allografts Market Revenue (billion) Forecast, by Application 2020 & 2033
- Table 52: China Soft Tissue Allografts Market Volume (K Unit) Forecast, by Application 2020 & 2033
- Table 53: Japan Soft Tissue Allografts Market Revenue (billion) Forecast, by Application 2020 & 2033
- Table 54: Japan Soft Tissue Allografts Market Volume (K Unit) Forecast, by Application 2020 & 2033
- Table 55: India Soft Tissue Allografts Market Revenue (billion) Forecast, by Application 2020 & 2033
- Table 56: India Soft Tissue Allografts Market Volume (K Unit) Forecast, by Application 2020 & 2033
- Table 57: Australia Soft Tissue Allografts Market Revenue (billion) Forecast, by Application 2020 & 2033
- Table 58: Australia Soft Tissue Allografts Market Volume (K Unit) Forecast, by Application 2020 & 2033
- Table 59: South Korea Soft Tissue Allografts Market Revenue (billion) Forecast, by Application 2020 & 2033
- Table 60: South Korea Soft Tissue Allografts Market Volume (K Unit) Forecast, by Application 2020 & 2033
- Table 61: Rest of Asia Pacific Soft Tissue Allografts Market Revenue (billion) Forecast, by Application 2020 & 2033
- Table 62: Rest of Asia Pacific Soft Tissue Allografts Market Volume (K Unit) Forecast, by Application 2020 & 2033
- Table 63: Global Soft Tissue Allografts Market Revenue billion Forecast, by Type 2020 & 2033
- Table 64: Global Soft Tissue Allografts Market Volume K Unit Forecast, by Type 2020 & 2033
- Table 65: Global Soft Tissue Allografts Market Revenue billion Forecast, by Application 2020 & 2033
- Table 66: Global Soft Tissue Allografts Market Volume K Unit Forecast, by Application 2020 & 2033
- Table 67: Global Soft Tissue Allografts Market Revenue billion Forecast, by End User 2020 & 2033
- Table 68: Global Soft Tissue Allografts Market Volume K Unit Forecast, by End User 2020 & 2033
- Table 69: Global Soft Tissue Allografts Market Revenue billion Forecast, by Country 2020 & 2033
- Table 70: Global Soft Tissue Allografts Market Volume K Unit Forecast, by Country 2020 & 2033
- Table 71: GCC Soft Tissue Allografts Market Revenue (billion) Forecast, by Application 2020 & 2033
- Table 72: GCC Soft Tissue Allografts Market Volume (K Unit) Forecast, by Application 2020 & 2033
- Table 73: South Africa Soft Tissue Allografts Market Revenue (billion) Forecast, by Application 2020 & 2033
- Table 74: South Africa Soft Tissue Allografts Market Volume (K Unit) Forecast, by Application 2020 & 2033
- Table 75: Rest of Middle East and Africa Soft Tissue Allografts Market Revenue (billion) Forecast, by Application 2020 & 2033
- Table 76: Rest of Middle East and Africa Soft Tissue Allografts Market Volume (K Unit) Forecast, by Application 2020 & 2033
- Table 77: Global Soft Tissue Allografts Market Revenue billion Forecast, by Type 2020 & 2033
- Table 78: Global Soft Tissue Allografts Market Volume K Unit Forecast, by Type 2020 & 2033
- Table 79: Global Soft Tissue Allografts Market Revenue billion Forecast, by Application 2020 & 2033
- Table 80: Global Soft Tissue Allografts Market Volume K Unit Forecast, by Application 2020 & 2033
- Table 81: Global Soft Tissue Allografts Market Revenue billion Forecast, by End User 2020 & 2033
- Table 82: Global Soft Tissue Allografts Market Volume K Unit Forecast, by End User 2020 & 2033
- Table 83: Global Soft Tissue Allografts Market Revenue billion Forecast, by Country 2020 & 2033
- Table 84: Global Soft Tissue Allografts Market Volume K Unit Forecast, by Country 2020 & 2033
- Table 85: Brazil Soft Tissue Allografts Market Revenue (billion) Forecast, by Application 2020 & 2033
- Table 86: Brazil Soft Tissue Allografts Market Volume (K Unit) Forecast, by Application 2020 & 2033
- Table 87: Argentina Soft Tissue Allografts Market Revenue (billion) Forecast, by Application 2020 & 2033
- Table 88: Argentina Soft Tissue Allografts Market Volume (K Unit) Forecast, by Application 2020 & 2033
- Table 89: Rest of South America Soft Tissue Allografts Market Revenue (billion) Forecast, by Application 2020 & 2033
- Table 90: Rest of South America Soft Tissue Allografts Market Volume (K Unit) Forecast, by Application 2020 & 2033
Frequently Asked Questions
1. What is the projected Compound Annual Growth Rate (CAGR) of the Soft Tissue Allografts Market?
The projected CAGR is approximately 7.9%.
2. Which companies are prominent players in the Soft Tissue Allografts Market?
Key companies in the market include Arthrex Inc, Abbvie Inc (Allergan), Integra LifeSciences Corporation, Xtant Medical Holdings Inc, Smith & Nephew (Osiris Therapeutics Inc ), Johnson & Johnson Inc , BD (Becton Dickinson and Company), Medtronic Plc, Conmed Corporation, Stryker Corporation, Zimmer Biomet, Bone Bank Allografts.
3. What are the main segments of the Soft Tissue Allografts Market?
The market segments include Type, Application, End User.
4. Can you provide details about the market size?
The market size is estimated to be USD 14.71 billion as of 2022.
5. What are some drivers contributing to market growth?
Growing Cases of Orthopedics and Dentistry Related with Aging; Increasing Demand for Soft Tissue Allografts in Athletics and Other Sports; Advancements in Soft Tissue Replacement.
6. What are the notable trends driving market growth?
Orthopedic Segment is Expected to Hold a Significant Market Share Over the Forecast Period.
7. Are there any restraints impacting market growth?
High Cost of Treatment; Complicated Reimbursement and Regulatory Policies.
8. Can you provide examples of recent developments in the market?
In August 2022, orthopedic surgeons at University National Hospital performed the first meniscal transplant and implanted donor cartilage into the patient's knee in Scotland.
9. What pricing options are available for accessing the report?
Pricing options include single-user, multi-user, and enterprise licenses priced at USD 4750, USD 5250, and USD 8750 respectively.
10. Is the market size provided in terms of value or volume?
The market size is provided in terms of value, measured in billion and volume, measured in K Unit.
11. Are there any specific market keywords associated with the report?
Yes, the market keyword associated with the report is "Soft Tissue Allografts Market," which aids in identifying and referencing the specific market segment covered.
12. How do I determine which pricing option suits my needs best?
The pricing options vary based on user requirements and access needs. Individual users may opt for single-user licenses, while businesses requiring broader access may choose multi-user or enterprise licenses for cost-effective access to the report.
13. Are there any additional resources or data provided in the Soft Tissue Allografts Market report?
While the report offers comprehensive insights, it's advisable to review the specific contents or supplementary materials provided to ascertain if additional resources or data are available.
14. How can I stay updated on further developments or reports in the Soft Tissue Allografts Market?
To stay informed about further developments, trends, and reports in the Soft Tissue Allografts Market, consider subscribing to industry newsletters, following relevant companies and organizations, or regularly checking reputable industry news sources and publications.
Methodology
Step 1 - Identification of Relevant Samples Size from Population Database


Step 2 - Approaches for Defining Global Market Size (Value, Volume* & Price*)

Note*: In applicable scenarios
Step 3 - Data Sources
Primary Research
- Web Analytics
- Survey Reports
- Research Institute
- Latest Research Reports
- Opinion Leaders
Secondary Research
- Annual Reports
- White Paper
- Latest Press Release
- Industry Association
- Paid Database
- Investor Presentations

Step 4 - Data Triangulation
Involves using different sources of information in order to increase the validity of a study
These sources are likely to be stakeholders in a program - participants, other researchers, program staff, other community members, and so on.
Then we put all data in single framework & apply various statistical tools to find out the dynamic on the market.
During the analysis stage, feedback from the stakeholder groups would be compared to determine areas of agreement as well as areas of divergence

