

Key Insights
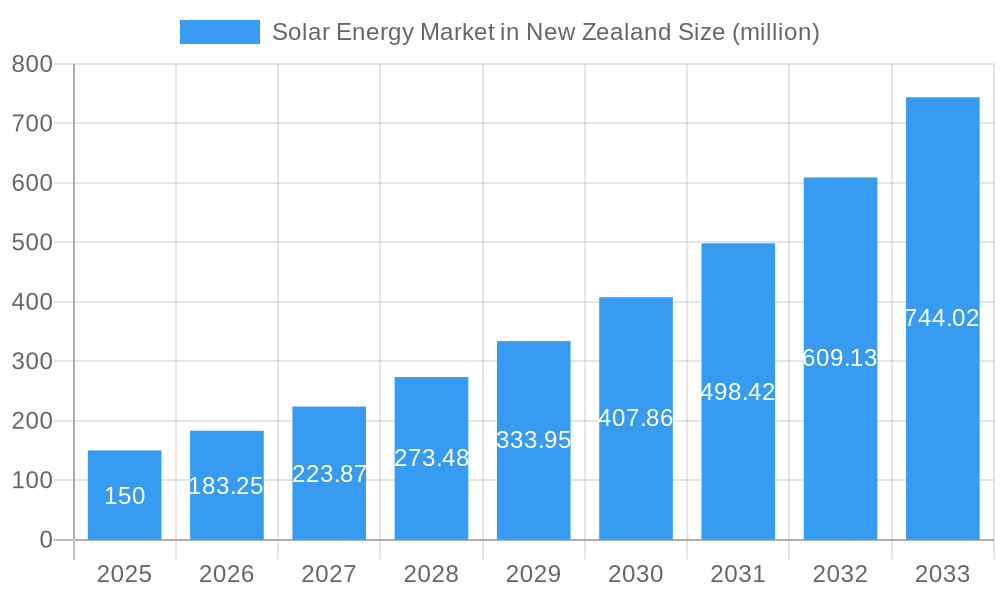
The New Zealand Solar Energy Market is poised for significant expansion, projected to reach an estimated USD 150 million in 2025, with an impressive compound annual growth rate (CAGR) of 20.28% anticipated between 2025 and 2033. This robust growth is fueled by a confluence of supportive government policies, increasing consumer and industrial demand for sustainable energy solutions, and a discernible shift towards renewable energy sources to combat climate change. The market's momentum is further bolstered by declining solar technology costs, making solar installations increasingly accessible and cost-effective for a broader range of end-users. Key drivers include substantial investments in utility-scale solar farms, coupled with a surge in residential and commercial rooftop solar installations driven by rising electricity prices and environmental consciousness. Emerging trends such as advanced battery storage integration, smart grid technologies, and innovative financing models are also contributing to the market's dynamism, enhancing the reliability and overall value proposition of solar power in New Zealand.
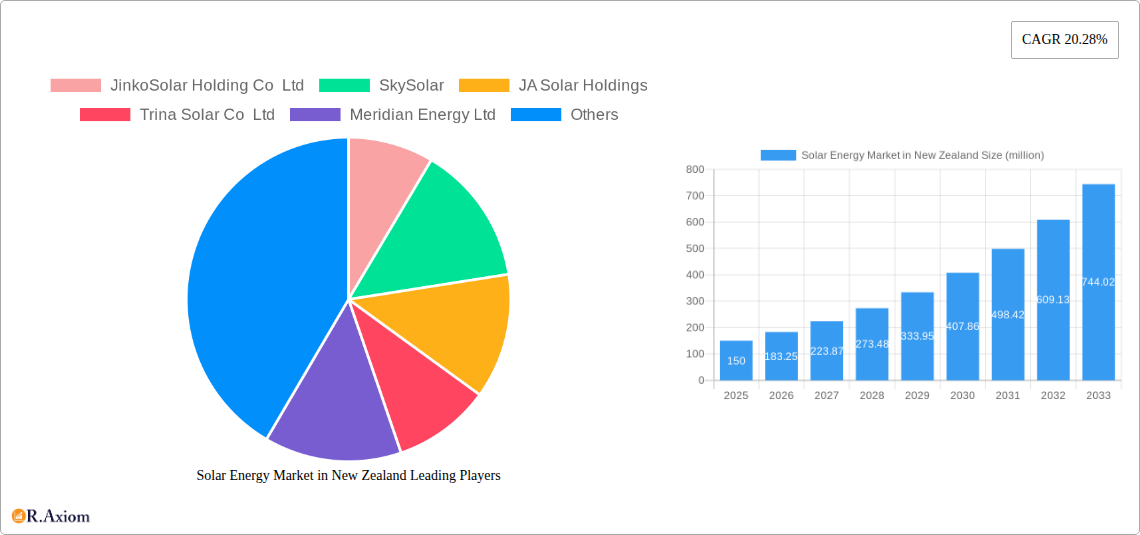
Solar Energy Market in New Zealand Market Size (In Million)
While the market exhibits strong growth prospects, certain restraints warrant consideration. These include intermittent sunlight availability in some regions, necessitating robust energy storage solutions, and the upfront capital investment required for large-scale solar projects. Furthermore, grid infrastructure limitations and the need for skilled labor to manage the growing number of installations present potential challenges. However, the overarching commitment to decarbonization and energy independence within New Zealand, coupled with ongoing technological advancements and increasing economies of scale, are expected to effectively mitigate these restraints. The market's segmentation reveals strong potential across Residential, Commercial and Industrial (C&I), and Utility sectors, each driven by distinct adoption patterns and investment landscapes. Companies are actively investing in expanding their solar portfolios, indicating a competitive and evolving market environment.
Solar Energy Market in New Zealand Company Market Share
This detailed report provides an in-depth analysis of the New Zealand solar energy market, forecasting robust growth driven by increasing demand for renewable energy solutions, supportive government policies, and significant technological advancements. Spanning the historical period of 2019-2024, with a base year of 2025 and a forecast period extending to 2033, this study offers critical insights into market dynamics, competitive landscapes, and emerging opportunities for stakeholders. With an estimated market size projected to reach xx million in 2025, the New Zealand solar sector is poised for substantial expansion, driven by a collective ambition to achieve energy independence and reduce carbon emissions.
Solar Energy Market in New Zealand Market Concentration & Innovation
The New Zealand solar energy market is characterized by a moderately concentrated landscape, with key players actively investing in scaling operations and technological advancements. Innovation is primarily driven by the urgent need to integrate solar power into the national grid, improve energy storage solutions, and enhance panel efficiency to maximize energy generation across diverse geographical conditions. Regulatory frameworks, such as government incentives and renewable energy targets, play a crucial role in fostering market growth and encouraging new entrants. While product substitutes like wind and hydro power exist, the declining cost of solar photovoltaic (PV) technology and its versatility are making it an increasingly attractive option. End-user trends show a growing preference for distributed generation, particularly among residential and commercial sectors seeking energy independence and cost savings. Mergers and acquisition (M&A) activities are expected to gain momentum as larger energy companies seek to consolidate their market positions and acquire innovative technologies or established project portfolios. The estimated M&A deal values are projected to be in the hundreds of millions, reflecting the significant investment potential in this sector.
- Market Share Dynamics: Leading companies are focusing on expanding their project pipelines and technological capabilities to capture a larger share of the growing market.
- Innovation Drivers: Focus on high-efficiency solar panels, advanced battery storage systems, and smart grid integration solutions.
- Regulatory Impact: Government subsidies, feed-in tariffs, and carbon emission reduction targets are key enablers of market growth.
- End-User Adoption: Increasing demand from residential homeowners, commercial enterprises, and industrial facilities for sustainable and cost-effective energy solutions.
- M&A Trends: Strategic acquisitions and partnerships aimed at accelerating project development and expanding market reach.
Solar Energy Market in New Zealand Industry Trends & Insights
The New Zealand solar energy market is experiencing a significant growth trajectory, propelled by a confluence of favorable industry trends and compelling insights. The projected Compound Annual Growth Rate (CAGR) for the forecast period (2025–2033) is expected to be around xx%, indicating a robust expansion. This growth is underpinned by increasing government commitments to renewable energy targets, which are driving substantial investment in solar infrastructure. Technological disruptions, particularly in the realm of solar panel efficiency and energy storage solutions, are making solar power more accessible and economically viable than ever before. Consumer preferences are shifting towards sustainable energy consumption, with a rising awareness of the environmental and economic benefits of solar installations. This shift is evident in the growing market penetration of solar PV systems across both urban and rural areas of New Zealand. Competitive dynamics are intensifying, with established energy providers, independent developers, and international players vying for market share. The declining levelized cost of electricity (LCOE) for solar power further enhances its competitiveness against traditional energy sources. The integration of smart grid technologies and battery storage systems is revolutionizing how solar energy is managed and consumed, enabling greater grid stability and reliability. Furthermore, the development of innovative financing models and leasing options is making solar energy more affordable for a wider range of consumers. The increasing adoption of solar energy is not only contributing to New Zealand's decarbonization efforts but also creating new job opportunities and fostering economic growth within the green technology sector. The government's proactive approach in streamlining regulatory processes and providing financial incentives is crucial in sustaining this positive momentum.
Dominant Markets & Segments in Solar Energy Market in New Zealand
The New Zealand solar energy market demonstrates significant dominance across various segments, driven by specific economic policies, infrastructural advancements, and evolving consumer demands. The Utility segment is poised to be the largest contributor to market growth, fueled by large-scale solar farm developments and strategic partnerships aimed at meeting the nation's growing energy needs with clean, renewable power. These utility-scale projects are crucial for grid modernization and energy security, attracting substantial investment from both domestic and international entities.
- Utility Segment:
- Key Drivers: Government renewable energy targets, grid stability requirements, and the need for large-scale, cost-effective energy generation.
- Dominance Analysis: Utility-scale solar farms are crucial for meeting New Zealand's energy demands and achieving its climate goals. The ongoing development of gigawatt-scale projects signifies strong investor confidence and a long-term commitment to solar power. These projects benefit from economies of scale, leading to a lower cost of electricity production, making them highly competitive.
- Commercial and Industrial (C&I) Segment:
- Key Drivers: Rising electricity costs, corporate sustainability initiatives, and the desire for energy independence and operational cost reduction.
- Dominance Analysis: The C&I segment is experiencing rapid growth as businesses recognize the financial and environmental benefits of adopting solar energy. On-site solar installations help reduce operating expenses, enhance brand reputation, and ensure a more stable and predictable energy supply. Many businesses are integrating solar with battery storage to further optimize their energy consumption and minimize reliance on the grid during peak demand periods.
- Residential Segment:
- Key Drivers: Falling solar panel prices, attractive government rebates and incentives, and increasing homeowner awareness of environmental issues and long-term cost savings.
- Dominance Analysis: The residential sector continues to be a significant driver of solar adoption. Homeowners are increasingly investing in rooftop solar PV systems, often combined with battery storage, to reduce their electricity bills and contribute to a greener future. The ease of installation and the availability of various financing options are making solar accessible to a broader demographic.
Solar Energy Market in New Zealand Product Developments
Product development in the New Zealand solar energy market is increasingly focused on enhancing efficiency, reliability, and integration capabilities. Innovations in solar panel technology, such as the widespread adoption of PERC (Passivated Emitter and Rear Cell) and bifacial modules, are leading to higher energy yields and improved performance in varying light conditions. The development of advanced battery storage systems, including lithium-ion and emerging solid-state technologies, is crucial for addressing the intermittency of solar power and ensuring a stable energy supply. Smart inverters and energy management systems are also gaining prominence, enabling seamless integration with the grid and optimizing energy consumption for end-users. These advancements are driven by a competitive landscape that values cost-effectiveness, durability, and environmental sustainability, ensuring that solar energy solutions are increasingly fitting for the diverse needs of the New Zealand market.
Report Scope & Segmentation Analysis
This report comprehensively analyzes the New Zealand solar energy market, segmented by end-user. The segmentation includes the Residential sector, focusing on individual households adopting solar for personal energy needs and cost savings. Projections indicate a steady market size increase within this segment, driven by declining installation costs and increased environmental consciousness. The Commercial and Industrial (C&I) segment encompasses businesses of all sizes investing in solar to reduce operational expenses and meet sustainability goals. This segment is expected to witness substantial growth, supported by larger project deployments and tailored energy solutions. The Utility segment involves large-scale solar farms developed for grid integration and public energy supply. This segment is anticipated to experience the most significant expansion, driven by national renewable energy targets and substantial infrastructure investments. Competitive dynamics within each segment are influenced by pricing, technological innovation, and regulatory support.
Key Drivers of Solar Energy Market in New Zealand Growth
Several key factors are propelling the growth of the solar energy market in New Zealand. Technologically, advancements in solar panel efficiency and the declining cost of manufacturing are making solar power increasingly competitive. Economically, rising electricity prices and the increasing demand for energy independence are driving adoption. Regulatory drivers, including government incentives, renewable energy targets, and supportive policies for distributed generation, are also crucial. Furthermore, a growing public awareness and commitment to sustainability are fostering greater consumer acceptance and demand for solar solutions.
- Technological Advancements: Higher efficiency solar panels and improved battery storage solutions.
- Economic Factors: Reduced installation costs and increasing electricity prices.
- Government Policies: Renewable energy targets and financial incentives for solar installations.
- Environmental Consciousness: Growing public demand for sustainable energy options.
Challenges in the Solar Energy Market in New Zealand Sector
Despite the promising growth, the New Zealand solar energy market faces several challenges. Grid integration capacity can be a constraint, especially for large-scale solar farms, requiring significant investment in grid upgrades and smart grid technologies. Supply chain disruptions, particularly for specialized components and raw materials, can lead to project delays and increased costs. Obtaining necessary permits and navigating complex regulatory frameworks can also pose hurdles for developers. Additionally, public perception and education regarding the reliability and benefits of solar power, especially during periods of low sunlight, need continuous attention to ensure widespread adoption.
- Grid Intermittency & Integration: Need for advanced grid management and storage solutions.
- Supply Chain Volatility: Potential for delays and cost increases due to global component shortages.
- Regulatory & Permitting Hurdles: Streamlining approval processes for solar projects.
- Public Perception: Educating the public on solar reliability and benefits.
Emerging Opportunities in Solar Energy Market in New Zealand
The New Zealand solar energy market is ripe with emerging opportunities. The development of offshore solar farms, leveraging New Zealand's extensive coastline, presents a novel avenue for large-scale energy generation. Innovations in floating solar technology are also gaining traction. The integration of solar power with electric vehicle (EV) charging infrastructure offers synergistic benefits, creating a more sustainable transportation ecosystem. Furthermore, opportunities exist in developing advanced energy management systems and microgrid solutions for remote communities and industrial parks, enhancing energy resilience and reducing reliance on traditional grid infrastructure. The growing demand for green hydrogen production, powered by renewable energy, also presents a significant future growth area for solar energy.
- Offshore and Floating Solar: Exploring new geographical frontiers for solar deployment.
- Solar-EV Integration: Synergistic opportunities in charging infrastructure.
- Microgrid Development: Enhancing energy resilience for communities and industries.
- Green Hydrogen Production: Leveraging solar for sustainable fuel generation.
Leading Players in the Solar Energy Market in New Zealand Market
- JinkoSolar Holding Co Ltd
- SkySolar
- JA Solar Holdings
- Trina Solar Co Ltd
- Meridian Energy Ltd
- New Zealand Solar Power Ltd
- Sunergise International Limited
- Lodestone Energy Ltd
- ZEN Energy Systems New Zealand Limited
Key Developments in Solar Energy Market in New Zealand Industry
- May 2022: Auckland-based renewables developer Far North Solar Farm (FNSF) announced its partnership with German investment manager and asset development company Aquila Capital to develop an estimated USD 1 billion suite of large-scale solar PV projects across New Zealand's North and South islands. The company expected to commence construction on a 1 GW portfolio of large-scale solar PV projects across the North and South islands.
- April 2022: Contact Energy and Lightsource BP joined a partnership to co-develop grid-scale solar farms in New Zealand. Kwhai Park is expected to be the first of several planned solar farms for the Lightsource BP and Contact Energy alliance in New Zealand. The park's first phase was expected to consist of a solar farm that will span around 300 hectares of land just behind the airport's runways.
Strategic Outlook for Solar Energy Market in New Zealand Market
The strategic outlook for the New Zealand solar energy market remains exceptionally positive, driven by a strong commitment to decarbonization and energy independence. Continued investment in grid modernization, coupled with advancements in energy storage, will be pivotal in maximizing the integration of solar power. Strategic partnerships between developers, utilities, and technology providers will accelerate project deployment and foster innovation. The increasing demand for distributed energy resources and the potential for green hydrogen production present significant future growth catalysts. By leveraging its abundant solar resources and supportive policy environment, New Zealand is well-positioned to become a leader in renewable energy adoption, creating sustainable economic opportunities and a cleaner energy future.
Solar Energy Market in New Zealand Segmentation
-
1. End-User
- 1.1. Residential
- 1.2. Commercial and Industrial (C&I)
- 1.3. Utility
Solar Energy Market in New Zealand Segmentation By Geography
-
1. North America
- 1.1. United States
- 1.2. Canada
- 1.3. Mexico
-
2. South America
- 2.1. Brazil
- 2.2. Argentina
- 2.3. Rest of South America
-
3. Europe
- 3.1. United Kingdom
- 3.2. Germany
- 3.3. France
- 3.4. Italy
- 3.5. Spain
- 3.6. Russia
- 3.7. Benelux
- 3.8. Nordics
- 3.9. Rest of Europe
-
4. Middle East & Africa
- 4.1. Turkey
- 4.2. Israel
- 4.3. GCC
- 4.4. North Africa
- 4.5. South Africa
- 4.6. Rest of Middle East & Africa
-
5. Asia Pacific
- 5.1. China
- 5.2. India
- 5.3. Japan
- 5.4. South Korea
- 5.5. ASEAN
- 5.6. Oceania
- 5.7. Rest of Asia Pacific
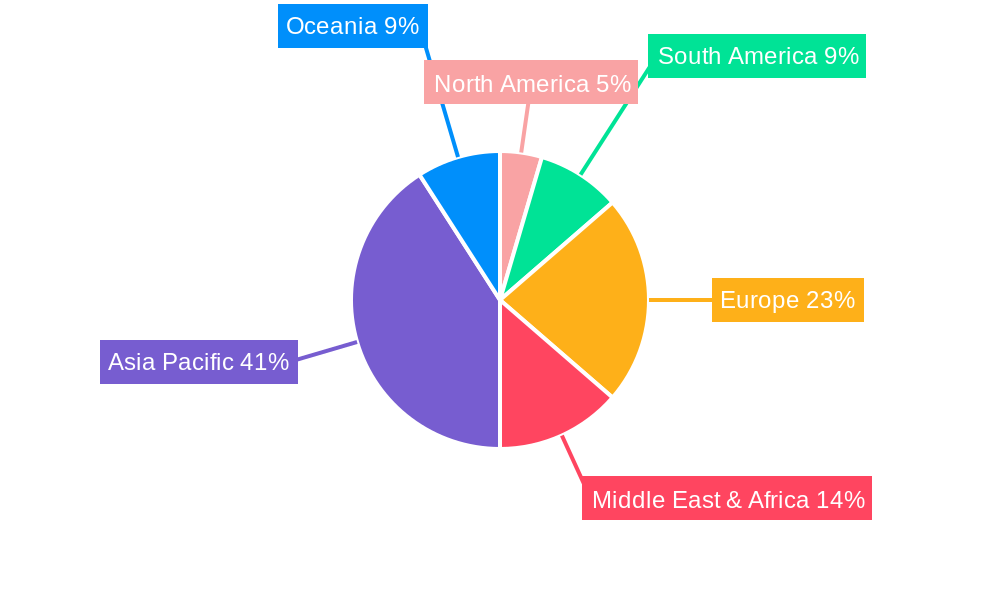
Solar Energy Market in New Zealand Regional Market Share
Geographic Coverage of Solar Energy Market in New Zealand
Solar Energy Market in New Zealand REPORT HIGHLIGHTS
| Aspects | Details |
|---|---|
| Study Period | 2020-2034 |
| Base Year | 2025 |
| Estimated Year | 2026 |
| Forecast Period | 2026-2034 |
| Historical Period | 2020-2025 |
| Growth Rate | CAGR of 20.28% from 2020-2034 |
| Segmentation |
|
Table of Contents
- 1. Introduction
- 1.1. Research Scope
- 1.2. Market Segmentation
- 1.3. Research Objective
- 1.4. Definitions and Assumptions
- 2. Executive Summary
- 2.1. Market Snapshot
- 3. Market Dynamics
- 3.1. Market Drivers
- 3.2. Market Restrains
- 3.3. Market Trends
- 3.4. Market Opportunities
- 4. Market Factor Analysis
- 4.1. Porters Five Forces
- 4.1.1. Bargaining Power of Suppliers
- 4.1.2. Bargaining Power of Buyers
- 4.1.3. Threat of New Entrants
- 4.1.4. Threat of Substitutes
- 4.1.5. Competitive Rivalry
- 4.2. PESTEL analysis
- 4.3. BCG Analysis
- 4.3.1. Stars (High Growth, High Market Share)
- 4.3.2. Cash Cows (Low Growth, High Market Share)
- 4.3.3. Question Mark (High Growth, Low Market Share)
- 4.3.4. Dogs (Low Growth, Low Market Share)
- 4.4. Ansoff Matrix Analysis
- 4.5. Supply Chain Analysis
- 4.6. Regulatory Landscape
- 4.7. Current Market Potential and Opportunity Assessment (TAM–SAM–SOM Framework)
- 4.8. RAX Analyst Note
- 4.1. Porters Five Forces
- 5. Market Analysis, Insights and Forecast 2021-2033
- 5.1. Market Analysis, Insights and Forecast - by End-User
- 5.1.1. Residential
- 5.1.2. Commercial and Industrial (C&I)
- 5.1.3. Utility
- 5.2. Market Analysis, Insights and Forecast - by Region
- 5.2.1. North America
- 5.2.2. South America
- 5.2.3. Europe
- 5.2.4. Middle East & Africa
- 5.2.5. Asia Pacific
- 5.1. Market Analysis, Insights and Forecast - by End-User
- 6. Global Solar Energy Market in New Zealand Analysis, Insights and Forecast, 2021-2033
- 6.1. Market Analysis, Insights and Forecast - by End-User
- 6.1.1. Residential
- 6.1.2. Commercial and Industrial (C&I)
- 6.1.3. Utility
- 6.1. Market Analysis, Insights and Forecast - by End-User
- 7. North America Solar Energy Market in New Zealand Analysis, Insights and Forecast, 2020-2032
- 7.1. Market Analysis, Insights and Forecast - by End-User
- 7.1.1. Residential
- 7.1.2. Commercial and Industrial (C&I)
- 7.1.3. Utility
- 7.1. Market Analysis, Insights and Forecast - by End-User
- 8. South America Solar Energy Market in New Zealand Analysis, Insights and Forecast, 2020-2032
- 8.1. Market Analysis, Insights and Forecast - by End-User
- 8.1.1. Residential
- 8.1.2. Commercial and Industrial (C&I)
- 8.1.3. Utility
- 8.1. Market Analysis, Insights and Forecast - by End-User
- 9. Europe Solar Energy Market in New Zealand Analysis, Insights and Forecast, 2020-2032
- 9.1. Market Analysis, Insights and Forecast - by End-User
- 9.1.1. Residential
- 9.1.2. Commercial and Industrial (C&I)
- 9.1.3. Utility
- 9.1. Market Analysis, Insights and Forecast - by End-User
- 10. Middle East & Africa Solar Energy Market in New Zealand Analysis, Insights and Forecast, 2020-2032
- 10.1. Market Analysis, Insights and Forecast - by End-User
- 10.1.1. Residential
- 10.1.2. Commercial and Industrial (C&I)
- 10.1.3. Utility
- 10.1. Market Analysis, Insights and Forecast - by End-User
- 11. Asia Pacific Solar Energy Market in New Zealand Analysis, Insights and Forecast, 2020-2032
- 11.1. Market Analysis, Insights and Forecast - by End-User
- 11.1.1. Residential
- 11.1.2. Commercial and Industrial (C&I)
- 11.1.3. Utility
- 11.1. Market Analysis, Insights and Forecast - by End-User
- 12. Competitive Analysis
- 12.1. Company Profiles
- 12.1.1 JinkoSolar Holding Co Ltd
- 12.1.1.1. Company Overview
- 12.1.1.2. Products
- 12.1.1.3. Company Financials
- 12.1.1.4. SWOT Analysis
- 12.1.2 SkySolar
- 12.1.2.1. Company Overview
- 12.1.2.2. Products
- 12.1.2.3. Company Financials
- 12.1.2.4. SWOT Analysis
- 12.1.3 JA Solar Holdings
- 12.1.3.1. Company Overview
- 12.1.3.2. Products
- 12.1.3.3. Company Financials
- 12.1.3.4. SWOT Analysis
- 12.1.4 Trina Solar Co Ltd
- 12.1.4.1. Company Overview
- 12.1.4.2. Products
- 12.1.4.3. Company Financials
- 12.1.4.4. SWOT Analysis
- 12.1.5 Meridian Energy Ltd
- 12.1.5.1. Company Overview
- 12.1.5.2. Products
- 12.1.5.3. Company Financials
- 12.1.5.4. SWOT Analysis
- 12.1.6 New Zealand Solar Power Ltd
- 12.1.6.1. Company Overview
- 12.1.6.2. Products
- 12.1.6.3. Company Financials
- 12.1.6.4. SWOT Analysis
- 12.1.7 Sunergise International Limited
- 12.1.7.1. Company Overview
- 12.1.7.2. Products
- 12.1.7.3. Company Financials
- 12.1.7.4. SWOT Analysis
- 12.1.8 Lodestone Energy Ltd
- 12.1.8.1. Company Overview
- 12.1.8.2. Products
- 12.1.8.3. Company Financials
- 12.1.8.4. SWOT Analysis
- 12.1.9 ZEN Energy Systems New Zealand Limited
- 12.1.9.1. Company Overview
- 12.1.9.2. Products
- 12.1.9.3. Company Financials
- 12.1.9.4. SWOT Analysis
- 12.1.1 JinkoSolar Holding Co Ltd
- 12.2. Market Entropy
- 12.2.1 Company's Key Areas Served
- 12.2.2 Recent Developments
- 12.3. Company Market Share Analysis 2025
- 12.3.1 Top 5 Companies Market Share Analysis
- 12.3.2 Top 3 Companies Market Share Analysis
- 12.4. List of Potential Customers
- 13. Research Methodology
List of Figures
- Figure 1: Global Solar Energy Market in New Zealand Revenue Breakdown (million, %) by Region 2025 & 2033
- Figure 2: Global Solar Energy Market in New Zealand Volume Breakdown (Gigawatt, %) by Region 2025 & 2033
- Figure 3: North America Solar Energy Market in New Zealand Revenue (million), by End-User 2025 & 2033
- Figure 4: North America Solar Energy Market in New Zealand Volume (Gigawatt), by End-User 2025 & 2033
- Figure 5: North America Solar Energy Market in New Zealand Revenue Share (%), by End-User 2025 & 2033
- Figure 6: North America Solar Energy Market in New Zealand Volume Share (%), by End-User 2025 & 2033
- Figure 7: North America Solar Energy Market in New Zealand Revenue (million), by Country 2025 & 2033
- Figure 8: North America Solar Energy Market in New Zealand Volume (Gigawatt), by Country 2025 & 2033
- Figure 9: North America Solar Energy Market in New Zealand Revenue Share (%), by Country 2025 & 2033
- Figure 10: North America Solar Energy Market in New Zealand Volume Share (%), by Country 2025 & 2033
- Figure 11: South America Solar Energy Market in New Zealand Revenue (million), by End-User 2025 & 2033
- Figure 12: South America Solar Energy Market in New Zealand Volume (Gigawatt), by End-User 2025 & 2033
- Figure 13: South America Solar Energy Market in New Zealand Revenue Share (%), by End-User 2025 & 2033
- Figure 14: South America Solar Energy Market in New Zealand Volume Share (%), by End-User 2025 & 2033
- Figure 15: South America Solar Energy Market in New Zealand Revenue (million), by Country 2025 & 2033
- Figure 16: South America Solar Energy Market in New Zealand Volume (Gigawatt), by Country 2025 & 2033
- Figure 17: South America Solar Energy Market in New Zealand Revenue Share (%), by Country 2025 & 2033
- Figure 18: South America Solar Energy Market in New Zealand Volume Share (%), by Country 2025 & 2033
- Figure 19: Europe Solar Energy Market in New Zealand Revenue (million), by End-User 2025 & 2033
- Figure 20: Europe Solar Energy Market in New Zealand Volume (Gigawatt), by End-User 2025 & 2033
- Figure 21: Europe Solar Energy Market in New Zealand Revenue Share (%), by End-User 2025 & 2033
- Figure 22: Europe Solar Energy Market in New Zealand Volume Share (%), by End-User 2025 & 2033
- Figure 23: Europe Solar Energy Market in New Zealand Revenue (million), by Country 2025 & 2033
- Figure 24: Europe Solar Energy Market in New Zealand Volume (Gigawatt), by Country 2025 & 2033
- Figure 25: Europe Solar Energy Market in New Zealand Revenue Share (%), by Country 2025 & 2033
- Figure 26: Europe Solar Energy Market in New Zealand Volume Share (%), by Country 2025 & 2033
- Figure 27: Middle East & Africa Solar Energy Market in New Zealand Revenue (million), by End-User 2025 & 2033
- Figure 28: Middle East & Africa Solar Energy Market in New Zealand Volume (Gigawatt), by End-User 2025 & 2033
- Figure 29: Middle East & Africa Solar Energy Market in New Zealand Revenue Share (%), by End-User 2025 & 2033
- Figure 30: Middle East & Africa Solar Energy Market in New Zealand Volume Share (%), by End-User 2025 & 2033
- Figure 31: Middle East & Africa Solar Energy Market in New Zealand Revenue (million), by Country 2025 & 2033
- Figure 32: Middle East & Africa Solar Energy Market in New Zealand Volume (Gigawatt), by Country 2025 & 2033
- Figure 33: Middle East & Africa Solar Energy Market in New Zealand Revenue Share (%), by Country 2025 & 2033
- Figure 34: Middle East & Africa Solar Energy Market in New Zealand Volume Share (%), by Country 2025 & 2033
- Figure 35: Asia Pacific Solar Energy Market in New Zealand Revenue (million), by End-User 2025 & 2033
- Figure 36: Asia Pacific Solar Energy Market in New Zealand Volume (Gigawatt), by End-User 2025 & 2033
- Figure 37: Asia Pacific Solar Energy Market in New Zealand Revenue Share (%), by End-User 2025 & 2033
- Figure 38: Asia Pacific Solar Energy Market in New Zealand Volume Share (%), by End-User 2025 & 2033
- Figure 39: Asia Pacific Solar Energy Market in New Zealand Revenue (million), by Country 2025 & 2033
- Figure 40: Asia Pacific Solar Energy Market in New Zealand Volume (Gigawatt), by Country 2025 & 2033
- Figure 41: Asia Pacific Solar Energy Market in New Zealand Revenue Share (%), by Country 2025 & 2033
- Figure 42: Asia Pacific Solar Energy Market in New Zealand Volume Share (%), by Country 2025 & 2033
List of Tables
- Table 1: Global Solar Energy Market in New Zealand Revenue million Forecast, by End-User 2020 & 2033
- Table 2: Global Solar Energy Market in New Zealand Volume Gigawatt Forecast, by End-User 2020 & 2033
- Table 3: Global Solar Energy Market in New Zealand Revenue million Forecast, by Region 2020 & 2033
- Table 4: Global Solar Energy Market in New Zealand Volume Gigawatt Forecast, by Region 2020 & 2033
- Table 5: Global Solar Energy Market in New Zealand Revenue million Forecast, by End-User 2020 & 2033
- Table 6: Global Solar Energy Market in New Zealand Volume Gigawatt Forecast, by End-User 2020 & 2033
- Table 7: Global Solar Energy Market in New Zealand Revenue million Forecast, by Country 2020 & 2033
- Table 8: Global Solar Energy Market in New Zealand Volume Gigawatt Forecast, by Country 2020 & 2033
- Table 9: United States Solar Energy Market in New Zealand Revenue (million) Forecast, by Application 2020 & 2033
- Table 10: United States Solar Energy Market in New Zealand Volume (Gigawatt) Forecast, by Application 2020 & 2033
- Table 11: Canada Solar Energy Market in New Zealand Revenue (million) Forecast, by Application 2020 & 2033
- Table 12: Canada Solar Energy Market in New Zealand Volume (Gigawatt) Forecast, by Application 2020 & 2033
- Table 13: Mexico Solar Energy Market in New Zealand Revenue (million) Forecast, by Application 2020 & 2033
- Table 14: Mexico Solar Energy Market in New Zealand Volume (Gigawatt) Forecast, by Application 2020 & 2033
- Table 15: Global Solar Energy Market in New Zealand Revenue million Forecast, by End-User 2020 & 2033
- Table 16: Global Solar Energy Market in New Zealand Volume Gigawatt Forecast, by End-User 2020 & 2033
- Table 17: Global Solar Energy Market in New Zealand Revenue million Forecast, by Country 2020 & 2033
- Table 18: Global Solar Energy Market in New Zealand Volume Gigawatt Forecast, by Country 2020 & 2033
- Table 19: Brazil Solar Energy Market in New Zealand Revenue (million) Forecast, by Application 2020 & 2033
- Table 20: Brazil Solar Energy Market in New Zealand Volume (Gigawatt) Forecast, by Application 2020 & 2033
- Table 21: Argentina Solar Energy Market in New Zealand Revenue (million) Forecast, by Application 2020 & 2033
- Table 22: Argentina Solar Energy Market in New Zealand Volume (Gigawatt) Forecast, by Application 2020 & 2033
- Table 23: Rest of South America Solar Energy Market in New Zealand Revenue (million) Forecast, by Application 2020 & 2033
- Table 24: Rest of South America Solar Energy Market in New Zealand Volume (Gigawatt) Forecast, by Application 2020 & 2033
- Table 25: Global Solar Energy Market in New Zealand Revenue million Forecast, by End-User 2020 & 2033
- Table 26: Global Solar Energy Market in New Zealand Volume Gigawatt Forecast, by End-User 2020 & 2033
- Table 27: Global Solar Energy Market in New Zealand Revenue million Forecast, by Country 2020 & 2033
- Table 28: Global Solar Energy Market in New Zealand Volume Gigawatt Forecast, by Country 2020 & 2033
- Table 29: United Kingdom Solar Energy Market in New Zealand Revenue (million) Forecast, by Application 2020 & 2033
- Table 30: United Kingdom Solar Energy Market in New Zealand Volume (Gigawatt) Forecast, by Application 2020 & 2033
- Table 31: Germany Solar Energy Market in New Zealand Revenue (million) Forecast, by Application 2020 & 2033
- Table 32: Germany Solar Energy Market in New Zealand Volume (Gigawatt) Forecast, by Application 2020 & 2033
- Table 33: France Solar Energy Market in New Zealand Revenue (million) Forecast, by Application 2020 & 2033
- Table 34: France Solar Energy Market in New Zealand Volume (Gigawatt) Forecast, by Application 2020 & 2033
- Table 35: Italy Solar Energy Market in New Zealand Revenue (million) Forecast, by Application 2020 & 2033
- Table 36: Italy Solar Energy Market in New Zealand Volume (Gigawatt) Forecast, by Application 2020 & 2033
- Table 37: Spain Solar Energy Market in New Zealand Revenue (million) Forecast, by Application 2020 & 2033
- Table 38: Spain Solar Energy Market in New Zealand Volume (Gigawatt) Forecast, by Application 2020 & 2033
- Table 39: Russia Solar Energy Market in New Zealand Revenue (million) Forecast, by Application 2020 & 2033
- Table 40: Russia Solar Energy Market in New Zealand Volume (Gigawatt) Forecast, by Application 2020 & 2033
- Table 41: Benelux Solar Energy Market in New Zealand Revenue (million) Forecast, by Application 2020 & 2033
- Table 42: Benelux Solar Energy Market in New Zealand Volume (Gigawatt) Forecast, by Application 2020 & 2033
- Table 43: Nordics Solar Energy Market in New Zealand Revenue (million) Forecast, by Application 2020 & 2033
- Table 44: Nordics Solar Energy Market in New Zealand Volume (Gigawatt) Forecast, by Application 2020 & 2033
- Table 45: Rest of Europe Solar Energy Market in New Zealand Revenue (million) Forecast, by Application 2020 & 2033
- Table 46: Rest of Europe Solar Energy Market in New Zealand Volume (Gigawatt) Forecast, by Application 2020 & 2033
- Table 47: Global Solar Energy Market in New Zealand Revenue million Forecast, by End-User 2020 & 2033
- Table 48: Global Solar Energy Market in New Zealand Volume Gigawatt Forecast, by End-User 2020 & 2033
- Table 49: Global Solar Energy Market in New Zealand Revenue million Forecast, by Country 2020 & 2033
- Table 50: Global Solar Energy Market in New Zealand Volume Gigawatt Forecast, by Country 2020 & 2033
- Table 51: Turkey Solar Energy Market in New Zealand Revenue (million) Forecast, by Application 2020 & 2033
- Table 52: Turkey Solar Energy Market in New Zealand Volume (Gigawatt) Forecast, by Application 2020 & 2033
- Table 53: Israel Solar Energy Market in New Zealand Revenue (million) Forecast, by Application 2020 & 2033
- Table 54: Israel Solar Energy Market in New Zealand Volume (Gigawatt) Forecast, by Application 2020 & 2033
- Table 55: GCC Solar Energy Market in New Zealand Revenue (million) Forecast, by Application 2020 & 2033
- Table 56: GCC Solar Energy Market in New Zealand Volume (Gigawatt) Forecast, by Application 2020 & 2033
- Table 57: North Africa Solar Energy Market in New Zealand Revenue (million) Forecast, by Application 2020 & 2033
- Table 58: North Africa Solar Energy Market in New Zealand Volume (Gigawatt) Forecast, by Application 2020 & 2033
- Table 59: South Africa Solar Energy Market in New Zealand Revenue (million) Forecast, by Application 2020 & 2033
- Table 60: South Africa Solar Energy Market in New Zealand Volume (Gigawatt) Forecast, by Application 2020 & 2033
- Table 61: Rest of Middle East & Africa Solar Energy Market in New Zealand Revenue (million) Forecast, by Application 2020 & 2033
- Table 62: Rest of Middle East & Africa Solar Energy Market in New Zealand Volume (Gigawatt) Forecast, by Application 2020 & 2033
- Table 63: Global Solar Energy Market in New Zealand Revenue million Forecast, by End-User 2020 & 2033
- Table 64: Global Solar Energy Market in New Zealand Volume Gigawatt Forecast, by End-User 2020 & 2033
- Table 65: Global Solar Energy Market in New Zealand Revenue million Forecast, by Country 2020 & 2033
- Table 66: Global Solar Energy Market in New Zealand Volume Gigawatt Forecast, by Country 2020 & 2033
- Table 67: China Solar Energy Market in New Zealand Revenue (million) Forecast, by Application 2020 & 2033
- Table 68: China Solar Energy Market in New Zealand Volume (Gigawatt) Forecast, by Application 2020 & 2033
- Table 69: India Solar Energy Market in New Zealand Revenue (million) Forecast, by Application 2020 & 2033
- Table 70: India Solar Energy Market in New Zealand Volume (Gigawatt) Forecast, by Application 2020 & 2033
- Table 71: Japan Solar Energy Market in New Zealand Revenue (million) Forecast, by Application 2020 & 2033
- Table 72: Japan Solar Energy Market in New Zealand Volume (Gigawatt) Forecast, by Application 2020 & 2033
- Table 73: South Korea Solar Energy Market in New Zealand Revenue (million) Forecast, by Application 2020 & 2033
- Table 74: South Korea Solar Energy Market in New Zealand Volume (Gigawatt) Forecast, by Application 2020 & 2033
- Table 75: ASEAN Solar Energy Market in New Zealand Revenue (million) Forecast, by Application 2020 & 2033
- Table 76: ASEAN Solar Energy Market in New Zealand Volume (Gigawatt) Forecast, by Application 2020 & 2033
- Table 77: Oceania Solar Energy Market in New Zealand Revenue (million) Forecast, by Application 2020 & 2033
- Table 78: Oceania Solar Energy Market in New Zealand Volume (Gigawatt) Forecast, by Application 2020 & 2033
- Table 79: Rest of Asia Pacific Solar Energy Market in New Zealand Revenue (million) Forecast, by Application 2020 & 2033
- Table 80: Rest of Asia Pacific Solar Energy Market in New Zealand Volume (Gigawatt) Forecast, by Application 2020 & 2033
Frequently Asked Questions
1. What is the projected Compound Annual Growth Rate (CAGR) of the Solar Energy Market in New Zealand?
The projected CAGR is approximately 20.28%.
2. Which companies are prominent players in the Solar Energy Market in New Zealand?
Key companies in the market include JinkoSolar Holding Co Ltd, SkySolar, JA Solar Holdings, Trina Solar Co Ltd, Meridian Energy Ltd, New Zealand Solar Power Ltd, Sunergise International Limited, Lodestone Energy Ltd, ZEN Energy Systems New Zealand Limited.
3. What are the main segments of the Solar Energy Market in New Zealand?
The market segments include End-User.
4. Can you provide details about the market size?
The market size is estimated to be USD 150 million as of 2022.
5. What are some drivers contributing to market growth?
4.; Increasing Energy Demand4.; Upcoming and Ongoing Projects of Power Plants.
6. What are the notable trends driving market growth?
Utility Sector to Witness a Significant Growth.
7. Are there any restraints impacting market growth?
4.; Complexity and Expensive Nature of Coal-fired and Natural-gas-fired Power Plants.
8. Can you provide examples of recent developments in the market?
May 2022: Auckland-based renewables developer Far North Solar Farm (FNSF) announced its partnership with German investment manager and asset development company Aquila Capital to develop an estimated USD 1 billion suite of large-scale solar PV projects across New Zealand's North and South islands. The company expected to commence construction on a 1 GW portfolio of large-scale solar PV projects across the North and South islands.
9. What pricing options are available for accessing the report?
Pricing options include single-user, multi-user, and enterprise licenses priced at USD 3800, USD 4500, and USD 5800 respectively.
10. Is the market size provided in terms of value or volume?
The market size is provided in terms of value, measured in million and volume, measured in Gigawatt.
11. Are there any specific market keywords associated with the report?
Yes, the market keyword associated with the report is "Solar Energy Market in New Zealand," which aids in identifying and referencing the specific market segment covered.
12. How do I determine which pricing option suits my needs best?
The pricing options vary based on user requirements and access needs. Individual users may opt for single-user licenses, while businesses requiring broader access may choose multi-user or enterprise licenses for cost-effective access to the report.
13. Are there any additional resources or data provided in the Solar Energy Market in New Zealand report?
While the report offers comprehensive insights, it's advisable to review the specific contents or supplementary materials provided to ascertain if additional resources or data are available.
14. How can I stay updated on further developments or reports in the Solar Energy Market in New Zealand?
To stay informed about further developments, trends, and reports in the Solar Energy Market in New Zealand, consider subscribing to industry newsletters, following relevant companies and organizations, or regularly checking reputable industry news sources and publications.
Methodology
Step 1 - Identification of Relevant Samples Size from Population Database


Step 2 - Approaches for Defining Global Market Size (Value, Volume* & Price*)

Note*: In applicable scenarios
Step 3 - Data Sources
Primary Research
- Web Analytics
- Survey Reports
- Research Institute
- Latest Research Reports
- Opinion Leaders
Secondary Research
- Annual Reports
- White Paper
- Latest Press Release
- Industry Association
- Paid Database
- Investor Presentations

Step 4 - Data Triangulation
Involves using different sources of information in order to increase the validity of a study
These sources are likely to be stakeholders in a program - participants, other researchers, program staff, other community members, and so on.
Then we put all data in single framework & apply various statistical tools to find out the dynamic on the market.
During the analysis stage, feedback from the stakeholder groups would be compared to determine areas of agreement as well as areas of divergence