

Key Insights
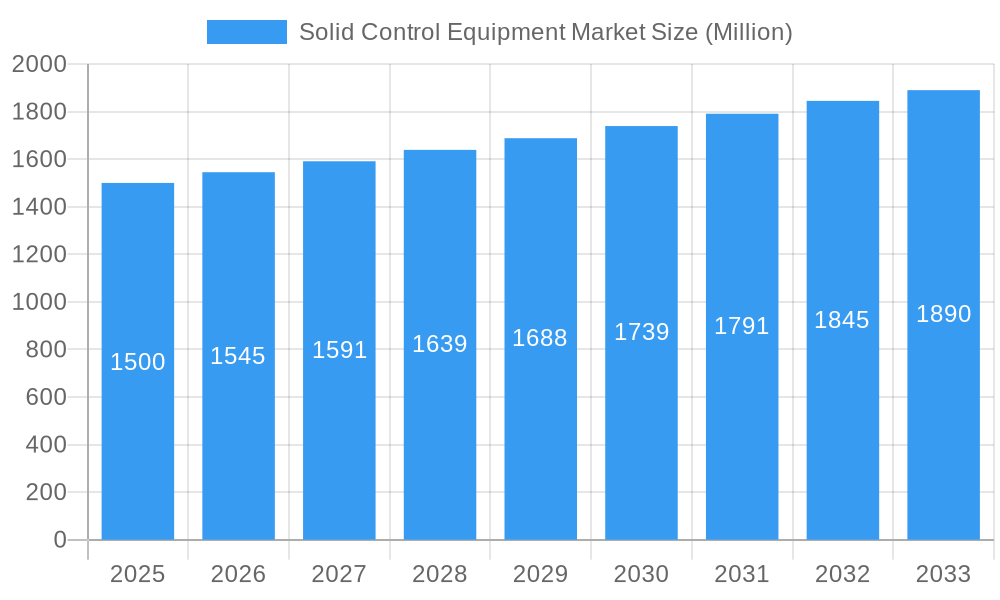
The global Solid Control Equipment (SCE) market is projected for substantial growth, anticipating a market size of $1.4 billion by 2025, with a Compound Annual Growth Rate (CAGR) of 7.8% through 2033. This expansion is driven by escalating global oil and gas demand, requiring optimized drilling operations and fluid management. Key growth factors include ongoing exploration and production activities, particularly in unconventional reservoirs, and renewed offshore exploration complemented by continued onshore development in regions like North America and the Middle East. Technological advancements in SCE, alongside stringent environmental regulations for drilling waste management, further propel market momentum. The integration of automation and smart technologies is also enhancing operational efficiency and reducing downtime.
Solid Control Equipment Market Market Size (In Billion)
Despite a positive outlook, the market confronts challenges. Volatile oil prices directly influence exploration budgets, impacting SCE demand. Furthermore, the long-term shift towards renewable energy sources and decarbonization may temper fossil fuel industry growth, consequently affecting related equipment demand. However, the immediate future sustains a strong reliance on oil and gas, ensuring continued SCE demand. Key market segments include shale shakers, desanders, desilters, vacuum degassers, and centrifuges. Onshore deployments currently lead, with offshore segments poised for significant growth due to deepwater exploration. Leading players such as Schlumberger, Halliburton, and Baker Hughes are actively investing in R&D to innovate and expand their product offerings, aligning with evolving industry needs and regulatory frameworks.
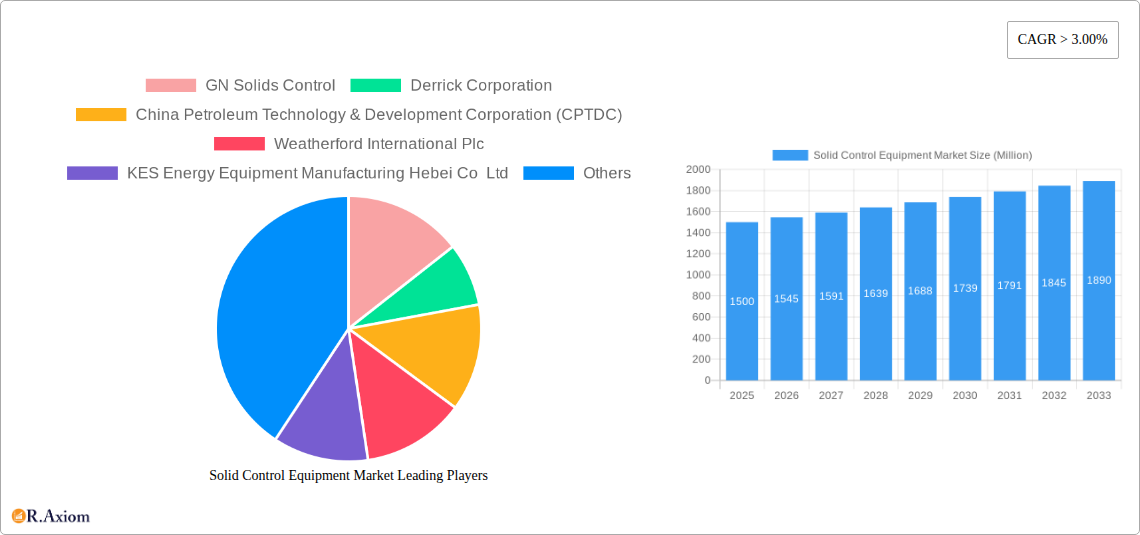
Solid Control Equipment Market Company Market Share
Solid Control Equipment Market Analysis and Forecast (2019-2033)
This comprehensive report offers strategic insights into the global Solid Control Equipment market, detailing market size, segmentation, key trends, growth drivers, challenges, and competitive dynamics. Analyzing the historical period (2019-2024), with 2025 as the base year and a forecast to 2033, this research provides critical intelligence for industry stakeholders. The market is expected to reach approximately $1.4 billion by 2025, with a CAGR of 7.8%.
Solid Control Equipment Market Market Concentration & Innovation
The Solid Control Equipment market exhibits a moderate level of concentration, with a blend of large established players and emerging specialized manufacturers. Innovation is a key differentiator, driven by the relentless pursuit of enhanced drilling efficiency, environmental compliance, and cost reduction in oil and gas operations. Companies are investing heavily in R&D to develop more efficient shale shakers with advanced screen technologies, high-performance centrifuges for precise cuttings separation, and vacuum degassers that effectively remove entrained gases. Regulatory frameworks, particularly those focused on environmental protection and waste management in drilling operations, significantly influence product development and market adoption. The growing emphasis on reducing drilling fluid waste and reclaiming valuable drilling materials is pushing the demand for advanced solids control solutions. Product substitutes, while present in simpler mechanical separation methods, are increasingly being outpaced by the technological sophistication and effectiveness of modern solid control equipment. End-user trends are shifting towards integrated solutions that offer automation, remote monitoring, and data analytics for optimized performance and predictive maintenance. Mergers and acquisition (M&A) activities are strategic plays to gain market share, acquire new technologies, and expand geographical reach. For instance, recent M&A deals in the broader oilfield services sector, valued in the hundreds of millions of dollars, indicate a consolidation trend.
Solid Control Equipment Market Industry Trends & Insights
The global Solid Control Equipment market is experiencing robust growth, fueled by several interconnected industry trends and insights. The ongoing demand for oil and gas, coupled with the need for efficient and environmentally responsible exploration and production (E&P) activities, serves as a primary growth driver. Technological advancements in drilling techniques, such as horizontal drilling and hydraulic fracturing, necessitate sophisticated solids control systems to manage increased volumes of cuttings and drilling fluids. The growing awareness and stringent regulations regarding environmental protection, particularly concerning the disposal of drilling waste, are compelling operators to invest in advanced solids control equipment to minimize their ecological footprint. The trend towards digitalization and automation in the oil and gas industry is also impacting the solids control sector, with manufacturers developing smart equipment featuring IoT capabilities for remote monitoring, predictive maintenance, and optimized operational performance. Furthermore, the increasing focus on cost optimization by oil and gas companies is driving the adoption of solids control solutions that enhance drilling fluid recovery and reduce overall drilling costs. The market penetration of advanced solids control technologies is expected to deepen as operators recognize their long-term economic and environmental benefits. The Compound Annual Growth Rate (CAGR) for this market is projected to be approximately xx% over the forecast period. Consumer preferences are increasingly leaning towards equipment that offers high efficiency, reliability, low maintenance, and compliance with evolving environmental standards. Competitive dynamics are characterized by a strong emphasis on product innovation, technological differentiation, and after-sales service.
Dominant Markets & Segments in Solid Control Equipment Market
The Onshore segment is currently the dominant deployment location for solid control equipment, driven by the vast number of oil and gas wells drilled and maintained on land globally. Economic policies in major oil-producing regions, such as North America and the Middle East, that encourage domestic exploration and production significantly boost the demand for onshore solids control solutions. The well-established infrastructure supporting onshore drilling operations further solidifies its leading position.
- Key Drivers for Onshore Dominance:
- Extensive Drilling Activity: The sheer volume of onshore wells being drilled and serviced globally.
- Cost-Effectiveness: Onshore operations often present lower logistical and operational costs compared to offshore, making investment in equipment more accessible.
- Regulatory Focus: Increasing environmental regulations specifically targeting onshore drilling waste management.
- Technological Adoption: The ease of integrating and maintaining advanced solids control equipment in existing onshore facilities.
Within the Type segmentation, Shale Shakers represent the most significant segment. Their fundamental role in initial cuttings separation makes them indispensable in virtually all drilling operations. The continuous demand for higher efficiency and finer screen separation fuels ongoing innovation and market leadership in this sub-segment.
- Key Drivers for Shale Shaker Dominance:
- Primary Separation Function: Essential for removing larger solids from drilling fluid at the earliest stage.
- Technological Advancements: Development of multi-panel designs, linear motion, and elliptical motion shakers for improved performance.
- Cost-Effectiveness: Relatively lower initial investment compared to more complex equipment.
- Ubiquitous Application: Used across diverse drilling environments and fluid types.
Geographically, North America continues to be a dominant market for solid control equipment, largely due to its extensive shale gas and oil reserves, coupled with a highly developed oilfield services sector. Favorable economic policies and significant investment in exploration and production activities underpin this dominance. The Middle East also presents a substantial and growing market, driven by its vast hydrocarbon reserves and ongoing efforts to expand production capacity.
Solid Control Equipment Market Product Developments
Product development in the Solid Control Equipment market is focused on enhancing efficiency, reducing environmental impact, and improving operational reliability. Manufacturers are introducing advanced shale shakers with improved screen designs for finer cuttings removal and increased throughput. Innovations in centrifuge technology are yielding more precise separation capabilities, enabling better fluid reclamation and waste reduction. The development of intelligent degassers with enhanced gas removal efficiency and automated monitoring systems is also a key trend. These advancements offer competitive advantages by lowering operational costs, minimizing fluid loss, and ensuring compliance with stringent environmental regulations.
Report Scope & Segmentation Analysis
This report meticulously analyzes the Solid Control Equipment market across various segments. The Type segmentation includes Shale Shaker, Desander, Desilter, Vacuum Degasser, Centrifuge, and Other Types, each with specific applications and market dynamics. Growth projections and market sizes are detailed for each type, reflecting their distinct roles in the solids control process. The Location of Deployment segmentation distinguishes between Onshore and Offshore operations, recognizing the unique operational challenges and requirements of each. The report provides detailed analysis of market sizes and competitive dynamics within these deployment locations.
Key Drivers of Solid Control Equipment Market Growth
The growth of the Solid Control Equipment market is propelled by several critical factors. Firstly, the sustained global demand for oil and natural gas necessitates efficient and cost-effective drilling operations, where solids control is paramount. Secondly, increasingly stringent environmental regulations worldwide are mandating better waste management and pollution control in drilling activities, driving the adoption of advanced solids control equipment. Technological advancements, such as the development of more efficient shale shakers, centrifuges, and degassers, are also key drivers, offering improved performance and cost savings. Furthermore, the ongoing expansion of oil and gas exploration in challenging environments, both onshore and offshore, creates a consistent need for reliable solids control solutions. The economic policies promoting domestic energy production in many nations also contribute to market expansion.
Challenges in the Solid Control Equipment Market Sector
Despite robust growth prospects, the Solid Control Equipment market faces several challenges. Volatility in oil prices can directly impact upstream spending, leading to reduced investment in new equipment. Intense competition among manufacturers, particularly from low-cost providers in emerging economies, can put pressure on profit margins. Furthermore, the implementation of complex and ever-evolving environmental regulations can pose compliance challenges and increase operational costs for end-users. Supply chain disruptions, as experienced globally in recent years, can also affect the availability and cost of raw materials and components, impacting production timelines and pricing. The inherent complexity of some advanced solids control systems may also require specialized training for operation and maintenance, presenting a hurdle for some operators.
Emerging Opportunities in Solid Control Equipment Market
Significant emerging opportunities exist within the Solid Control Equipment market. The growing focus on environmental sustainability and the circular economy is driving demand for equipment that maximizes fluid recovery and minimizes waste generation. The expansion of offshore exploration, particularly in deepwater and Arctic regions, presents a substantial opportunity for specialized and robust solids control solutions. Digitalization and the adoption of Industry 4.0 technologies are creating opportunities for manufacturers to offer smart, connected equipment with advanced analytics for predictive maintenance and operational optimization. Furthermore, the increasing emphasis on cost reduction in drilling operations is creating a demand for more efficient and integrated solids control systems that offer a lower total cost of ownership. The development of tailored solutions for specific geological formations and drilling challenges also represents a promising avenue.
Leading Players in the Solid Control Equipment Market Market
- GN Solids Control
- Derrick Corporation
- China Petroleum Technology & Development Corporation (CPTDC)
- Weatherford International Plc
- KES Energy Equipment Manufacturing Hebei Co Ltd
- KOSUN Machinery Co Ltd
- Baker Hughes Company
- Halliburton Company
- ORS International Ltd
- Schlumberger Limited
Key Developments in Solid Control Equipment Market Industry
- January 2023: Sarawak Shell Berhad awarded SLB a long-term integrated drilling services (LTIDS) contract for the exploration and development of offshore wells. The LTIDS will deliver solutions via technology, synergy, and simplification of processes across multiple business lines with a contract scope that encompasses drilling services and products inclusive of drilling and measurement, electrical wireline, drilling fluids, solids control, cementing, casing drilling, bits, mud logging, and management of third-party subcontractors.
- November 2022: Abu Dhabi National Oil Company (ADNOC) announced the award of three framework agreements valued at USD 4 billion for integrated drilling fluids services (IDFS) to support the continuous expansion of its lower-cost and lower-carbon-intensive production capacity as it responds to growing global demand for energy. Some of these services include products, engineering, technical laboratory support, filtration equipment, and solid control equipment.
Strategic Outlook for Solid Control Equipment Market Market
The strategic outlook for the Solid Control Equipment market is overwhelmingly positive, driven by the foundational role these systems play in efficient and environmentally responsible oil and gas operations. The increasing global energy demand ensures sustained activity in exploration and production, directly translating to a persistent need for solids control solutions. Key growth catalysts include the continued technological evolution of drilling techniques, which demand increasingly sophisticated methods for cuttings and fluid management. The global push towards stricter environmental regulations will further accelerate the adoption of advanced solids control equipment as operators seek to minimize waste and environmental impact. Companies that can innovate with smart, automated, and highly efficient solids control systems, while also demonstrating a commitment to sustainability, will be best positioned for long-term success. The strategic importance of these solutions in optimizing drilling economics and ensuring regulatory compliance will continue to drive market expansion and investment.
Solid Control Equipment Market Segmentation
-
1. Type
- 1.1. Shale Shaker
- 1.2. Desander
- 1.3. Desilter
- 1.4. Vacuum Degasser
- 1.5. Centrifuge
- 1.6. Other Types
-
2. Location of Deployment
- 2.1. Onshore
- 2.2. Offshore
Solid Control Equipment Market Segmentation By Geography
-
1. North America
- 1.1. United States
- 1.2. Canada
- 1.3. Rest of North America
-
2. Asia Pacific
- 2.1. China
- 2.2. India
- 2.3. Australia
- 2.4. Japan
- 2.5. Rest of Asia Pacific
-
3. Europe
- 3.1. Germany
- 3.2. France
- 3.3. United Kingdom
- 3.4. Italy
- 3.5. Rest of Europe
-
4. South America
- 4.1. Brazil
- 4.2. Argentina
- 4.3. Columbia
- 4.4. Rest of South America
-
5. Middle East and Africa
- 5.1. Saudi Arabia
- 5.2. United Arab Emirates
- 5.3. South Africa
- 5.4. Rest of Middle East and Africa
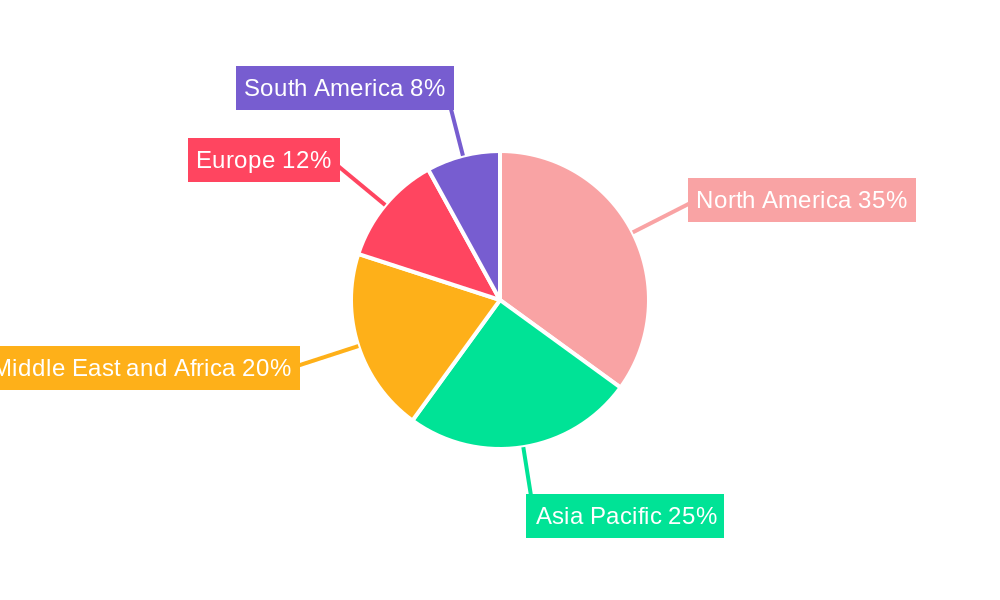
Solid Control Equipment Market Regional Market Share
Geographic Coverage of Solid Control Equipment Market
Solid Control Equipment Market REPORT HIGHLIGHTS
| Aspects | Details |
|---|---|
| Study Period | 2020-2034 |
| Base Year | 2025 |
| Estimated Year | 2026 |
| Forecast Period | 2026-2034 |
| Historical Period | 2020-2025 |
| Growth Rate | CAGR of 7.8% from 2020-2034 |
| Segmentation |
|
Table of Contents
- 1. Introduction
- 1.1. Research Scope
- 1.2. Market Segmentation
- 1.3. Research Objective
- 1.4. Definitions and Assumptions
- 2. Executive Summary
- 2.1. Market Snapshot
- 3. Market Dynamics
- 3.1. Market Drivers
- 3.2. Market Restrains
- 3.3. Market Trends
- 3.4. Market Opportunities
- 4. Market Factor Analysis
- 4.1. Porters Five Forces
- 4.1.1. Bargaining Power of Suppliers
- 4.1.2. Bargaining Power of Buyers
- 4.1.3. Threat of New Entrants
- 4.1.4. Threat of Substitutes
- 4.1.5. Competitive Rivalry
- 4.2. PESTEL analysis
- 4.3. BCG Analysis
- 4.3.1. Stars (High Growth, High Market Share)
- 4.3.2. Cash Cows (Low Growth, High Market Share)
- 4.3.3. Question Mark (High Growth, Low Market Share)
- 4.3.4. Dogs (Low Growth, Low Market Share)
- 4.4. Ansoff Matrix Analysis
- 4.5. Supply Chain Analysis
- 4.6. Regulatory Landscape
- 4.7. Current Market Potential and Opportunity Assessment (TAM–SAM–SOM Framework)
- 4.8. RAX Analyst Note
- 4.1. Porters Five Forces
- 5. Market Analysis, Insights and Forecast 2021-2033
- 5.1. Market Analysis, Insights and Forecast - by Type
- 5.1.1. Shale Shaker
- 5.1.2. Desander
- 5.1.3. Desilter
- 5.1.4. Vacuum Degasser
- 5.1.5. Centrifuge
- 5.1.6. Other Types
- 5.2. Market Analysis, Insights and Forecast - by Location of Deployment
- 5.2.1. Onshore
- 5.2.2. Offshore
- 5.3. Market Analysis, Insights and Forecast - by Region
- 5.3.1. North America
- 5.3.2. Asia Pacific
- 5.3.3. Europe
- 5.3.4. South America
- 5.3.5. Middle East and Africa
- 5.1. Market Analysis, Insights and Forecast - by Type
- 6. Global Solid Control Equipment Market Analysis, Insights and Forecast, 2021-2033
- 6.1. Market Analysis, Insights and Forecast - by Type
- 6.1.1. Shale Shaker
- 6.1.2. Desander
- 6.1.3. Desilter
- 6.1.4. Vacuum Degasser
- 6.1.5. Centrifuge
- 6.1.6. Other Types
- 6.2. Market Analysis, Insights and Forecast - by Location of Deployment
- 6.2.1. Onshore
- 6.2.2. Offshore
- 6.1. Market Analysis, Insights and Forecast - by Type
- 7. North America Solid Control Equipment Market Analysis, Insights and Forecast, 2020-2032
- 7.1. Market Analysis, Insights and Forecast - by Type
- 7.1.1. Shale Shaker
- 7.1.2. Desander
- 7.1.3. Desilter
- 7.1.4. Vacuum Degasser
- 7.1.5. Centrifuge
- 7.1.6. Other Types
- 7.2. Market Analysis, Insights and Forecast - by Location of Deployment
- 7.2.1. Onshore
- 7.2.2. Offshore
- 7.1. Market Analysis, Insights and Forecast - by Type
- 8. Asia Pacific Solid Control Equipment Market Analysis, Insights and Forecast, 2020-2032
- 8.1. Market Analysis, Insights and Forecast - by Type
- 8.1.1. Shale Shaker
- 8.1.2. Desander
- 8.1.3. Desilter
- 8.1.4. Vacuum Degasser
- 8.1.5. Centrifuge
- 8.1.6. Other Types
- 8.2. Market Analysis, Insights and Forecast - by Location of Deployment
- 8.2.1. Onshore
- 8.2.2. Offshore
- 8.1. Market Analysis, Insights and Forecast - by Type
- 9. Europe Solid Control Equipment Market Analysis, Insights and Forecast, 2020-2032
- 9.1. Market Analysis, Insights and Forecast - by Type
- 9.1.1. Shale Shaker
- 9.1.2. Desander
- 9.1.3. Desilter
- 9.1.4. Vacuum Degasser
- 9.1.5. Centrifuge
- 9.1.6. Other Types
- 9.2. Market Analysis, Insights and Forecast - by Location of Deployment
- 9.2.1. Onshore
- 9.2.2. Offshore
- 9.1. Market Analysis, Insights and Forecast - by Type
- 10. South America Solid Control Equipment Market Analysis, Insights and Forecast, 2020-2032
- 10.1. Market Analysis, Insights and Forecast - by Type
- 10.1.1. Shale Shaker
- 10.1.2. Desander
- 10.1.3. Desilter
- 10.1.4. Vacuum Degasser
- 10.1.5. Centrifuge
- 10.1.6. Other Types
- 10.2. Market Analysis, Insights and Forecast - by Location of Deployment
- 10.2.1. Onshore
- 10.2.2. Offshore
- 10.1. Market Analysis, Insights and Forecast - by Type
- 11. Middle East and Africa Solid Control Equipment Market Analysis, Insights and Forecast, 2020-2032
- 11.1. Market Analysis, Insights and Forecast - by Type
- 11.1.1. Shale Shaker
- 11.1.2. Desander
- 11.1.3. Desilter
- 11.1.4. Vacuum Degasser
- 11.1.5. Centrifuge
- 11.1.6. Other Types
- 11.2. Market Analysis, Insights and Forecast - by Location of Deployment
- 11.2.1. Onshore
- 11.2.2. Offshore
- 11.1. Market Analysis, Insights and Forecast - by Type
- 12. Competitive Analysis
- 12.1. Company Profiles
- 12.1.1 GN Solids Control
- 12.1.1.1. Company Overview
- 12.1.1.2. Products
- 12.1.1.3. Company Financials
- 12.1.1.4. SWOT Analysis
- 12.1.2 Derrick Corporation
- 12.1.2.1. Company Overview
- 12.1.2.2. Products
- 12.1.2.3. Company Financials
- 12.1.2.4. SWOT Analysis
- 12.1.3 China Petroleum Technology & Development Corporation (CPTDC)
- 12.1.3.1. Company Overview
- 12.1.3.2. Products
- 12.1.3.3. Company Financials
- 12.1.3.4. SWOT Analysis
- 12.1.4 Weatherford International Plc
- 12.1.4.1. Company Overview
- 12.1.4.2. Products
- 12.1.4.3. Company Financials
- 12.1.4.4. SWOT Analysis
- 12.1.5 KES Energy Equipment Manufacturing Hebei Co Ltd
- 12.1.5.1. Company Overview
- 12.1.5.2. Products
- 12.1.5.3. Company Financials
- 12.1.5.4. SWOT Analysis
- 12.1.6 KOSUN Machinery Co Ltd
- 12.1.6.1. Company Overview
- 12.1.6.2. Products
- 12.1.6.3. Company Financials
- 12.1.6.4. SWOT Analysis
- 12.1.7 Baker Hughes Company
- 12.1.7.1. Company Overview
- 12.1.7.2. Products
- 12.1.7.3. Company Financials
- 12.1.7.4. SWOT Analysis
- 12.1.8 Halliburton Company
- 12.1.8.1. Company Overview
- 12.1.8.2. Products
- 12.1.8.3. Company Financials
- 12.1.8.4. SWOT Analysis
- 12.1.9 ORS International Ltd
- 12.1.9.1. Company Overview
- 12.1.9.2. Products
- 12.1.9.3. Company Financials
- 12.1.9.4. SWOT Analysis
- 12.1.10 Schlumberger Limited
- 12.1.10.1. Company Overview
- 12.1.10.2. Products
- 12.1.10.3. Company Financials
- 12.1.10.4. SWOT Analysis
- 12.1.1 GN Solids Control
- 12.2. Market Entropy
- 12.2.1 Company's Key Areas Served
- 12.2.2 Recent Developments
- 12.3. Company Market Share Analysis 2025
- 12.3.1 Top 5 Companies Market Share Analysis
- 12.3.2 Top 3 Companies Market Share Analysis
- 12.4. List of Potential Customers
- 13. Research Methodology
List of Figures
- Figure 1: Global Solid Control Equipment Market Revenue Breakdown (billion, %) by Region 2025 & 2033
- Figure 2: Global Solid Control Equipment Market Volume Breakdown (K Unit, %) by Region 2025 & 2033
- Figure 3: North America Solid Control Equipment Market Revenue (billion), by Type 2025 & 2033
- Figure 4: North America Solid Control Equipment Market Volume (K Unit), by Type 2025 & 2033
- Figure 5: North America Solid Control Equipment Market Revenue Share (%), by Type 2025 & 2033
- Figure 6: North America Solid Control Equipment Market Volume Share (%), by Type 2025 & 2033
- Figure 7: North America Solid Control Equipment Market Revenue (billion), by Location of Deployment 2025 & 2033
- Figure 8: North America Solid Control Equipment Market Volume (K Unit), by Location of Deployment 2025 & 2033
- Figure 9: North America Solid Control Equipment Market Revenue Share (%), by Location of Deployment 2025 & 2033
- Figure 10: North America Solid Control Equipment Market Volume Share (%), by Location of Deployment 2025 & 2033
- Figure 11: North America Solid Control Equipment Market Revenue (billion), by Country 2025 & 2033
- Figure 12: North America Solid Control Equipment Market Volume (K Unit), by Country 2025 & 2033
- Figure 13: North America Solid Control Equipment Market Revenue Share (%), by Country 2025 & 2033
- Figure 14: North America Solid Control Equipment Market Volume Share (%), by Country 2025 & 2033
- Figure 15: Asia Pacific Solid Control Equipment Market Revenue (billion), by Type 2025 & 2033
- Figure 16: Asia Pacific Solid Control Equipment Market Volume (K Unit), by Type 2025 & 2033
- Figure 17: Asia Pacific Solid Control Equipment Market Revenue Share (%), by Type 2025 & 2033
- Figure 18: Asia Pacific Solid Control Equipment Market Volume Share (%), by Type 2025 & 2033
- Figure 19: Asia Pacific Solid Control Equipment Market Revenue (billion), by Location of Deployment 2025 & 2033
- Figure 20: Asia Pacific Solid Control Equipment Market Volume (K Unit), by Location of Deployment 2025 & 2033
- Figure 21: Asia Pacific Solid Control Equipment Market Revenue Share (%), by Location of Deployment 2025 & 2033
- Figure 22: Asia Pacific Solid Control Equipment Market Volume Share (%), by Location of Deployment 2025 & 2033
- Figure 23: Asia Pacific Solid Control Equipment Market Revenue (billion), by Country 2025 & 2033
- Figure 24: Asia Pacific Solid Control Equipment Market Volume (K Unit), by Country 2025 & 2033
- Figure 25: Asia Pacific Solid Control Equipment Market Revenue Share (%), by Country 2025 & 2033
- Figure 26: Asia Pacific Solid Control Equipment Market Volume Share (%), by Country 2025 & 2033
- Figure 27: Europe Solid Control Equipment Market Revenue (billion), by Type 2025 & 2033
- Figure 28: Europe Solid Control Equipment Market Volume (K Unit), by Type 2025 & 2033
- Figure 29: Europe Solid Control Equipment Market Revenue Share (%), by Type 2025 & 2033
- Figure 30: Europe Solid Control Equipment Market Volume Share (%), by Type 2025 & 2033
- Figure 31: Europe Solid Control Equipment Market Revenue (billion), by Location of Deployment 2025 & 2033
- Figure 32: Europe Solid Control Equipment Market Volume (K Unit), by Location of Deployment 2025 & 2033
- Figure 33: Europe Solid Control Equipment Market Revenue Share (%), by Location of Deployment 2025 & 2033
- Figure 34: Europe Solid Control Equipment Market Volume Share (%), by Location of Deployment 2025 & 2033
- Figure 35: Europe Solid Control Equipment Market Revenue (billion), by Country 2025 & 2033
- Figure 36: Europe Solid Control Equipment Market Volume (K Unit), by Country 2025 & 2033
- Figure 37: Europe Solid Control Equipment Market Revenue Share (%), by Country 2025 & 2033
- Figure 38: Europe Solid Control Equipment Market Volume Share (%), by Country 2025 & 2033
- Figure 39: South America Solid Control Equipment Market Revenue (billion), by Type 2025 & 2033
- Figure 40: South America Solid Control Equipment Market Volume (K Unit), by Type 2025 & 2033
- Figure 41: South America Solid Control Equipment Market Revenue Share (%), by Type 2025 & 2033
- Figure 42: South America Solid Control Equipment Market Volume Share (%), by Type 2025 & 2033
- Figure 43: South America Solid Control Equipment Market Revenue (billion), by Location of Deployment 2025 & 2033
- Figure 44: South America Solid Control Equipment Market Volume (K Unit), by Location of Deployment 2025 & 2033
- Figure 45: South America Solid Control Equipment Market Revenue Share (%), by Location of Deployment 2025 & 2033
- Figure 46: South America Solid Control Equipment Market Volume Share (%), by Location of Deployment 2025 & 2033
- Figure 47: South America Solid Control Equipment Market Revenue (billion), by Country 2025 & 2033
- Figure 48: South America Solid Control Equipment Market Volume (K Unit), by Country 2025 & 2033
- Figure 49: South America Solid Control Equipment Market Revenue Share (%), by Country 2025 & 2033
- Figure 50: South America Solid Control Equipment Market Volume Share (%), by Country 2025 & 2033
- Figure 51: Middle East and Africa Solid Control Equipment Market Revenue (billion), by Type 2025 & 2033
- Figure 52: Middle East and Africa Solid Control Equipment Market Volume (K Unit), by Type 2025 & 2033
- Figure 53: Middle East and Africa Solid Control Equipment Market Revenue Share (%), by Type 2025 & 2033
- Figure 54: Middle East and Africa Solid Control Equipment Market Volume Share (%), by Type 2025 & 2033
- Figure 55: Middle East and Africa Solid Control Equipment Market Revenue (billion), by Location of Deployment 2025 & 2033
- Figure 56: Middle East and Africa Solid Control Equipment Market Volume (K Unit), by Location of Deployment 2025 & 2033
- Figure 57: Middle East and Africa Solid Control Equipment Market Revenue Share (%), by Location of Deployment 2025 & 2033
- Figure 58: Middle East and Africa Solid Control Equipment Market Volume Share (%), by Location of Deployment 2025 & 2033
- Figure 59: Middle East and Africa Solid Control Equipment Market Revenue (billion), by Country 2025 & 2033
- Figure 60: Middle East and Africa Solid Control Equipment Market Volume (K Unit), by Country 2025 & 2033
- Figure 61: Middle East and Africa Solid Control Equipment Market Revenue Share (%), by Country 2025 & 2033
- Figure 62: Middle East and Africa Solid Control Equipment Market Volume Share (%), by Country 2025 & 2033
List of Tables
- Table 1: Global Solid Control Equipment Market Revenue billion Forecast, by Type 2020 & 2033
- Table 2: Global Solid Control Equipment Market Volume K Unit Forecast, by Type 2020 & 2033
- Table 3: Global Solid Control Equipment Market Revenue billion Forecast, by Location of Deployment 2020 & 2033
- Table 4: Global Solid Control Equipment Market Volume K Unit Forecast, by Location of Deployment 2020 & 2033
- Table 5: Global Solid Control Equipment Market Revenue billion Forecast, by Region 2020 & 2033
- Table 6: Global Solid Control Equipment Market Volume K Unit Forecast, by Region 2020 & 2033
- Table 7: Global Solid Control Equipment Market Revenue billion Forecast, by Type 2020 & 2033
- Table 8: Global Solid Control Equipment Market Volume K Unit Forecast, by Type 2020 & 2033
- Table 9: Global Solid Control Equipment Market Revenue billion Forecast, by Location of Deployment 2020 & 2033
- Table 10: Global Solid Control Equipment Market Volume K Unit Forecast, by Location of Deployment 2020 & 2033
- Table 11: Global Solid Control Equipment Market Revenue billion Forecast, by Country 2020 & 2033
- Table 12: Global Solid Control Equipment Market Volume K Unit Forecast, by Country 2020 & 2033
- Table 13: United States Solid Control Equipment Market Revenue (billion) Forecast, by Application 2020 & 2033
- Table 14: United States Solid Control Equipment Market Volume (K Unit) Forecast, by Application 2020 & 2033
- Table 15: Canada Solid Control Equipment Market Revenue (billion) Forecast, by Application 2020 & 2033
- Table 16: Canada Solid Control Equipment Market Volume (K Unit) Forecast, by Application 2020 & 2033
- Table 17: Rest of North America Solid Control Equipment Market Revenue (billion) Forecast, by Application 2020 & 2033
- Table 18: Rest of North America Solid Control Equipment Market Volume (K Unit) Forecast, by Application 2020 & 2033
- Table 19: Global Solid Control Equipment Market Revenue billion Forecast, by Type 2020 & 2033
- Table 20: Global Solid Control Equipment Market Volume K Unit Forecast, by Type 2020 & 2033
- Table 21: Global Solid Control Equipment Market Revenue billion Forecast, by Location of Deployment 2020 & 2033
- Table 22: Global Solid Control Equipment Market Volume K Unit Forecast, by Location of Deployment 2020 & 2033
- Table 23: Global Solid Control Equipment Market Revenue billion Forecast, by Country 2020 & 2033
- Table 24: Global Solid Control Equipment Market Volume K Unit Forecast, by Country 2020 & 2033
- Table 25: China Solid Control Equipment Market Revenue (billion) Forecast, by Application 2020 & 2033
- Table 26: China Solid Control Equipment Market Volume (K Unit) Forecast, by Application 2020 & 2033
- Table 27: India Solid Control Equipment Market Revenue (billion) Forecast, by Application 2020 & 2033
- Table 28: India Solid Control Equipment Market Volume (K Unit) Forecast, by Application 2020 & 2033
- Table 29: Australia Solid Control Equipment Market Revenue (billion) Forecast, by Application 2020 & 2033
- Table 30: Australia Solid Control Equipment Market Volume (K Unit) Forecast, by Application 2020 & 2033
- Table 31: Japan Solid Control Equipment Market Revenue (billion) Forecast, by Application 2020 & 2033
- Table 32: Japan Solid Control Equipment Market Volume (K Unit) Forecast, by Application 2020 & 2033
- Table 33: Rest of Asia Pacific Solid Control Equipment Market Revenue (billion) Forecast, by Application 2020 & 2033
- Table 34: Rest of Asia Pacific Solid Control Equipment Market Volume (K Unit) Forecast, by Application 2020 & 2033
- Table 35: Global Solid Control Equipment Market Revenue billion Forecast, by Type 2020 & 2033
- Table 36: Global Solid Control Equipment Market Volume K Unit Forecast, by Type 2020 & 2033
- Table 37: Global Solid Control Equipment Market Revenue billion Forecast, by Location of Deployment 2020 & 2033
- Table 38: Global Solid Control Equipment Market Volume K Unit Forecast, by Location of Deployment 2020 & 2033
- Table 39: Global Solid Control Equipment Market Revenue billion Forecast, by Country 2020 & 2033
- Table 40: Global Solid Control Equipment Market Volume K Unit Forecast, by Country 2020 & 2033
- Table 41: Germany Solid Control Equipment Market Revenue (billion) Forecast, by Application 2020 & 2033
- Table 42: Germany Solid Control Equipment Market Volume (K Unit) Forecast, by Application 2020 & 2033
- Table 43: France Solid Control Equipment Market Revenue (billion) Forecast, by Application 2020 & 2033
- Table 44: France Solid Control Equipment Market Volume (K Unit) Forecast, by Application 2020 & 2033
- Table 45: United Kingdom Solid Control Equipment Market Revenue (billion) Forecast, by Application 2020 & 2033
- Table 46: United Kingdom Solid Control Equipment Market Volume (K Unit) Forecast, by Application 2020 & 2033
- Table 47: Italy Solid Control Equipment Market Revenue (billion) Forecast, by Application 2020 & 2033
- Table 48: Italy Solid Control Equipment Market Volume (K Unit) Forecast, by Application 2020 & 2033
- Table 49: Rest of Europe Solid Control Equipment Market Revenue (billion) Forecast, by Application 2020 & 2033
- Table 50: Rest of Europe Solid Control Equipment Market Volume (K Unit) Forecast, by Application 2020 & 2033
- Table 51: Global Solid Control Equipment Market Revenue billion Forecast, by Type 2020 & 2033
- Table 52: Global Solid Control Equipment Market Volume K Unit Forecast, by Type 2020 & 2033
- Table 53: Global Solid Control Equipment Market Revenue billion Forecast, by Location of Deployment 2020 & 2033
- Table 54: Global Solid Control Equipment Market Volume K Unit Forecast, by Location of Deployment 2020 & 2033
- Table 55: Global Solid Control Equipment Market Revenue billion Forecast, by Country 2020 & 2033
- Table 56: Global Solid Control Equipment Market Volume K Unit Forecast, by Country 2020 & 2033
- Table 57: Brazil Solid Control Equipment Market Revenue (billion) Forecast, by Application 2020 & 2033
- Table 58: Brazil Solid Control Equipment Market Volume (K Unit) Forecast, by Application 2020 & 2033
- Table 59: Argentina Solid Control Equipment Market Revenue (billion) Forecast, by Application 2020 & 2033
- Table 60: Argentina Solid Control Equipment Market Volume (K Unit) Forecast, by Application 2020 & 2033
- Table 61: Columbia Solid Control Equipment Market Revenue (billion) Forecast, by Application 2020 & 2033
- Table 62: Columbia Solid Control Equipment Market Volume (K Unit) Forecast, by Application 2020 & 2033
- Table 63: Rest of South America Solid Control Equipment Market Revenue (billion) Forecast, by Application 2020 & 2033
- Table 64: Rest of South America Solid Control Equipment Market Volume (K Unit) Forecast, by Application 2020 & 2033
- Table 65: Global Solid Control Equipment Market Revenue billion Forecast, by Type 2020 & 2033
- Table 66: Global Solid Control Equipment Market Volume K Unit Forecast, by Type 2020 & 2033
- Table 67: Global Solid Control Equipment Market Revenue billion Forecast, by Location of Deployment 2020 & 2033
- Table 68: Global Solid Control Equipment Market Volume K Unit Forecast, by Location of Deployment 2020 & 2033
- Table 69: Global Solid Control Equipment Market Revenue billion Forecast, by Country 2020 & 2033
- Table 70: Global Solid Control Equipment Market Volume K Unit Forecast, by Country 2020 & 2033
- Table 71: Saudi Arabia Solid Control Equipment Market Revenue (billion) Forecast, by Application 2020 & 2033
- Table 72: Saudi Arabia Solid Control Equipment Market Volume (K Unit) Forecast, by Application 2020 & 2033
- Table 73: United Arab Emirates Solid Control Equipment Market Revenue (billion) Forecast, by Application 2020 & 2033
- Table 74: United Arab Emirates Solid Control Equipment Market Volume (K Unit) Forecast, by Application 2020 & 2033
- Table 75: South Africa Solid Control Equipment Market Revenue (billion) Forecast, by Application 2020 & 2033
- Table 76: South Africa Solid Control Equipment Market Volume (K Unit) Forecast, by Application 2020 & 2033
- Table 77: Rest of Middle East and Africa Solid Control Equipment Market Revenue (billion) Forecast, by Application 2020 & 2033
- Table 78: Rest of Middle East and Africa Solid Control Equipment Market Volume (K Unit) Forecast, by Application 2020 & 2033
Frequently Asked Questions
1. What is the projected Compound Annual Growth Rate (CAGR) of the Solid Control Equipment Market?
The projected CAGR is approximately 7.8%.
2. Which companies are prominent players in the Solid Control Equipment Market?
Key companies in the market include GN Solids Control, Derrick Corporation, China Petroleum Technology & Development Corporation (CPTDC), Weatherford International Plc, KES Energy Equipment Manufacturing Hebei Co Ltd, KOSUN Machinery Co Ltd, Baker Hughes Company, Halliburton Company, ORS International Ltd, Schlumberger Limited.
3. What are the main segments of the Solid Control Equipment Market?
The market segments include Type, Location of Deployment.
4. Can you provide details about the market size?
The market size is estimated to be USD 1.4 billion as of 2022.
5. What are some drivers contributing to market growth?
4.; Focus On Unconventional Resources4.; Global Energy Demand And Exploration Activities.
6. What are the notable trends driving market growth?
Offshore Sector to Witness Significant Growth.
7. Are there any restraints impacting market growth?
4.; High Implementation Costs.
8. Can you provide examples of recent developments in the market?
January 2023: Sarawak Shell Berhad awarded SLB a long-term integrated drilling services (LTIDS) contract for the exploration and development of offshore wells. The LTIDS will deliver solutions via technology, synergy, and simplification of processes across multiple business lines with a contract scope that encompasses drilling services and products inclusive of drilling and measurement, electrical wireline, drilling fluids, solids control, cementing, casing drilling, bits, mud logging, and management of third-party subcontractors.
9. What pricing options are available for accessing the report?
Pricing options include single-user, multi-user, and enterprise licenses priced at USD 4750, USD 5250, and USD 8750 respectively.
10. Is the market size provided in terms of value or volume?
The market size is provided in terms of value, measured in billion and volume, measured in K Unit.
11. Are there any specific market keywords associated with the report?
Yes, the market keyword associated with the report is "Solid Control Equipment Market," which aids in identifying and referencing the specific market segment covered.
12. How do I determine which pricing option suits my needs best?
The pricing options vary based on user requirements and access needs. Individual users may opt for single-user licenses, while businesses requiring broader access may choose multi-user or enterprise licenses for cost-effective access to the report.
13. Are there any additional resources or data provided in the Solid Control Equipment Market report?
While the report offers comprehensive insights, it's advisable to review the specific contents or supplementary materials provided to ascertain if additional resources or data are available.
14. How can I stay updated on further developments or reports in the Solid Control Equipment Market?
To stay informed about further developments, trends, and reports in the Solid Control Equipment Market, consider subscribing to industry newsletters, following relevant companies and organizations, or regularly checking reputable industry news sources and publications.
Methodology
Step 1 - Identification of Relevant Samples Size from Population Database


Step 2 - Approaches for Defining Global Market Size (Value, Volume* & Price*)

Note*: In applicable scenarios
Step 3 - Data Sources
Primary Research
- Web Analytics
- Survey Reports
- Research Institute
- Latest Research Reports
- Opinion Leaders
Secondary Research
- Annual Reports
- White Paper
- Latest Press Release
- Industry Association
- Paid Database
- Investor Presentations

Step 4 - Data Triangulation
Involves using different sources of information in order to increase the validity of a study
These sources are likely to be stakeholders in a program - participants, other researchers, program staff, other community members, and so on.
Then we put all data in single framework & apply various statistical tools to find out the dynamic on the market.
During the analysis stage, feedback from the stakeholder groups would be compared to determine areas of agreement as well as areas of divergence