
Key Insights
The Southeast Asia snack bar market, valued at $1200 million in 2025, is projected to experience robust growth, driven by several key factors. Rising health consciousness is fueling demand for nutritious and functional snack bars, particularly cereal and energy bars, among health-conscious consumers. The increasing prevalence of busy lifestyles and on-the-go consumption patterns further contribute to this trend. E-commerce expansion is significantly impacting distribution channels, offering convenient access to a wider range of snack bar options. Major players like Nestle SA, General Mills Inc., and KIND LLC are leveraging this growth by investing in product innovation and targeted marketing campaigns, focusing on diverse flavors, ingredients, and health benefits. While price sensitivity remains a restraint, particularly in certain segments of the market, the overall market trajectory suggests strong growth potential. Competition is fierce, necessitating continuous innovation and brand building to capture market share. The Asia-Pacific region, specifically countries like China, India, and Japan, present significant opportunities due to their large populations and increasing disposable incomes. Future growth will likely be shaped by evolving consumer preferences towards organic, sustainably sourced ingredients and personalized nutrition solutions.
The market segmentation reveals a dynamic landscape. While hypermarkets/supermarkets currently hold the largest share of the distribution channels, online stores are rapidly gaining traction, reflecting the ongoing shift towards e-commerce. Within product types, cereal and energy bars dominate, showcasing the preference for functional and health-conscious snacking options. The "other snack bars" segment presents opportunities for niche players to introduce innovative products catering to specific dietary needs and preferences. Continued expansion of e-commerce platforms and the rise of direct-to-consumer brands are anticipated to reshape the competitive landscape in the coming years. The projected CAGR of 5.19% suggests consistent growth through 2033, although specific growth rates will fluctuate based on economic conditions and evolving consumer trends in individual Southeast Asian countries. Sustained growth hinges on the ability of companies to cater to the increasing demand for convenience, health, and value for money.
South East Asia Snack Bars Industry: A Comprehensive Market Report (2019-2033)
This comprehensive report provides an in-depth analysis of the South East Asia snack bars industry, offering valuable insights for businesses, investors, and stakeholders. The study covers the period from 2019 to 2033, with 2025 as the base year and estimated year. The report utilizes rigorous data analysis to forecast market trends and growth opportunities across various segments. The total market size in 2025 is estimated at $XX Million and is projected to reach $XX Million by 2033, exhibiting a CAGR of XX% during the forecast period (2025-2033).
South East Asia Snack Bars Industry Market Concentration & Innovation
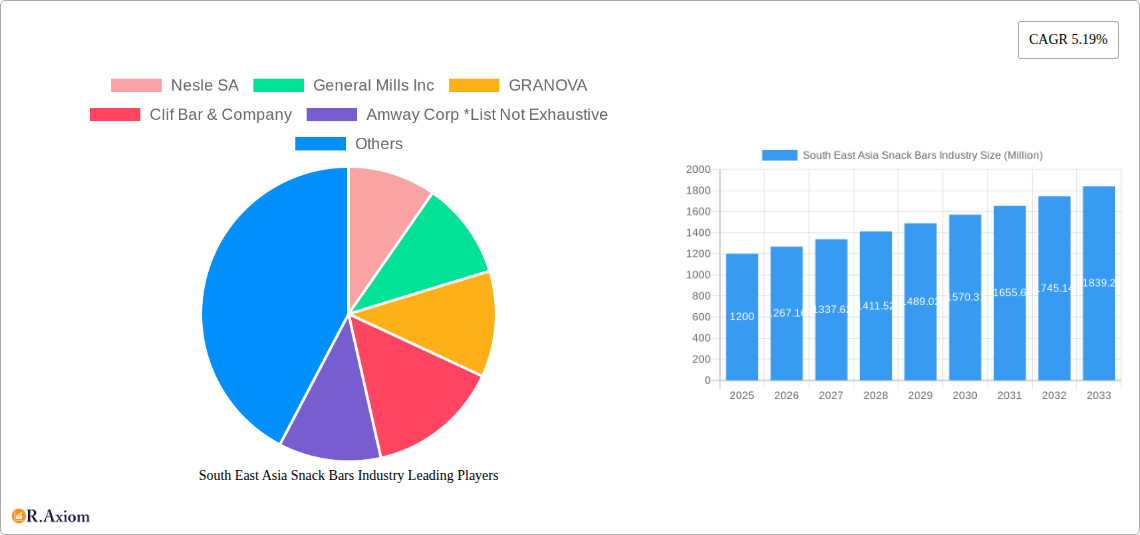
The South East Asia snack bar market is characterized by a moderately concentrated landscape, with key players like Nestlé SA, General Mills Inc, and Kellogg Company holding significant market share. However, the presence of numerous regional and smaller brands indicates a competitive environment. Market share data for 2025 indicates Nestlé SA holds approximately XX% market share, followed by General Mills Inc with XX%, and Kellogg Company with XX%. The remaining market share is distributed among other players, including Granola, Clif Bar & Company, Amway Corp, KIND LLC, The Hut.com Limited (Myprotein), General Nutrition Centers Inc, and PRISTINE (Yogood). Innovation is a key driver, with new product launches featuring functional ingredients (e.g., protein, fiber, probiotics) and innovative flavors catering to evolving consumer preferences.
Mergers and acquisitions (M&A) activity has been relatively moderate in recent years, with deal values totaling approximately $XX Million in 2024. These activities are primarily focused on expanding product portfolios and geographical reach. Regulatory frameworks, particularly those concerning sugar and fat content, are increasingly influencing product development and marketing strategies. Substitutes such as fresh fruits, yogurt, and other confectionery items pose a competitive challenge. Growing health consciousness among consumers is driving demand for healthier snack bars, presenting both opportunities and challenges for existing players.
South East Asia Snack Bars Industry Industry Trends & Insights
The South East Asia snack bars market is experiencing robust growth fueled by several factors. Rising disposable incomes, increasing urbanization, and changing lifestyles are contributing to higher snack consumption. The market's growth is further propelled by the increasing preference for convenient and portable food options, particularly among young adults and busy professionals. Technological advancements in food processing and packaging are facilitating the development of innovative products with extended shelf life and enhanced nutritional profiles. The market is witnessing a surge in demand for functional snack bars that cater to specific dietary needs and health goals, such as high-protein bars for athletes or gluten-free options for consumers with dietary restrictions. However, intense competition and fluctuating raw material prices pose significant challenges.
Consumer preferences are shifting towards healthier and more natural ingredients, leading to increased demand for organic and minimally processed snack bars. The growing popularity of online retail channels is also reshaping the market landscape, offering new opportunities for direct-to-consumer brands. The competitive dynamics are marked by both established multinational corporations and emerging local players vying for market share. This leads to price wars and promotional campaigns that impact overall profitability.
Dominant Markets & Segments in South East Asia Snack Bars Industry
Within South East Asia, Indonesia and the Philippines represent the most significant markets for snack bars, driven by large populations and rising disposable incomes. The hypermarket/supermarket segment dominates the distribution channel landscape, accounting for approximately XX% of total sales in 2025. However, online stores are experiencing rapid growth, with a projected CAGR of XX% during the forecast period.
- Key Drivers for Indonesia: Strong economic growth, expanding middle class, and increasing urbanization.
- Key Drivers for Philippines: Rising disposable incomes, increasing health consciousness, and growing popularity of convenient food options.
The energy bar segment is the leading product type, driven by increasing health and fitness consciousness among consumers. However, the cereal bar segment also shows considerable promise, with innovations in taste and functionality fueling its growth.
- Hypermarket/Supermarket: Wide product availability and established distribution networks.
- Online Stores: Growing convenience and accessibility for consumers.
- Convenience Stores: Impulsive purchases and strategic locations drive sales.
- Other Distribution Channels: These include direct sales, traditional markets, and specialized retailers.
South East Asia Snack Bars Industry Product Developments
Recent product innovations focus on incorporating functional ingredients like protein, fiber, and vitamins to enhance nutritional value. There’s a significant trend towards organic and natural ingredients, as well as innovative flavor combinations to appeal to diverse taste preferences. Manufacturers are also focusing on sustainable packaging options to meet growing environmental concerns. These innovations are enhancing the competitive advantage of many brands by catering to the changing needs and preferences of health-conscious consumers.
Report Scope & Segmentation Analysis
This report segments the South East Asia snack bars market by distribution channel (Hypermarket/Supermarket, Online Stores, Convenience Stores, Other Distribution Channels) and by product type (Cereal Bar, Energy Bar, Other Snack Bars). Each segment's growth trajectory, market size, and competitive landscape are analyzed in detail. For example, the online stores segment is anticipated to experience the fastest growth, while the hypermarket/supermarket segment continues to dominate in terms of market share. Similarly, the energy bar segment holds a significant share, driven by the health and fitness trend, while other snack bars offer substantial growth potential through product diversification. The report provides detailed insights into each segment's dynamics, enabling informed business decisions.
Key Drivers of South East Asia Snack Bars Industry Growth
The South East Asia snack bars industry is driven by several key factors. Rising disposable incomes, particularly within the burgeoning middle class, are enabling greater spending on convenience foods. Increasing urbanization leads to busier lifestyles, boosting demand for portable and ready-to-eat snack options. The growing awareness of health and wellness is fueling demand for functional snack bars that provide nutritional benefits. Government initiatives promoting healthy eating habits also contribute to market expansion.
Challenges in the South East Asia Snack Bars Industry Sector
Significant challenges face the South East Asia snack bars industry. Intense competition among established and emerging players puts downward pressure on prices. Fluctuations in raw material costs, particularly for key ingredients like nuts and grains, impact profitability. Stricter government regulations on sugar and fat content require manufacturers to reformulate products, adding to costs. Supply chain disruptions can lead to production delays and shortages, affecting market supply.
Emerging Opportunities in South East Asia Snack Bars Industry
Several emerging opportunities exist for growth in the South East Asia snack bars industry. The expansion of e-commerce provides new avenues for reaching consumers directly. The growing demand for customized and personalized nutrition solutions is creating opportunities for tailored snack bar offerings. There is increasing potential in niche markets such as organic, vegan, and gluten-free snack bars.
Leading Players in the South East Asia Snack Bars Industry Market
- Nestlé SA
- General Mills Inc
- Granola
- Clif Bar & Company
- Amway Corp
- KIND LLC
- The Hut.com Limited (Myprotein)
- Kellogg Company
- General Nutrition Centers Inc
- PRISTINE (Yogood)
Key Developments in South East Asia Snack Bars Industry Industry
- 2022 Q3: Nestlé SA launched a new range of protein-rich snack bars in Indonesia.
- 2023 Q1: General Mills Inc. acquired a local snack bar manufacturer in the Philippines, expanding its market presence.
- 2024 Q2: Several major players announced commitments to sustainable packaging for their snack bar products.
- 2025 Q1: New government regulations on sugar content in snack bars came into effect in several South East Asian countries.
Strategic Outlook for South East Asia Snack Bars Industry Market
The South East Asia snack bars market is poised for continued growth driven by factors such as rising disposable incomes, evolving consumer preferences, and technological advancements. The focus on healthier and more convenient snack options, combined with increased investment in product innovation and sustainable practices, presents significant growth opportunities. Companies that successfully adapt to evolving consumer demands and embrace sustainable practices will be well-positioned to capture a larger market share in the years to come.
South East Asia Snack Bars Industry Segmentation
-
1. Product Type
-
1.1. Cereal Bar
- 1.1.1. Granola/Muesli Bars
- 1.1.2. Other Cereal Bars
- 1.2. Energy Bar
- 1.3. Other Snack Bars
-
1.1. Cereal Bar
-
2. Distribution Channel
- 2.1. Hypermarket/Supermarket
- 2.2. Online Stores
- 2.3. Convenience Stores
- 2.4. Other Distribution Channels
-
3. Countires
- 3.1. Indonesia
- 3.2. Malaysia
- 3.3. Myanmar
- 3.4. Philippines
- 3.5. Singapore
- 3.6. Thailand
- 3.7. Vietnam
- 3.8. Rest of South East Asia
South East Asia Snack Bars Industry Segmentation By Geography
-
1. South East Asia
- 1.1. Indonesia
- 1.2. Malaysia
- 1.3. Singapore
- 1.4. Thailand
- 1.5. Vietnam
- 1.6. Philippines
- 1.7. Myanmar
- 1.8. Cambodia
- 1.9. Laos
South East Asia Snack Bars Industry REPORT HIGHLIGHTS
| Aspects | Details |
|---|---|
| Study Period | 2019-2033 |
| Base Year | 2024 |
| Estimated Year | 2025 |
| Forecast Period | 2025-2033 |
| Historical Period | 2019-2024 |
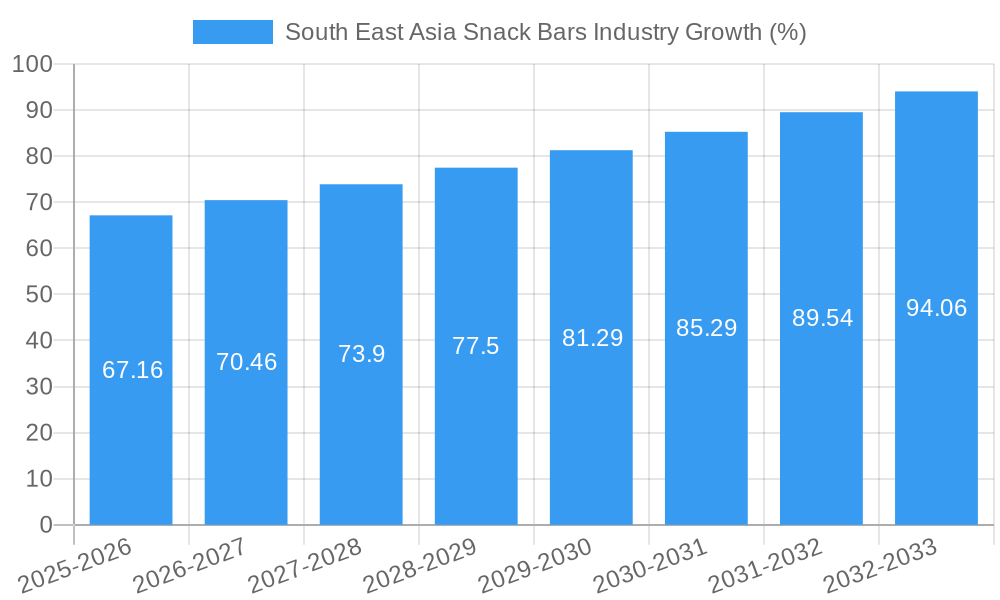
| Growth Rate | CAGR of 5.19% from 2019-2033 |
| Segmentation |
|
Table of Contents
- 1. Introduction
- 1.1. Research Scope
- 1.2. Market Segmentation
- 1.3. Research Methodology
- 1.4. Definitions and Assumptions
- 2. Executive Summary
- 2.1. Introduction
- 3. Market Dynamics
- 3.1. Introduction
- 3.2. Market Drivers
- 3.2.1. Increasing application of Gelatin in healthcare and pharmaceutical sector
- 3.3. Market Restrains
- 3.3.1. Rising demand for clean label products
- 3.4. Market Trends
- 3.4.1. Propensity to Consume Convenient and Healthy On-the-go Meal and Snack Options
- 4. Market Factor Analysis
- 4.1. Porters Five Forces
- 4.2. Supply/Value Chain
- 4.3. PESTEL analysis
- 4.4. Market Entropy
- 4.5. Patent/Trademark Analysis
- 5. South East Asia Snack Bars Industry Analysis, Insights and Forecast, 2019-2031
- 5.1. Market Analysis, Insights and Forecast - by Product Type
- 5.1.1. Cereal Bar
- 5.1.1.1. Granola/Muesli Bars
- 5.1.1.2. Other Cereal Bars
- 5.1.2. Energy Bar
- 5.1.3. Other Snack Bars
- 5.1.1. Cereal Bar
- 5.2. Market Analysis, Insights and Forecast - by Distribution Channel
- 5.2.1. Hypermarket/Supermarket
- 5.2.2. Online Stores
- 5.2.3. Convenience Stores
- 5.2.4. Other Distribution Channels
- 5.3. Market Analysis, Insights and Forecast - by Countires
- 5.3.1. Indonesia
- 5.3.2. Malaysia
- 5.3.3. Myanmar
- 5.3.4. Philippines
- 5.3.5. Singapore
- 5.3.6. Thailand
- 5.3.7. Vietnam
- 5.3.8. Rest of South East Asia
- 5.4. Market Analysis, Insights and Forecast - by Region
- 5.4.1. South East Asia
- 5.1. Market Analysis, Insights and Forecast - by Product Type
- 6. China South East Asia Snack Bars Industry Analysis, Insights and Forecast, 2019-2031
- 7. Japan South East Asia Snack Bars Industry Analysis, Insights and Forecast, 2019-2031
- 8. India South East Asia Snack Bars Industry Analysis, Insights and Forecast, 2019-2031
- 9. South Korea South East Asia Snack Bars Industry Analysis, Insights and Forecast, 2019-2031
- 10. Taiwan South East Asia Snack Bars Industry Analysis, Insights and Forecast, 2019-2031
- 11. Australia South East Asia Snack Bars Industry Analysis, Insights and Forecast, 2019-2031
- 12. Rest of Asia-Pacific South East Asia Snack Bars Industry Analysis, Insights and Forecast, 2019-2031
- 13. Competitive Analysis
- 13.1. Market Share Analysis 2024
- 13.2. Company Profiles
- 13.2.1 Nesle SA
- 13.2.1.1. Overview
- 13.2.1.2. Products
- 13.2.1.3. SWOT Analysis
- 13.2.1.4. Recent Developments
- 13.2.1.5. Financials (Based on Availability)
- 13.2.2 General Mills Inc
- 13.2.2.1. Overview
- 13.2.2.2. Products
- 13.2.2.3. SWOT Analysis
- 13.2.2.4. Recent Developments
- 13.2.2.5. Financials (Based on Availability)
- 13.2.3 GRANOVA
- 13.2.3.1. Overview
- 13.2.3.2. Products
- 13.2.3.3. SWOT Analysis
- 13.2.3.4. Recent Developments
- 13.2.3.5. Financials (Based on Availability)
- 13.2.4 Clif Bar & Company
- 13.2.4.1. Overview
- 13.2.4.2. Products
- 13.2.4.3. SWOT Analysis
- 13.2.4.4. Recent Developments
- 13.2.4.5. Financials (Based on Availability)
- 13.2.5 Amway Corp *List Not Exhaustive
- 13.2.5.1. Overview
- 13.2.5.2. Products
- 13.2.5.3. SWOT Analysis
- 13.2.5.4. Recent Developments
- 13.2.5.5. Financials (Based on Availability)
- 13.2.6 KIND LLC
- 13.2.6.1. Overview
- 13.2.6.2. Products
- 13.2.6.3. SWOT Analysis
- 13.2.6.4. Recent Developments
- 13.2.6.5. Financials (Based on Availability)
- 13.2.7 The Hut com Limited (Myprotein)
- 13.2.7.1. Overview
- 13.2.7.2. Products
- 13.2.7.3. SWOT Analysis
- 13.2.7.4. Recent Developments
- 13.2.7.5. Financials (Based on Availability)
- 13.2.8 Kellogg Company
- 13.2.8.1. Overview
- 13.2.8.2. Products
- 13.2.8.3. SWOT Analysis
- 13.2.8.4. Recent Developments
- 13.2.8.5. Financials (Based on Availability)
- 13.2.9 General Nutrition Centers Inc
- 13.2.9.1. Overview
- 13.2.9.2. Products
- 13.2.9.3. SWOT Analysis
- 13.2.9.4. Recent Developments
- 13.2.9.5. Financials (Based on Availability)
- 13.2.10 PRISTINE (Yogood)
- 13.2.10.1. Overview
- 13.2.10.2. Products
- 13.2.10.3. SWOT Analysis
- 13.2.10.4. Recent Developments
- 13.2.10.5. Financials (Based on Availability)
- 13.2.1 Nesle SA
List of Figures
- Figure 1: South East Asia Snack Bars Industry Revenue Breakdown (Million, %) by Product 2024 & 2032
- Figure 2: South East Asia Snack Bars Industry Share (%) by Company 2024
List of Tables
- Table 1: South East Asia Snack Bars Industry Revenue Million Forecast, by Region 2019 & 2032
- Table 2: South East Asia Snack Bars Industry Volume K Tons Forecast, by Region 2019 & 2032
- Table 3: South East Asia Snack Bars Industry Revenue Million Forecast, by Product Type 2019 & 2032
- Table 4: South East Asia Snack Bars Industry Volume K Tons Forecast, by Product Type 2019 & 2032
- Table 5: South East Asia Snack Bars Industry Revenue Million Forecast, by Distribution Channel 2019 & 2032
- Table 6: South East Asia Snack Bars Industry Volume K Tons Forecast, by Distribution Channel 2019 & 2032
- Table 7: South East Asia Snack Bars Industry Revenue Million Forecast, by Countires 2019 & 2032
- Table 8: South East Asia Snack Bars Industry Volume K Tons Forecast, by Countires 2019 & 2032
- Table 9: South East Asia Snack Bars Industry Revenue Million Forecast, by Region 2019 & 2032
- Table 10: South East Asia Snack Bars Industry Volume K Tons Forecast, by Region 2019 & 2032
- Table 11: South East Asia Snack Bars Industry Revenue Million Forecast, by Country 2019 & 2032
- Table 12: South East Asia Snack Bars Industry Volume K Tons Forecast, by Country 2019 & 2032
- Table 13: China South East Asia Snack Bars Industry Revenue (Million) Forecast, by Application 2019 & 2032
- Table 14: China South East Asia Snack Bars Industry Volume (K Tons) Forecast, by Application 2019 & 2032
- Table 15: Japan South East Asia Snack Bars Industry Revenue (Million) Forecast, by Application 2019 & 2032
- Table 16: Japan South East Asia Snack Bars Industry Volume (K Tons) Forecast, by Application 2019 & 2032
- Table 17: India South East Asia Snack Bars Industry Revenue (Million) Forecast, by Application 2019 & 2032
- Table 18: India South East Asia Snack Bars Industry Volume (K Tons) Forecast, by Application 2019 & 2032
- Table 19: South Korea South East Asia Snack Bars Industry Revenue (Million) Forecast, by Application 2019 & 2032
- Table 20: South Korea South East Asia Snack Bars Industry Volume (K Tons) Forecast, by Application 2019 & 2032
- Table 21: Taiwan South East Asia Snack Bars Industry Revenue (Million) Forecast, by Application 2019 & 2032
- Table 22: Taiwan South East Asia Snack Bars Industry Volume (K Tons) Forecast, by Application 2019 & 2032
- Table 23: Australia South East Asia Snack Bars Industry Revenue (Million) Forecast, by Application 2019 & 2032
- Table 24: Australia South East Asia Snack Bars Industry Volume (K Tons) Forecast, by Application 2019 & 2032
- Table 25: Rest of Asia-Pacific South East Asia Snack Bars Industry Revenue (Million) Forecast, by Application 2019 & 2032
- Table 26: Rest of Asia-Pacific South East Asia Snack Bars Industry Volume (K Tons) Forecast, by Application 2019 & 2032
- Table 27: South East Asia Snack Bars Industry Revenue Million Forecast, by Product Type 2019 & 2032
- Table 28: South East Asia Snack Bars Industry Volume K Tons Forecast, by Product Type 2019 & 2032
- Table 29: South East Asia Snack Bars Industry Revenue Million Forecast, by Distribution Channel 2019 & 2032
- Table 30: South East Asia Snack Bars Industry Volume K Tons Forecast, by Distribution Channel 2019 & 2032
- Table 31: South East Asia Snack Bars Industry Revenue Million Forecast, by Countires 2019 & 2032
- Table 32: South East Asia Snack Bars Industry Volume K Tons Forecast, by Countires 2019 & 2032
- Table 33: South East Asia Snack Bars Industry Revenue Million Forecast, by Country 2019 & 2032
- Table 34: South East Asia Snack Bars Industry Volume K Tons Forecast, by Country 2019 & 2032
- Table 35: Indonesia South East Asia Snack Bars Industry Revenue (Million) Forecast, by Application 2019 & 2032
- Table 36: Indonesia South East Asia Snack Bars Industry Volume (K Tons) Forecast, by Application 2019 & 2032
- Table 37: Malaysia South East Asia Snack Bars Industry Revenue (Million) Forecast, by Application 2019 & 2032
- Table 38: Malaysia South East Asia Snack Bars Industry Volume (K Tons) Forecast, by Application 2019 & 2032
- Table 39: Singapore South East Asia Snack Bars Industry Revenue (Million) Forecast, by Application 2019 & 2032
- Table 40: Singapore South East Asia Snack Bars Industry Volume (K Tons) Forecast, by Application 2019 & 2032
- Table 41: Thailand South East Asia Snack Bars Industry Revenue (Million) Forecast, by Application 2019 & 2032
- Table 42: Thailand South East Asia Snack Bars Industry Volume (K Tons) Forecast, by Application 2019 & 2032
- Table 43: Vietnam South East Asia Snack Bars Industry Revenue (Million) Forecast, by Application 2019 & 2032
- Table 44: Vietnam South East Asia Snack Bars Industry Volume (K Tons) Forecast, by Application 2019 & 2032
- Table 45: Philippines South East Asia Snack Bars Industry Revenue (Million) Forecast, by Application 2019 & 2032
- Table 46: Philippines South East Asia Snack Bars Industry Volume (K Tons) Forecast, by Application 2019 & 2032
- Table 47: Myanmar South East Asia Snack Bars Industry Revenue (Million) Forecast, by Application 2019 & 2032
- Table 48: Myanmar South East Asia Snack Bars Industry Volume (K Tons) Forecast, by Application 2019 & 2032
- Table 49: Cambodia South East Asia Snack Bars Industry Revenue (Million) Forecast, by Application 2019 & 2032
- Table 50: Cambodia South East Asia Snack Bars Industry Volume (K Tons) Forecast, by Application 2019 & 2032
- Table 51: Laos South East Asia Snack Bars Industry Revenue (Million) Forecast, by Application 2019 & 2032
- Table 52: Laos South East Asia Snack Bars Industry Volume (K Tons) Forecast, by Application 2019 & 2032
Frequently Asked Questions
1. What is the projected Compound Annual Growth Rate (CAGR) of the South East Asia Snack Bars Industry?
The projected CAGR is approximately 5.19%.
2. Which companies are prominent players in the South East Asia Snack Bars Industry?
Key companies in the market include Nesle SA, General Mills Inc, GRANOVA, Clif Bar & Company, Amway Corp *List Not Exhaustive, KIND LLC, The Hut com Limited (Myprotein), Kellogg Company, General Nutrition Centers Inc, PRISTINE (Yogood).
3. What are the main segments of the South East Asia Snack Bars Industry?
The market segments include Product Type, Distribution Channel, Countires.
4. Can you provide details about the market size?
The market size is estimated to be USD 1200 Million as of 2022.
5. What are some drivers contributing to market growth?
Increasing application of Gelatin in healthcare and pharmaceutical sector.
6. What are the notable trends driving market growth?
Propensity to Consume Convenient and Healthy On-the-go Meal and Snack Options.
7. Are there any restraints impacting market growth?
Rising demand for clean label products.
8. Can you provide examples of recent developments in the market?
New product launches with functional ingredients and innovative flavors
9. What pricing options are available for accessing the report?
Pricing options include single-user, multi-user, and enterprise licenses priced at USD 4750, USD 4950, and USD 6800 respectively.
10. Is the market size provided in terms of value or volume?
The market size is provided in terms of value, measured in Million and volume, measured in K Tons.
11. Are there any specific market keywords associated with the report?
Yes, the market keyword associated with the report is "South East Asia Snack Bars Industry," which aids in identifying and referencing the specific market segment covered.
12. How do I determine which pricing option suits my needs best?
The pricing options vary based on user requirements and access needs. Individual users may opt for single-user licenses, while businesses requiring broader access may choose multi-user or enterprise licenses for cost-effective access to the report.
13. Are there any additional resources or data provided in the South East Asia Snack Bars Industry report?
While the report offers comprehensive insights, it's advisable to review the specific contents or supplementary materials provided to ascertain if additional resources or data are available.
14. How can I stay updated on further developments or reports in the South East Asia Snack Bars Industry?
To stay informed about further developments, trends, and reports in the South East Asia Snack Bars Industry, consider subscribing to industry newsletters, following relevant companies and organizations, or regularly checking reputable industry news sources and publications.
Methodology
Step 1 - Identification of Relevant Samples Size from Population Database


Step 2 - Approaches for Defining Global Market Size (Value, Volume* & Price*)

Note*: In applicable scenarios
Step 3 - Data Sources
Primary Research
- Web Analytics
- Survey Reports
- Research Institute
- Latest Research Reports
- Opinion Leaders
Secondary Research
- Annual Reports
- White Paper
- Latest Press Release
- Industry Association
- Paid Database
- Investor Presentations

Step 4 - Data Triangulation
Involves using different sources of information in order to increase the validity of a study
These sources are likely to be stakeholders in a program - participants, other researchers, program staff, other community members, and so on.
Then we put all data in single framework & apply various statistical tools to find out the dynamic on the market.
During the analysis stage, feedback from the stakeholder groups would be compared to determine areas of agreement as well as areas of divergence


