

Key Insights
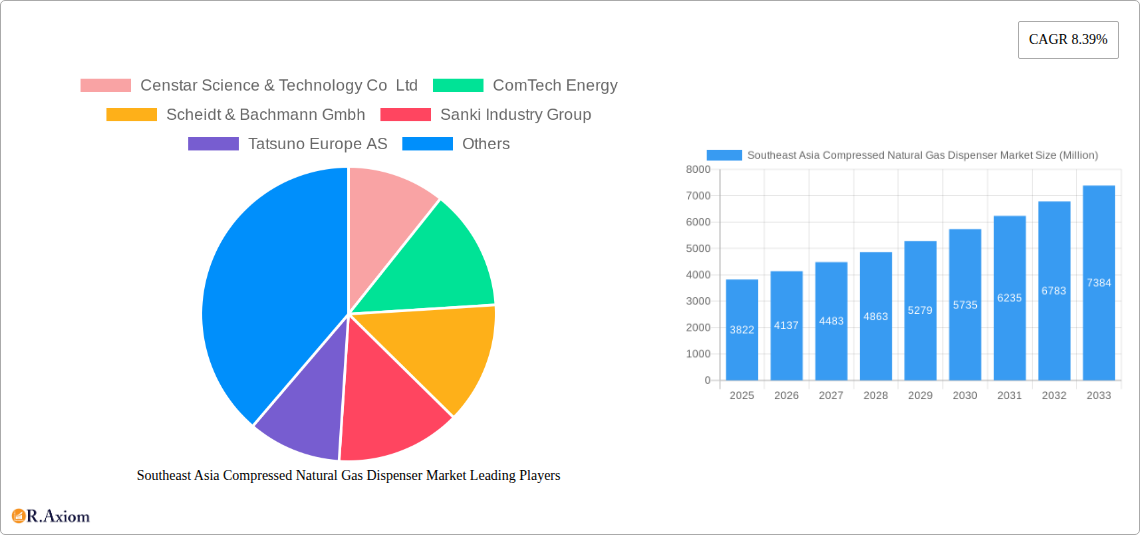
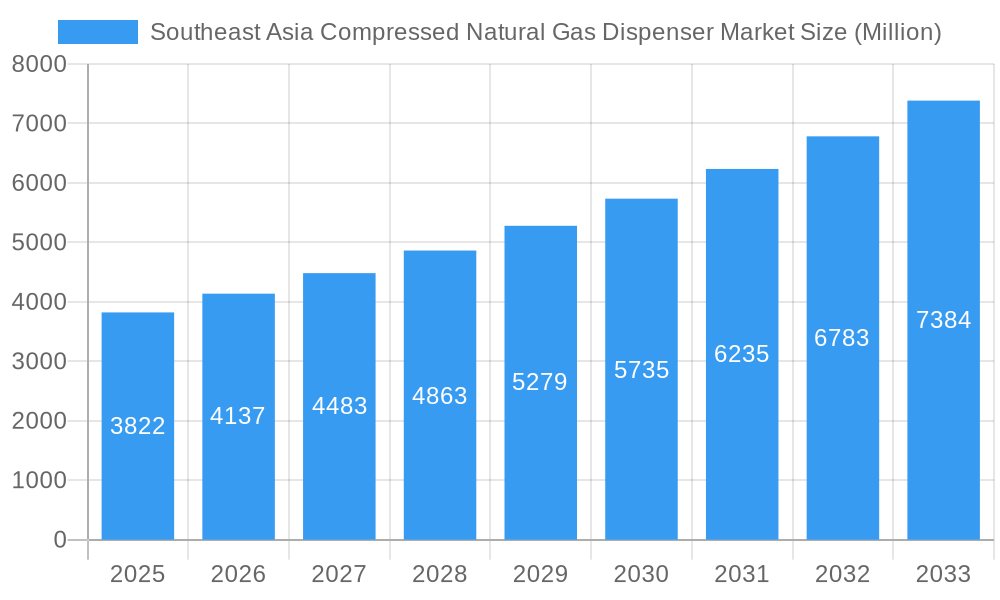
The Southeast Asia Compressed Natural Gas (CNG) Dispenser market is experiencing robust growth, projected to reach a significant market size driven by increasing environmental concerns and government initiatives promoting cleaner fuels. The market's Compound Annual Growth Rate (CAGR) of 8.39% from 2019 to 2024 indicates a strong upward trajectory. This growth is fueled by several key factors. Firstly, the rising adoption of CNG vehicles, particularly in the commercial and public transport sectors, is creating a surge in demand for efficient and reliable CNG dispensers. Governments across Southeast Asia are actively investing in CNG infrastructure, offering substantial incentives to both businesses and individuals to adopt CNG as a more sustainable alternative to traditional fuels. This includes subsidies, tax breaks, and the development of dedicated CNG fueling stations. Furthermore, the increasing awareness of air pollution and its detrimental effects on public health is bolstering the shift towards cleaner fuel options like CNG. The market segmentation reveals a strong preference for dual-hose dispensers due to their increased efficiency, while the high-pressure dispenser segment dominates due to the pressure requirements of many CNG vehicles. Key players in the market are focusing on technological advancements, enhancing dispenser efficiency and reliability, while also expanding their distribution networks across the region to capitalize on the growing demand. Competitive landscape analysis reveals a mix of both established international players and regional companies, creating a dynamic market with opportunities for innovation and market share growth.
Southeast Asia Compressed Natural Gas Dispenser Market Market Size (In Billion)
The market's growth isn't without challenges. One significant restraint is the high initial investment costs associated with installing CNG infrastructure, particularly in less developed areas. This poses a barrier to entry for smaller businesses and may slow down market expansion in certain regions. However, ongoing government support, combined with the long-term cost savings and environmental benefits of CNG, are likely to mitigate these challenges. The market is segmented by dispenser type (single-hose, dual-hose), end-user (commercial, retail, public transport), pressure (low, medium, high), and application (heavy-duty, light-duty vehicles). The Asia Pacific region, particularly China, India, and other rapidly developing economies within Southeast Asia, are expected to contribute significantly to the overall market growth due to their rapidly expanding transportation sectors and increasing focus on sustainable energy solutions. Future growth will depend on continued governmental support, technological advancements in CNG dispenser technology, and increasing consumer awareness of the environmental and economic benefits of CNG.
Southeast Asia Compressed Natural Gas Dispenser Market Company Market Share
This detailed report provides a comprehensive analysis of the Southeast Asia Compressed Natural Gas (CNG) Dispenser market, offering invaluable insights for industry stakeholders, investors, and strategic decision-makers. Covering the period from 2019 to 2033, with a focus on 2025 as the base and estimated year, this report meticulously examines market trends, growth drivers, challenges, and opportunities within this dynamic sector. The study period of 2019-2024 serves as the historical period, enabling a robust analysis of market evolution and future projections (2025-2033). The report's granular segmentation by type, end-user, pressure, and application allows for a precise understanding of specific market dynamics.
Southeast Asia Compressed Natural Gas Dispenser Market Market Concentration & Innovation
This section analyzes the competitive landscape of the Southeast Asia CNG Dispenser market, assessing market concentration, innovation drivers, regulatory frameworks, product substitutes, end-user trends, and merger & acquisition (M&A) activities. The market is moderately concentrated, with the top five players holding approximately xx% of the market share in 2025. Innovation is driven by the need for improved efficiency, reduced emissions, and enhanced safety features in CNG dispensers. Stringent government regulations regarding environmental protection are influencing the adoption of advanced CNG technologies. The primary substitute for CNG dispensers is Compressed Biogas (CBG) dispensers which is slowly gaining share. End-user trends indicate a shift towards higher-capacity dispensers for commercial and public transport applications. M&A activities in the past five years have totaled approximately $xx Million, driven by strategic expansions and technological advancements. Key players are focusing on mergers and acquisitions to expand product offerings, increase market share, and strengthen their positions.
Southeast Asia Compressed Natural Gas Dispenser Market Industry Trends & Insights
The Southeast Asia Compressed Natural Gas (CNG) Dispenser market is demonstrating robust and sustained growth, fueled by a confluence of factors. A primary driver is the increasing commitment from regional governments to promote cleaner and more sustainable energy alternatives. This is complemented by rapid urbanization across the region, leading to a greater demand for efficient and environmentally friendly transportation fuels. As a result, natural gas is gaining traction as a preferred fuel for vehicles. The market registered a Compound Annual Growth Rate (CAGR) of **[Insert specific CAGR from your data here]%** during the 2019-2024 period and is projected to continue its upward trajectory, exhibiting a CAGR of **[Insert specific CAGR from your data here]%** during the forecast period of 2025-2033.
Technological advancements are playing a pivotal role in reshaping the industry. The adoption of smart dispensers equipped with remote monitoring and diagnostic capabilities is enhancing operational efficiency and reducing downtime. Furthermore, consumer preferences are evolving, with a growing demand for dispensers that offer higher dispensing speeds and incorporate advanced safety features to ensure secure refueling operations.
The competitive landscape is dynamic, characterized by intense rivalry among established market leaders and the strategic emergence of new players introducing innovative solutions. A significant trend is the anticipated surge in the penetration of CNG dispensers within the public transport sector by 2033, driven by a desire for reduced operational costs and lower emissions. The continuous integration of advanced materials and cutting-edge technologies aimed at improving the durability, reliability, and overall efficiency of CNG dispensers will remain a key determinant of market success.
Dominant Markets & Segments in Southeast Asia Compressed Natural Gas Dispenser Market
This section identifies the leading regions, countries, and market segments within the Southeast Asia CNG Dispenser market.
- Leading Region: Indonesia currently dominates the market due to its large population, burgeoning automotive sector, and government support for CNG infrastructure development.
- Leading Country: Indonesia exhibits the highest growth rate.
- Dominant Segments:
- Type: Dual-hose dispensers are gaining traction due to their higher dispensing efficiency.
- End-user: The commercial segment represents the largest share, driven by the high demand from trucking and logistics companies.
- Pressure: Medium-pressure dispensers are the most widely used type.
- Application: Heavy-duty vehicles segment is leading due to a focus on reducing emissions from commercial transport.
Key drivers for the dominance of these segments include supportive government policies encouraging CNG adoption, robust economic growth in several Southeast Asian nations, and the increasing awareness about the environmental benefits of CNG. Indonesia’s well-developed CNG infrastructure contributes significantly to its market leadership.
Southeast Asia Compressed Natural Gas Dispenser Market Product Developments
Recent product innovations focus on improving dispenser efficiency, reliability, and safety. Smart dispensers with remote monitoring capabilities and improved data analytics are gaining prominence. Manufacturers are incorporating advanced materials to enhance durability and reduce maintenance costs. The integration of alternative payment systems, such as mobile wallets, is improving user experience. These developments are enhancing the market fit of CNG dispensers by addressing key challenges related to operational efficiency and user convenience.
Report Scope & Segmentation Analysis
The report comprehensively segments the Southeast Asia CNG Dispenser market based on:
- Type: Single-hose dispensers and Dual-hose dispensers (Growth projections: xx% and xx%, respectively, during 2025-2033).
- End-user: Commercial, Retail, and Public transport (Market sizes: $xx Million, $xx Million, and $xx Million in 2025, respectively).
- Pressure: Low-pressure, Medium-pressure, and High-pressure dispensers (Market share distribution: xx%, xx%, and xx% in 2025, respectively).
- Application: Heavy-duty vehicles and Light-duty vehicles (Growth potential: xx% and xx% during 2025-2033, respectively).
Each segment’s competitive dynamics are analyzed, providing insights into market share, competitive strategies, and growth opportunities.
Key Drivers of Southeast Asia Compressed Natural Gas Dispenser Market Growth
Several factors contribute to the market's growth:
- Government initiatives: Subsidies and tax incentives are promoting CNG adoption.
- Environmental concerns: Growing awareness of environmental issues is driving the shift towards cleaner fuels.
- Technological advancements: Innovations in dispenser technology enhance efficiency and safety.
- Infrastructure development: Investments in CNG infrastructure are expanding the market reach.
Challenges in the Southeast Asia Compressed Natural Gas Dispenser Market Sector
The market faces several challenges:
- High initial investment costs: The setup of CNG refueling infrastructure requires significant capital investment.
- Limited CNG availability: In some regions, the availability of CNG is still limited, hindering widespread adoption.
- Safety concerns: Public perception regarding the safety of CNG needs improvement. Incidents of leakage and explosion, though rare, can negatively affect market growth.
- Competition from other alternative fuels: Competition from electric vehicles and other alternative fuel technologies might impact growth rate.
Emerging Opportunities in Southeast Asia Compressed Natural Gas Dispenser Market
The Southeast Asia CNG Dispenser market is ripe with burgeoning opportunities. Key areas for future expansion and innovation include:
- Expansion into Underserved and Rural Areas: A significant growth avenue lies in extending CNG refueling infrastructure to rural and less-developed regions, catering to the growing demand for affordable and cleaner fuels in these areas.
- Integration of Advanced Smart Technologies: The deep integration of the Internet of Things (IoT) and Artificial Intelligence (AI) into CNG dispenser operations promises to unlock unprecedented levels of efficiency, predictive maintenance, and real-time monitoring, thereby optimizing performance and reducing operational costs.
- Development and Adoption of Compressed Biogas (CBG) Infrastructure: With increasing focus on circular economy principles, the development of infrastructure for Compressed Biogas (CBG) as a direct substitute for CNG presents substantial long-term growth potential, aligning with sustainability goals.
- Focus on Fleet Conversion and Public Transportation: Government incentives and the inherent cost-saving benefits of CNG are expected to drive further conversion of commercial vehicle fleets and public transportation systems, creating sustained demand for dispensers.
- Innovation in Dispenser Design and Safety Features: Continuous research and development in dispenser design to enhance user experience, speed, and paramount safety features will remain a critical differentiator for market players.
Leading Players in the Southeast Asia Compressed Natural Gas Dispenser Market Market
- Censtar Science & Technology Co Ltd
- ComTech Energy
- Scheidt & Bachmann Gmbh
- Sanki Industry Group
- Tatsuno Europe AS
- TGT Fuel Technologies India Pvt Ltd
- Gilbarco Inc
- Greka Engineering
- FTI International Group Inc
- Parker Hannifin Corp
- Dometic Group AB
- Dresser Wayne
Key Developments in Southeast Asia Compressed Natural Gas Dispenser Market Industry
- January 2023: Censtar Science & Technology Co Ltd launched an advanced series of dual-hose CNG dispensers, significantly enhancing refueling safety and efficiency for commercial vehicle operators. This move solidified their position in markets prioritizing safety regulations.
- June 2024: The Indonesian government unveiled ambitious plans to substantially expand its CNG refueling infrastructure, particularly targeting rural and peri-urban areas. This initiative is expected to stimulate demand for new dispenser installations and create opportunities for infrastructure development partners.
- October 2024: Scheidt & Bachmann Gmbh announced a strategic partnership with a leading Southeast Asian energy provider to deploy its latest generation of smart CNG dispensers, integrating advanced analytics and remote management capabilities to optimize network performance.
- February 2024: Sanki Industry Group highlighted its focus on developing highly durable CNG dispensers for challenging tropical climates, anticipating increased adoption in countries with humid and varying environmental conditions across the region.
- May 2024: The emergence of Compressed Biogas (CBG) as a viable alternative fuel source in several Southeast Asian nations is prompting investments in retrofitting existing CNG stations and developing new infrastructure, creating a new segment for dispenser manufacturers.
Strategic Outlook for Southeast Asia Compressed Natural Gas Dispenser Market Market
The Southeast Asia CNG Dispenser market is strategically positioned for substantial and sustained growth. This expansion will be predominantly propelled by the synergistic effects of supportive government policies aimed at promoting cleaner energy, a heightened global and regional emphasis on environmental sustainability, and continuous technological innovation. The market is not only expected to expand in terms of volume but also witness the emergence of new and lucrative business opportunities, particularly in rapidly developing emerging markets and through the continuous refinement of dispenser technology focusing on enhanced efficiency, user-friendliness, and uncompromising safety.
The increasing viability and adoption of Compressed Biogas (CBG) technology are poised to significantly influence and accelerate the growth of this market segment, offering a more sustainable and renewable pathway for natural gas-based transportation. Companies that adopt a forward-thinking approach, prioritizing innovation, investing in research and development, and forging strategic partnerships with local stakeholders and energy providers, are exceptionally well-positioned to capitalize on this dynamic growth trajectory and secure a dominant market presence in the years to come.
Southeast Asia Compressed Natural Gas Dispenser Market Segmentation
- 1. Thailand
- 2. Singapore
- 3. Indonesia
- 4. Malaysia
- 5. Rest of Southeast Asia
Southeast Asia Compressed Natural Gas Dispenser Market Segmentation By Geography
-
1. North America
- 1.1. United States
- 1.2. Canada
- 1.3. Mexico
-
2. South America
- 2.1. Brazil
- 2.2. Argentina
- 2.3. Rest of South America
-
3. Europe
- 3.1. United Kingdom
- 3.2. Germany
- 3.3. France
- 3.4. Italy
- 3.5. Spain
- 3.6. Russia
- 3.7. Benelux
- 3.8. Nordics
- 3.9. Rest of Europe
-
4. Middle East & Africa
- 4.1. Turkey
- 4.2. Israel
- 4.3. GCC
- 4.4. North Africa
- 4.5. South Africa
- 4.6. Rest of Middle East & Africa
-
5. Asia Pacific
- 5.1. China
- 5.2. India
- 5.3. Japan
- 5.4. South Korea
- 5.5. ASEAN
- 5.6. Oceania
- 5.7. Rest of Asia Pacific
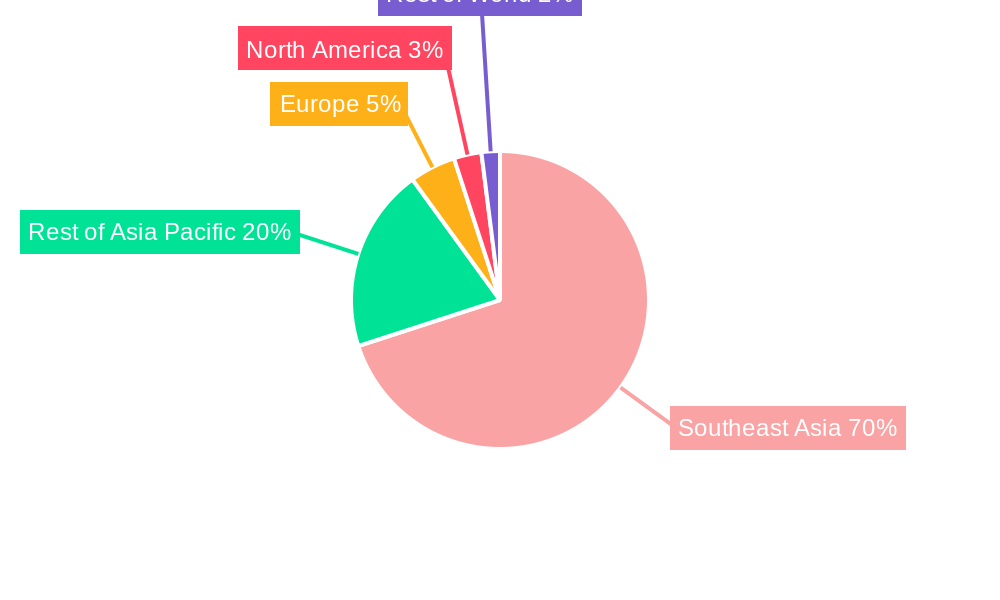
Southeast Asia Compressed Natural Gas Dispenser Market Regional Market Share
Geographic Coverage of Southeast Asia Compressed Natural Gas Dispenser Market
Southeast Asia Compressed Natural Gas Dispenser Market REPORT HIGHLIGHTS
| Aspects | Details |
|---|---|
| Study Period | 2020-2034 |
| Base Year | 2025 |
| Estimated Year | 2026 |
| Forecast Period | 2026-2034 |
| Historical Period | 2020-2025 |
| Growth Rate | CAGR of 8.39% from 2020-2034 |
| Segmentation |
|
Table of Contents
- 1. Introduction
- 1.1. Research Scope
- 1.2. Market Segmentation
- 1.3. Research Objective
- 1.4. Definitions and Assumptions
- 2. Executive Summary
- 2.1. Market Snapshot
- 3. Market Dynamics
- 3.1. Market Drivers
- 3.2. Market Restrains
- 3.3. Market Trends
- 3.4. Market Opportunities
- 4. Market Factor Analysis
- 4.1. Porters Five Forces
- 4.1.1. Bargaining Power of Suppliers
- 4.1.2. Bargaining Power of Buyers
- 4.1.3. Threat of New Entrants
- 4.1.4. Threat of Substitutes
- 4.1.5. Competitive Rivalry
- 4.2. PESTEL analysis
- 4.3. BCG Analysis
- 4.3.1. Stars (High Growth, High Market Share)
- 4.3.2. Cash Cows (Low Growth, High Market Share)
- 4.3.3. Question Mark (High Growth, Low Market Share)
- 4.3.4. Dogs (Low Growth, Low Market Share)
- 4.4. Ansoff Matrix Analysis
- 4.5. Supply Chain Analysis
- 4.6. Regulatory Landscape
- 4.7. Current Market Potential and Opportunity Assessment (TAM–SAM–SOM Framework)
- 4.8. RAX Analyst Note
- 4.1. Porters Five Forces
- 5. Market Analysis, Insights and Forecast 2021-2033
- 5.1. Market Analysis, Insights and Forecast - by Thailand
- 5.2. Market Analysis, Insights and Forecast - by Singapore
- 5.3. Market Analysis, Insights and Forecast - by Indonesia
- 5.4. Market Analysis, Insights and Forecast - by Malaysia
- 5.5. Market Analysis, Insights and Forecast - by Rest of Southeast Asia
- 5.6. Market Analysis, Insights and Forecast - by Region
- 5.6.1. North America
- 5.6.2. South America
- 5.6.3. Europe
- 5.6.4. Middle East & Africa
- 5.6.5. Asia Pacific
- 6. Global Southeast Asia Compressed Natural Gas Dispenser Market Analysis, Insights and Forecast, 2021-2033
- 6.1. Market Analysis, Insights and Forecast - by Thailand
- 6.2. Market Analysis, Insights and Forecast - by Singapore
- 6.3. Market Analysis, Insights and Forecast - by Indonesia
- 6.4. Market Analysis, Insights and Forecast - by Malaysia
- 6.5. Market Analysis, Insights and Forecast - by Rest of Southeast Asia
- 7. North America Southeast Asia Compressed Natural Gas Dispenser Market Analysis, Insights and Forecast, 2020-2032
- 7.1. Market Analysis, Insights and Forecast - by Thailand
- 7.2. Market Analysis, Insights and Forecast - by Singapore
- 7.3. Market Analysis, Insights and Forecast - by Indonesia
- 7.4. Market Analysis, Insights and Forecast - by Malaysia
- 7.5. Market Analysis, Insights and Forecast - by Rest of Southeast Asia
- 8. South America Southeast Asia Compressed Natural Gas Dispenser Market Analysis, Insights and Forecast, 2020-2032
- 8.1. Market Analysis, Insights and Forecast - by Thailand
- 8.2. Market Analysis, Insights and Forecast - by Singapore
- 8.3. Market Analysis, Insights and Forecast - by Indonesia
- 8.4. Market Analysis, Insights and Forecast - by Malaysia
- 8.5. Market Analysis, Insights and Forecast - by Rest of Southeast Asia
- 9. Europe Southeast Asia Compressed Natural Gas Dispenser Market Analysis, Insights and Forecast, 2020-2032
- 9.1. Market Analysis, Insights and Forecast - by Thailand
- 9.2. Market Analysis, Insights and Forecast - by Singapore
- 9.3. Market Analysis, Insights and Forecast - by Indonesia
- 9.4. Market Analysis, Insights and Forecast - by Malaysia
- 9.5. Market Analysis, Insights and Forecast - by Rest of Southeast Asia
- 10. Middle East & Africa Southeast Asia Compressed Natural Gas Dispenser Market Analysis, Insights and Forecast, 2020-2032
- 10.1. Market Analysis, Insights and Forecast - by Thailand
- 10.2. Market Analysis, Insights and Forecast - by Singapore
- 10.3. Market Analysis, Insights and Forecast - by Indonesia
- 10.4. Market Analysis, Insights and Forecast - by Malaysia
- 10.5. Market Analysis, Insights and Forecast - by Rest of Southeast Asia
- 11. Asia Pacific Southeast Asia Compressed Natural Gas Dispenser Market Analysis, Insights and Forecast, 2020-2032
- 11.1. Market Analysis, Insights and Forecast - by Thailand
- 11.2. Market Analysis, Insights and Forecast - by Singapore
- 11.3. Market Analysis, Insights and Forecast - by Indonesia
- 11.4. Market Analysis, Insights and Forecast - by Malaysia
- 11.5. Market Analysis, Insights and Forecast - by Rest of Southeast Asia
- 12. Competitive Analysis
- 12.1. Company Profiles
- 12.1.1 Censtar Science & Technology Co Ltd
- 12.1.1.1. Company Overview
- 12.1.1.2. Products
- 12.1.1.3. Company Financials
- 12.1.1.4. SWOT Analysis
- 12.1.2 ComTech Energy
- 12.1.2.1. Company Overview
- 12.1.2.2. Products
- 12.1.2.3. Company Financials
- 12.1.2.4. SWOT Analysis
- 12.1.3 Scheidt & Bachmann Gmbh
- 12.1.3.1. Company Overview
- 12.1.3.2. Products
- 12.1.3.3. Company Financials
- 12.1.3.4. SWOT Analysis
- 12.1.4 Sanki Industry Group
- 12.1.4.1. Company Overview
- 12.1.4.2. Products
- 12.1.4.3. Company Financials
- 12.1.4.4. SWOT Analysis
- 12.1.5 Tatsuno Europe AS
- 12.1.5.1. Company Overview
- 12.1.5.2. Products
- 12.1.5.3. Company Financials
- 12.1.5.4. SWOT Analysis
- 12.1.6 TGT Fuel Technologies India Pvt Ltd
- 12.1.6.1. Company Overview
- 12.1.6.2. Products
- 12.1.6.3. Company Financials
- 12.1.6.4. SWOT Analysis
- 12.1.7 Gilbarco Inc
- 12.1.7.1. Company Overview
- 12.1.7.2. Products
- 12.1.7.3. Company Financials
- 12.1.7.4. SWOT Analysis
- 12.1.8 Greka Engineering
- 12.1.8.1. Company Overview
- 12.1.8.2. Products
- 12.1.8.3. Company Financials
- 12.1.8.4. SWOT Analysis
- 12.1.9 FTI International Group Inc
- 12.1.9.1. Company Overview
- 12.1.9.2. Products
- 12.1.9.3. Company Financials
- 12.1.9.4. SWOT Analysis
- 12.1.10 Parker Hannifin Corp
- 12.1.10.1. Company Overview
- 12.1.10.2. Products
- 12.1.10.3. Company Financials
- 12.1.10.4. SWOT Analysis
- 12.1.1 Censtar Science & Technology Co Ltd
- 12.2. Market Entropy
- 12.2.1 Company's Key Areas Served
- 12.2.2 Recent Developments
- 12.3. Company Market Share Analysis 2025
- 12.3.1 Top 5 Companies Market Share Analysis
- 12.3.2 Top 3 Companies Market Share Analysis
- 12.4. List of Potential Customers
- 13. Research Methodology
List of Figures
- Figure 1: Global Southeast Asia Compressed Natural Gas Dispenser Market Revenue Breakdown (Million, %) by Region 2025 & 2033
- Figure 2: Global Southeast Asia Compressed Natural Gas Dispenser Market Volume Breakdown (K Unit, %) by Region 2025 & 2033
- Figure 3: North America Southeast Asia Compressed Natural Gas Dispenser Market Revenue (Million), by Thailand 2025 & 2033
- Figure 4: North America Southeast Asia Compressed Natural Gas Dispenser Market Volume (K Unit), by Thailand 2025 & 2033
- Figure 5: North America Southeast Asia Compressed Natural Gas Dispenser Market Revenue Share (%), by Thailand 2025 & 2033
- Figure 6: North America Southeast Asia Compressed Natural Gas Dispenser Market Volume Share (%), by Thailand 2025 & 2033
- Figure 7: North America Southeast Asia Compressed Natural Gas Dispenser Market Revenue (Million), by Singapore 2025 & 2033
- Figure 8: North America Southeast Asia Compressed Natural Gas Dispenser Market Volume (K Unit), by Singapore 2025 & 2033
- Figure 9: North America Southeast Asia Compressed Natural Gas Dispenser Market Revenue Share (%), by Singapore 2025 & 2033
- Figure 10: North America Southeast Asia Compressed Natural Gas Dispenser Market Volume Share (%), by Singapore 2025 & 2033
- Figure 11: North America Southeast Asia Compressed Natural Gas Dispenser Market Revenue (Million), by Indonesia 2025 & 2033
- Figure 12: North America Southeast Asia Compressed Natural Gas Dispenser Market Volume (K Unit), by Indonesia 2025 & 2033
- Figure 13: North America Southeast Asia Compressed Natural Gas Dispenser Market Revenue Share (%), by Indonesia 2025 & 2033
- Figure 14: North America Southeast Asia Compressed Natural Gas Dispenser Market Volume Share (%), by Indonesia 2025 & 2033
- Figure 15: North America Southeast Asia Compressed Natural Gas Dispenser Market Revenue (Million), by Malaysia 2025 & 2033
- Figure 16: North America Southeast Asia Compressed Natural Gas Dispenser Market Volume (K Unit), by Malaysia 2025 & 2033
- Figure 17: North America Southeast Asia Compressed Natural Gas Dispenser Market Revenue Share (%), by Malaysia 2025 & 2033
- Figure 18: North America Southeast Asia Compressed Natural Gas Dispenser Market Volume Share (%), by Malaysia 2025 & 2033
- Figure 19: North America Southeast Asia Compressed Natural Gas Dispenser Market Revenue (Million), by Rest of Southeast Asia 2025 & 2033
- Figure 20: North America Southeast Asia Compressed Natural Gas Dispenser Market Volume (K Unit), by Rest of Southeast Asia 2025 & 2033
- Figure 21: North America Southeast Asia Compressed Natural Gas Dispenser Market Revenue Share (%), by Rest of Southeast Asia 2025 & 2033
- Figure 22: North America Southeast Asia Compressed Natural Gas Dispenser Market Volume Share (%), by Rest of Southeast Asia 2025 & 2033
- Figure 23: North America Southeast Asia Compressed Natural Gas Dispenser Market Revenue (Million), by Country 2025 & 2033
- Figure 24: North America Southeast Asia Compressed Natural Gas Dispenser Market Volume (K Unit), by Country 2025 & 2033
- Figure 25: North America Southeast Asia Compressed Natural Gas Dispenser Market Revenue Share (%), by Country 2025 & 2033
- Figure 26: North America Southeast Asia Compressed Natural Gas Dispenser Market Volume Share (%), by Country 2025 & 2033
- Figure 27: South America Southeast Asia Compressed Natural Gas Dispenser Market Revenue (Million), by Thailand 2025 & 2033
- Figure 28: South America Southeast Asia Compressed Natural Gas Dispenser Market Volume (K Unit), by Thailand 2025 & 2033
- Figure 29: South America Southeast Asia Compressed Natural Gas Dispenser Market Revenue Share (%), by Thailand 2025 & 2033
- Figure 30: South America Southeast Asia Compressed Natural Gas Dispenser Market Volume Share (%), by Thailand 2025 & 2033
- Figure 31: South America Southeast Asia Compressed Natural Gas Dispenser Market Revenue (Million), by Singapore 2025 & 2033
- Figure 32: South America Southeast Asia Compressed Natural Gas Dispenser Market Volume (K Unit), by Singapore 2025 & 2033
- Figure 33: South America Southeast Asia Compressed Natural Gas Dispenser Market Revenue Share (%), by Singapore 2025 & 2033
- Figure 34: South America Southeast Asia Compressed Natural Gas Dispenser Market Volume Share (%), by Singapore 2025 & 2033
- Figure 35: South America Southeast Asia Compressed Natural Gas Dispenser Market Revenue (Million), by Indonesia 2025 & 2033
- Figure 36: South America Southeast Asia Compressed Natural Gas Dispenser Market Volume (K Unit), by Indonesia 2025 & 2033
- Figure 37: South America Southeast Asia Compressed Natural Gas Dispenser Market Revenue Share (%), by Indonesia 2025 & 2033
- Figure 38: South America Southeast Asia Compressed Natural Gas Dispenser Market Volume Share (%), by Indonesia 2025 & 2033
- Figure 39: South America Southeast Asia Compressed Natural Gas Dispenser Market Revenue (Million), by Malaysia 2025 & 2033
- Figure 40: South America Southeast Asia Compressed Natural Gas Dispenser Market Volume (K Unit), by Malaysia 2025 & 2033
- Figure 41: South America Southeast Asia Compressed Natural Gas Dispenser Market Revenue Share (%), by Malaysia 2025 & 2033
- Figure 42: South America Southeast Asia Compressed Natural Gas Dispenser Market Volume Share (%), by Malaysia 2025 & 2033
- Figure 43: South America Southeast Asia Compressed Natural Gas Dispenser Market Revenue (Million), by Rest of Southeast Asia 2025 & 2033
- Figure 44: South America Southeast Asia Compressed Natural Gas Dispenser Market Volume (K Unit), by Rest of Southeast Asia 2025 & 2033
- Figure 45: South America Southeast Asia Compressed Natural Gas Dispenser Market Revenue Share (%), by Rest of Southeast Asia 2025 & 2033
- Figure 46: South America Southeast Asia Compressed Natural Gas Dispenser Market Volume Share (%), by Rest of Southeast Asia 2025 & 2033
- Figure 47: South America Southeast Asia Compressed Natural Gas Dispenser Market Revenue (Million), by Country 2025 & 2033
- Figure 48: South America Southeast Asia Compressed Natural Gas Dispenser Market Volume (K Unit), by Country 2025 & 2033
- Figure 49: South America Southeast Asia Compressed Natural Gas Dispenser Market Revenue Share (%), by Country 2025 & 2033
- Figure 50: South America Southeast Asia Compressed Natural Gas Dispenser Market Volume Share (%), by Country 2025 & 2033
- Figure 51: Europe Southeast Asia Compressed Natural Gas Dispenser Market Revenue (Million), by Thailand 2025 & 2033
- Figure 52: Europe Southeast Asia Compressed Natural Gas Dispenser Market Volume (K Unit), by Thailand 2025 & 2033
- Figure 53: Europe Southeast Asia Compressed Natural Gas Dispenser Market Revenue Share (%), by Thailand 2025 & 2033
- Figure 54: Europe Southeast Asia Compressed Natural Gas Dispenser Market Volume Share (%), by Thailand 2025 & 2033
- Figure 55: Europe Southeast Asia Compressed Natural Gas Dispenser Market Revenue (Million), by Singapore 2025 & 2033
- Figure 56: Europe Southeast Asia Compressed Natural Gas Dispenser Market Volume (K Unit), by Singapore 2025 & 2033
- Figure 57: Europe Southeast Asia Compressed Natural Gas Dispenser Market Revenue Share (%), by Singapore 2025 & 2033
- Figure 58: Europe Southeast Asia Compressed Natural Gas Dispenser Market Volume Share (%), by Singapore 2025 & 2033
- Figure 59: Europe Southeast Asia Compressed Natural Gas Dispenser Market Revenue (Million), by Indonesia 2025 & 2033
- Figure 60: Europe Southeast Asia Compressed Natural Gas Dispenser Market Volume (K Unit), by Indonesia 2025 & 2033
- Figure 61: Europe Southeast Asia Compressed Natural Gas Dispenser Market Revenue Share (%), by Indonesia 2025 & 2033
- Figure 62: Europe Southeast Asia Compressed Natural Gas Dispenser Market Volume Share (%), by Indonesia 2025 & 2033
- Figure 63: Europe Southeast Asia Compressed Natural Gas Dispenser Market Revenue (Million), by Malaysia 2025 & 2033
- Figure 64: Europe Southeast Asia Compressed Natural Gas Dispenser Market Volume (K Unit), by Malaysia 2025 & 2033
- Figure 65: Europe Southeast Asia Compressed Natural Gas Dispenser Market Revenue Share (%), by Malaysia 2025 & 2033
- Figure 66: Europe Southeast Asia Compressed Natural Gas Dispenser Market Volume Share (%), by Malaysia 2025 & 2033
- Figure 67: Europe Southeast Asia Compressed Natural Gas Dispenser Market Revenue (Million), by Rest of Southeast Asia 2025 & 2033
- Figure 68: Europe Southeast Asia Compressed Natural Gas Dispenser Market Volume (K Unit), by Rest of Southeast Asia 2025 & 2033
- Figure 69: Europe Southeast Asia Compressed Natural Gas Dispenser Market Revenue Share (%), by Rest of Southeast Asia 2025 & 2033
- Figure 70: Europe Southeast Asia Compressed Natural Gas Dispenser Market Volume Share (%), by Rest of Southeast Asia 2025 & 2033
- Figure 71: Europe Southeast Asia Compressed Natural Gas Dispenser Market Revenue (Million), by Country 2025 & 2033
- Figure 72: Europe Southeast Asia Compressed Natural Gas Dispenser Market Volume (K Unit), by Country 2025 & 2033
- Figure 73: Europe Southeast Asia Compressed Natural Gas Dispenser Market Revenue Share (%), by Country 2025 & 2033
- Figure 74: Europe Southeast Asia Compressed Natural Gas Dispenser Market Volume Share (%), by Country 2025 & 2033
- Figure 75: Middle East & Africa Southeast Asia Compressed Natural Gas Dispenser Market Revenue (Million), by Thailand 2025 & 2033
- Figure 76: Middle East & Africa Southeast Asia Compressed Natural Gas Dispenser Market Volume (K Unit), by Thailand 2025 & 2033
- Figure 77: Middle East & Africa Southeast Asia Compressed Natural Gas Dispenser Market Revenue Share (%), by Thailand 2025 & 2033
- Figure 78: Middle East & Africa Southeast Asia Compressed Natural Gas Dispenser Market Volume Share (%), by Thailand 2025 & 2033
- Figure 79: Middle East & Africa Southeast Asia Compressed Natural Gas Dispenser Market Revenue (Million), by Singapore 2025 & 2033
- Figure 80: Middle East & Africa Southeast Asia Compressed Natural Gas Dispenser Market Volume (K Unit), by Singapore 2025 & 2033
- Figure 81: Middle East & Africa Southeast Asia Compressed Natural Gas Dispenser Market Revenue Share (%), by Singapore 2025 & 2033
- Figure 82: Middle East & Africa Southeast Asia Compressed Natural Gas Dispenser Market Volume Share (%), by Singapore 2025 & 2033
- Figure 83: Middle East & Africa Southeast Asia Compressed Natural Gas Dispenser Market Revenue (Million), by Indonesia 2025 & 2033
- Figure 84: Middle East & Africa Southeast Asia Compressed Natural Gas Dispenser Market Volume (K Unit), by Indonesia 2025 & 2033
- Figure 85: Middle East & Africa Southeast Asia Compressed Natural Gas Dispenser Market Revenue Share (%), by Indonesia 2025 & 2033
- Figure 86: Middle East & Africa Southeast Asia Compressed Natural Gas Dispenser Market Volume Share (%), by Indonesia 2025 & 2033
- Figure 87: Middle East & Africa Southeast Asia Compressed Natural Gas Dispenser Market Revenue (Million), by Malaysia 2025 & 2033
- Figure 88: Middle East & Africa Southeast Asia Compressed Natural Gas Dispenser Market Volume (K Unit), by Malaysia 2025 & 2033
- Figure 89: Middle East & Africa Southeast Asia Compressed Natural Gas Dispenser Market Revenue Share (%), by Malaysia 2025 & 2033
- Figure 90: Middle East & Africa Southeast Asia Compressed Natural Gas Dispenser Market Volume Share (%), by Malaysia 2025 & 2033
- Figure 91: Middle East & Africa Southeast Asia Compressed Natural Gas Dispenser Market Revenue (Million), by Rest of Southeast Asia 2025 & 2033
- Figure 92: Middle East & Africa Southeast Asia Compressed Natural Gas Dispenser Market Volume (K Unit), by Rest of Southeast Asia 2025 & 2033
- Figure 93: Middle East & Africa Southeast Asia Compressed Natural Gas Dispenser Market Revenue Share (%), by Rest of Southeast Asia 2025 & 2033
- Figure 94: Middle East & Africa Southeast Asia Compressed Natural Gas Dispenser Market Volume Share (%), by Rest of Southeast Asia 2025 & 2033
- Figure 95: Middle East & Africa Southeast Asia Compressed Natural Gas Dispenser Market Revenue (Million), by Country 2025 & 2033
- Figure 96: Middle East & Africa Southeast Asia Compressed Natural Gas Dispenser Market Volume (K Unit), by Country 2025 & 2033
- Figure 97: Middle East & Africa Southeast Asia Compressed Natural Gas Dispenser Market Revenue Share (%), by Country 2025 & 2033
- Figure 98: Middle East & Africa Southeast Asia Compressed Natural Gas Dispenser Market Volume Share (%), by Country 2025 & 2033
- Figure 99: Asia Pacific Southeast Asia Compressed Natural Gas Dispenser Market Revenue (Million), by Thailand 2025 & 2033
- Figure 100: Asia Pacific Southeast Asia Compressed Natural Gas Dispenser Market Volume (K Unit), by Thailand 2025 & 2033
- Figure 101: Asia Pacific Southeast Asia Compressed Natural Gas Dispenser Market Revenue Share (%), by Thailand 2025 & 2033
- Figure 102: Asia Pacific Southeast Asia Compressed Natural Gas Dispenser Market Volume Share (%), by Thailand 2025 & 2033
- Figure 103: Asia Pacific Southeast Asia Compressed Natural Gas Dispenser Market Revenue (Million), by Singapore 2025 & 2033
- Figure 104: Asia Pacific Southeast Asia Compressed Natural Gas Dispenser Market Volume (K Unit), by Singapore 2025 & 2033
- Figure 105: Asia Pacific Southeast Asia Compressed Natural Gas Dispenser Market Revenue Share (%), by Singapore 2025 & 2033
- Figure 106: Asia Pacific Southeast Asia Compressed Natural Gas Dispenser Market Volume Share (%), by Singapore 2025 & 2033
- Figure 107: Asia Pacific Southeast Asia Compressed Natural Gas Dispenser Market Revenue (Million), by Indonesia 2025 & 2033
- Figure 108: Asia Pacific Southeast Asia Compressed Natural Gas Dispenser Market Volume (K Unit), by Indonesia 2025 & 2033
- Figure 109: Asia Pacific Southeast Asia Compressed Natural Gas Dispenser Market Revenue Share (%), by Indonesia 2025 & 2033
- Figure 110: Asia Pacific Southeast Asia Compressed Natural Gas Dispenser Market Volume Share (%), by Indonesia 2025 & 2033
- Figure 111: Asia Pacific Southeast Asia Compressed Natural Gas Dispenser Market Revenue (Million), by Malaysia 2025 & 2033
- Figure 112: Asia Pacific Southeast Asia Compressed Natural Gas Dispenser Market Volume (K Unit), by Malaysia 2025 & 2033
- Figure 113: Asia Pacific Southeast Asia Compressed Natural Gas Dispenser Market Revenue Share (%), by Malaysia 2025 & 2033
- Figure 114: Asia Pacific Southeast Asia Compressed Natural Gas Dispenser Market Volume Share (%), by Malaysia 2025 & 2033
- Figure 115: Asia Pacific Southeast Asia Compressed Natural Gas Dispenser Market Revenue (Million), by Rest of Southeast Asia 2025 & 2033
- Figure 116: Asia Pacific Southeast Asia Compressed Natural Gas Dispenser Market Volume (K Unit), by Rest of Southeast Asia 2025 & 2033
- Figure 117: Asia Pacific Southeast Asia Compressed Natural Gas Dispenser Market Revenue Share (%), by Rest of Southeast Asia 2025 & 2033
- Figure 118: Asia Pacific Southeast Asia Compressed Natural Gas Dispenser Market Volume Share (%), by Rest of Southeast Asia 2025 & 2033
- Figure 119: Asia Pacific Southeast Asia Compressed Natural Gas Dispenser Market Revenue (Million), by Country 2025 & 2033
- Figure 120: Asia Pacific Southeast Asia Compressed Natural Gas Dispenser Market Volume (K Unit), by Country 2025 & 2033
- Figure 121: Asia Pacific Southeast Asia Compressed Natural Gas Dispenser Market Revenue Share (%), by Country 2025 & 2033
- Figure 122: Asia Pacific Southeast Asia Compressed Natural Gas Dispenser Market Volume Share (%), by Country 2025 & 2033
List of Tables
- Table 1: Global Southeast Asia Compressed Natural Gas Dispenser Market Revenue Million Forecast, by Thailand 2020 & 2033
- Table 2: Global Southeast Asia Compressed Natural Gas Dispenser Market Volume K Unit Forecast, by Thailand 2020 & 2033
- Table 3: Global Southeast Asia Compressed Natural Gas Dispenser Market Revenue Million Forecast, by Singapore 2020 & 2033
- Table 4: Global Southeast Asia Compressed Natural Gas Dispenser Market Volume K Unit Forecast, by Singapore 2020 & 2033
- Table 5: Global Southeast Asia Compressed Natural Gas Dispenser Market Revenue Million Forecast, by Indonesia 2020 & 2033
- Table 6: Global Southeast Asia Compressed Natural Gas Dispenser Market Volume K Unit Forecast, by Indonesia 2020 & 2033
- Table 7: Global Southeast Asia Compressed Natural Gas Dispenser Market Revenue Million Forecast, by Malaysia 2020 & 2033
- Table 8: Global Southeast Asia Compressed Natural Gas Dispenser Market Volume K Unit Forecast, by Malaysia 2020 & 2033
- Table 9: Global Southeast Asia Compressed Natural Gas Dispenser Market Revenue Million Forecast, by Rest of Southeast Asia 2020 & 2033
- Table 10: Global Southeast Asia Compressed Natural Gas Dispenser Market Volume K Unit Forecast, by Rest of Southeast Asia 2020 & 2033
- Table 11: Global Southeast Asia Compressed Natural Gas Dispenser Market Revenue Million Forecast, by Region 2020 & 2033
- Table 12: Global Southeast Asia Compressed Natural Gas Dispenser Market Volume K Unit Forecast, by Region 2020 & 2033
- Table 13: Global Southeast Asia Compressed Natural Gas Dispenser Market Revenue Million Forecast, by Thailand 2020 & 2033
- Table 14: Global Southeast Asia Compressed Natural Gas Dispenser Market Volume K Unit Forecast, by Thailand 2020 & 2033
- Table 15: Global Southeast Asia Compressed Natural Gas Dispenser Market Revenue Million Forecast, by Singapore 2020 & 2033
- Table 16: Global Southeast Asia Compressed Natural Gas Dispenser Market Volume K Unit Forecast, by Singapore 2020 & 2033
- Table 17: Global Southeast Asia Compressed Natural Gas Dispenser Market Revenue Million Forecast, by Indonesia 2020 & 2033
- Table 18: Global Southeast Asia Compressed Natural Gas Dispenser Market Volume K Unit Forecast, by Indonesia 2020 & 2033
- Table 19: Global Southeast Asia Compressed Natural Gas Dispenser Market Revenue Million Forecast, by Malaysia 2020 & 2033
- Table 20: Global Southeast Asia Compressed Natural Gas Dispenser Market Volume K Unit Forecast, by Malaysia 2020 & 2033
- Table 21: Global Southeast Asia Compressed Natural Gas Dispenser Market Revenue Million Forecast, by Rest of Southeast Asia 2020 & 2033
- Table 22: Global Southeast Asia Compressed Natural Gas Dispenser Market Volume K Unit Forecast, by Rest of Southeast Asia 2020 & 2033
- Table 23: Global Southeast Asia Compressed Natural Gas Dispenser Market Revenue Million Forecast, by Country 2020 & 2033
- Table 24: Global Southeast Asia Compressed Natural Gas Dispenser Market Volume K Unit Forecast, by Country 2020 & 2033
- Table 25: United States Southeast Asia Compressed Natural Gas Dispenser Market Revenue (Million) Forecast, by Application 2020 & 2033
- Table 26: United States Southeast Asia Compressed Natural Gas Dispenser Market Volume (K Unit) Forecast, by Application 2020 & 2033
- Table 27: Canada Southeast Asia Compressed Natural Gas Dispenser Market Revenue (Million) Forecast, by Application 2020 & 2033
- Table 28: Canada Southeast Asia Compressed Natural Gas Dispenser Market Volume (K Unit) Forecast, by Application 2020 & 2033
- Table 29: Mexico Southeast Asia Compressed Natural Gas Dispenser Market Revenue (Million) Forecast, by Application 2020 & 2033
- Table 30: Mexico Southeast Asia Compressed Natural Gas Dispenser Market Volume (K Unit) Forecast, by Application 2020 & 2033
- Table 31: Global Southeast Asia Compressed Natural Gas Dispenser Market Revenue Million Forecast, by Thailand 2020 & 2033
- Table 32: Global Southeast Asia Compressed Natural Gas Dispenser Market Volume K Unit Forecast, by Thailand 2020 & 2033
- Table 33: Global Southeast Asia Compressed Natural Gas Dispenser Market Revenue Million Forecast, by Singapore 2020 & 2033
- Table 34: Global Southeast Asia Compressed Natural Gas Dispenser Market Volume K Unit Forecast, by Singapore 2020 & 2033
- Table 35: Global Southeast Asia Compressed Natural Gas Dispenser Market Revenue Million Forecast, by Indonesia 2020 & 2033
- Table 36: Global Southeast Asia Compressed Natural Gas Dispenser Market Volume K Unit Forecast, by Indonesia 2020 & 2033
- Table 37: Global Southeast Asia Compressed Natural Gas Dispenser Market Revenue Million Forecast, by Malaysia 2020 & 2033
- Table 38: Global Southeast Asia Compressed Natural Gas Dispenser Market Volume K Unit Forecast, by Malaysia 2020 & 2033
- Table 39: Global Southeast Asia Compressed Natural Gas Dispenser Market Revenue Million Forecast, by Rest of Southeast Asia 2020 & 2033
- Table 40: Global Southeast Asia Compressed Natural Gas Dispenser Market Volume K Unit Forecast, by Rest of Southeast Asia 2020 & 2033
- Table 41: Global Southeast Asia Compressed Natural Gas Dispenser Market Revenue Million Forecast, by Country 2020 & 2033
- Table 42: Global Southeast Asia Compressed Natural Gas Dispenser Market Volume K Unit Forecast, by Country 2020 & 2033
- Table 43: Brazil Southeast Asia Compressed Natural Gas Dispenser Market Revenue (Million) Forecast, by Application 2020 & 2033
- Table 44: Brazil Southeast Asia Compressed Natural Gas Dispenser Market Volume (K Unit) Forecast, by Application 2020 & 2033
- Table 45: Argentina Southeast Asia Compressed Natural Gas Dispenser Market Revenue (Million) Forecast, by Application 2020 & 2033
- Table 46: Argentina Southeast Asia Compressed Natural Gas Dispenser Market Volume (K Unit) Forecast, by Application 2020 & 2033
- Table 47: Rest of South America Southeast Asia Compressed Natural Gas Dispenser Market Revenue (Million) Forecast, by Application 2020 & 2033
- Table 48: Rest of South America Southeast Asia Compressed Natural Gas Dispenser Market Volume (K Unit) Forecast, by Application 2020 & 2033
- Table 49: Global Southeast Asia Compressed Natural Gas Dispenser Market Revenue Million Forecast, by Thailand 2020 & 2033
- Table 50: Global Southeast Asia Compressed Natural Gas Dispenser Market Volume K Unit Forecast, by Thailand 2020 & 2033
- Table 51: Global Southeast Asia Compressed Natural Gas Dispenser Market Revenue Million Forecast, by Singapore 2020 & 2033
- Table 52: Global Southeast Asia Compressed Natural Gas Dispenser Market Volume K Unit Forecast, by Singapore 2020 & 2033
- Table 53: Global Southeast Asia Compressed Natural Gas Dispenser Market Revenue Million Forecast, by Indonesia 2020 & 2033
- Table 54: Global Southeast Asia Compressed Natural Gas Dispenser Market Volume K Unit Forecast, by Indonesia 2020 & 2033
- Table 55: Global Southeast Asia Compressed Natural Gas Dispenser Market Revenue Million Forecast, by Malaysia 2020 & 2033
- Table 56: Global Southeast Asia Compressed Natural Gas Dispenser Market Volume K Unit Forecast, by Malaysia 2020 & 2033
- Table 57: Global Southeast Asia Compressed Natural Gas Dispenser Market Revenue Million Forecast, by Rest of Southeast Asia 2020 & 2033
- Table 58: Global Southeast Asia Compressed Natural Gas Dispenser Market Volume K Unit Forecast, by Rest of Southeast Asia 2020 & 2033
- Table 59: Global Southeast Asia Compressed Natural Gas Dispenser Market Revenue Million Forecast, by Country 2020 & 2033
- Table 60: Global Southeast Asia Compressed Natural Gas Dispenser Market Volume K Unit Forecast, by Country 2020 & 2033
- Table 61: United Kingdom Southeast Asia Compressed Natural Gas Dispenser Market Revenue (Million) Forecast, by Application 2020 & 2033
- Table 62: United Kingdom Southeast Asia Compressed Natural Gas Dispenser Market Volume (K Unit) Forecast, by Application 2020 & 2033
- Table 63: Germany Southeast Asia Compressed Natural Gas Dispenser Market Revenue (Million) Forecast, by Application 2020 & 2033
- Table 64: Germany Southeast Asia Compressed Natural Gas Dispenser Market Volume (K Unit) Forecast, by Application 2020 & 2033
- Table 65: France Southeast Asia Compressed Natural Gas Dispenser Market Revenue (Million) Forecast, by Application 2020 & 2033
- Table 66: France Southeast Asia Compressed Natural Gas Dispenser Market Volume (K Unit) Forecast, by Application 2020 & 2033
- Table 67: Italy Southeast Asia Compressed Natural Gas Dispenser Market Revenue (Million) Forecast, by Application 2020 & 2033
- Table 68: Italy Southeast Asia Compressed Natural Gas Dispenser Market Volume (K Unit) Forecast, by Application 2020 & 2033
- Table 69: Spain Southeast Asia Compressed Natural Gas Dispenser Market Revenue (Million) Forecast, by Application 2020 & 2033
- Table 70: Spain Southeast Asia Compressed Natural Gas Dispenser Market Volume (K Unit) Forecast, by Application 2020 & 2033
- Table 71: Russia Southeast Asia Compressed Natural Gas Dispenser Market Revenue (Million) Forecast, by Application 2020 & 2033
- Table 72: Russia Southeast Asia Compressed Natural Gas Dispenser Market Volume (K Unit) Forecast, by Application 2020 & 2033
- Table 73: Benelux Southeast Asia Compressed Natural Gas Dispenser Market Revenue (Million) Forecast, by Application 2020 & 2033
- Table 74: Benelux Southeast Asia Compressed Natural Gas Dispenser Market Volume (K Unit) Forecast, by Application 2020 & 2033
- Table 75: Nordics Southeast Asia Compressed Natural Gas Dispenser Market Revenue (Million) Forecast, by Application 2020 & 2033
- Table 76: Nordics Southeast Asia Compressed Natural Gas Dispenser Market Volume (K Unit) Forecast, by Application 2020 & 2033
- Table 77: Rest of Europe Southeast Asia Compressed Natural Gas Dispenser Market Revenue (Million) Forecast, by Application 2020 & 2033
- Table 78: Rest of Europe Southeast Asia Compressed Natural Gas Dispenser Market Volume (K Unit) Forecast, by Application 2020 & 2033
- Table 79: Global Southeast Asia Compressed Natural Gas Dispenser Market Revenue Million Forecast, by Thailand 2020 & 2033
- Table 80: Global Southeast Asia Compressed Natural Gas Dispenser Market Volume K Unit Forecast, by Thailand 2020 & 2033
- Table 81: Global Southeast Asia Compressed Natural Gas Dispenser Market Revenue Million Forecast, by Singapore 2020 & 2033
- Table 82: Global Southeast Asia Compressed Natural Gas Dispenser Market Volume K Unit Forecast, by Singapore 2020 & 2033
- Table 83: Global Southeast Asia Compressed Natural Gas Dispenser Market Revenue Million Forecast, by Indonesia 2020 & 2033
- Table 84: Global Southeast Asia Compressed Natural Gas Dispenser Market Volume K Unit Forecast, by Indonesia 2020 & 2033
- Table 85: Global Southeast Asia Compressed Natural Gas Dispenser Market Revenue Million Forecast, by Malaysia 2020 & 2033
- Table 86: Global Southeast Asia Compressed Natural Gas Dispenser Market Volume K Unit Forecast, by Malaysia 2020 & 2033
- Table 87: Global Southeast Asia Compressed Natural Gas Dispenser Market Revenue Million Forecast, by Rest of Southeast Asia 2020 & 2033
- Table 88: Global Southeast Asia Compressed Natural Gas Dispenser Market Volume K Unit Forecast, by Rest of Southeast Asia 2020 & 2033
- Table 89: Global Southeast Asia Compressed Natural Gas Dispenser Market Revenue Million Forecast, by Country 2020 & 2033
- Table 90: Global Southeast Asia Compressed Natural Gas Dispenser Market Volume K Unit Forecast, by Country 2020 & 2033
- Table 91: Turkey Southeast Asia Compressed Natural Gas Dispenser Market Revenue (Million) Forecast, by Application 2020 & 2033
- Table 92: Turkey Southeast Asia Compressed Natural Gas Dispenser Market Volume (K Unit) Forecast, by Application 2020 & 2033
- Table 93: Israel Southeast Asia Compressed Natural Gas Dispenser Market Revenue (Million) Forecast, by Application 2020 & 2033
- Table 94: Israel Southeast Asia Compressed Natural Gas Dispenser Market Volume (K Unit) Forecast, by Application 2020 & 2033
- Table 95: GCC Southeast Asia Compressed Natural Gas Dispenser Market Revenue (Million) Forecast, by Application 2020 & 2033
- Table 96: GCC Southeast Asia Compressed Natural Gas Dispenser Market Volume (K Unit) Forecast, by Application 2020 & 2033
- Table 97: North Africa Southeast Asia Compressed Natural Gas Dispenser Market Revenue (Million) Forecast, by Application 2020 & 2033
- Table 98: North Africa Southeast Asia Compressed Natural Gas Dispenser Market Volume (K Unit) Forecast, by Application 2020 & 2033
- Table 99: South Africa Southeast Asia Compressed Natural Gas Dispenser Market Revenue (Million) Forecast, by Application 2020 & 2033
- Table 100: South Africa Southeast Asia Compressed Natural Gas Dispenser Market Volume (K Unit) Forecast, by Application 2020 & 2033
- Table 101: Rest of Middle East & Africa Southeast Asia Compressed Natural Gas Dispenser Market Revenue (Million) Forecast, by Application 2020 & 2033
- Table 102: Rest of Middle East & Africa Southeast Asia Compressed Natural Gas Dispenser Market Volume (K Unit) Forecast, by Application 2020 & 2033
- Table 103: Global Southeast Asia Compressed Natural Gas Dispenser Market Revenue Million Forecast, by Thailand 2020 & 2033
- Table 104: Global Southeast Asia Compressed Natural Gas Dispenser Market Volume K Unit Forecast, by Thailand 2020 & 2033
- Table 105: Global Southeast Asia Compressed Natural Gas Dispenser Market Revenue Million Forecast, by Singapore 2020 & 2033
- Table 106: Global Southeast Asia Compressed Natural Gas Dispenser Market Volume K Unit Forecast, by Singapore 2020 & 2033
- Table 107: Global Southeast Asia Compressed Natural Gas Dispenser Market Revenue Million Forecast, by Indonesia 2020 & 2033
- Table 108: Global Southeast Asia Compressed Natural Gas Dispenser Market Volume K Unit Forecast, by Indonesia 2020 & 2033
- Table 109: Global Southeast Asia Compressed Natural Gas Dispenser Market Revenue Million Forecast, by Malaysia 2020 & 2033
- Table 110: Global Southeast Asia Compressed Natural Gas Dispenser Market Volume K Unit Forecast, by Malaysia 2020 & 2033
- Table 111: Global Southeast Asia Compressed Natural Gas Dispenser Market Revenue Million Forecast, by Rest of Southeast Asia 2020 & 2033
- Table 112: Global Southeast Asia Compressed Natural Gas Dispenser Market Volume K Unit Forecast, by Rest of Southeast Asia 2020 & 2033
- Table 113: Global Southeast Asia Compressed Natural Gas Dispenser Market Revenue Million Forecast, by Country 2020 & 2033
- Table 114: Global Southeast Asia Compressed Natural Gas Dispenser Market Volume K Unit Forecast, by Country 2020 & 2033
- Table 115: China Southeast Asia Compressed Natural Gas Dispenser Market Revenue (Million) Forecast, by Application 2020 & 2033
- Table 116: China Southeast Asia Compressed Natural Gas Dispenser Market Volume (K Unit) Forecast, by Application 2020 & 2033
- Table 117: India Southeast Asia Compressed Natural Gas Dispenser Market Revenue (Million) Forecast, by Application 2020 & 2033
- Table 118: India Southeast Asia Compressed Natural Gas Dispenser Market Volume (K Unit) Forecast, by Application 2020 & 2033
- Table 119: Japan Southeast Asia Compressed Natural Gas Dispenser Market Revenue (Million) Forecast, by Application 2020 & 2033
- Table 120: Japan Southeast Asia Compressed Natural Gas Dispenser Market Volume (K Unit) Forecast, by Application 2020 & 2033
- Table 121: South Korea Southeast Asia Compressed Natural Gas Dispenser Market Revenue (Million) Forecast, by Application 2020 & 2033
- Table 122: South Korea Southeast Asia Compressed Natural Gas Dispenser Market Volume (K Unit) Forecast, by Application 2020 & 2033
- Table 123: ASEAN Southeast Asia Compressed Natural Gas Dispenser Market Revenue (Million) Forecast, by Application 2020 & 2033
- Table 124: ASEAN Southeast Asia Compressed Natural Gas Dispenser Market Volume (K Unit) Forecast, by Application 2020 & 2033
- Table 125: Oceania Southeast Asia Compressed Natural Gas Dispenser Market Revenue (Million) Forecast, by Application 2020 & 2033
- Table 126: Oceania Southeast Asia Compressed Natural Gas Dispenser Market Volume (K Unit) Forecast, by Application 2020 & 2033
- Table 127: Rest of Asia Pacific Southeast Asia Compressed Natural Gas Dispenser Market Revenue (Million) Forecast, by Application 2020 & 2033
- Table 128: Rest of Asia Pacific Southeast Asia Compressed Natural Gas Dispenser Market Volume (K Unit) Forecast, by Application 2020 & 2033
Frequently Asked Questions
1. What is the projected Compound Annual Growth Rate (CAGR) of the Southeast Asia Compressed Natural Gas Dispenser Market?
The projected CAGR is approximately 8.39%.
2. Which companies are prominent players in the Southeast Asia Compressed Natural Gas Dispenser Market?
Key companies in the market include Censtar Science & Technology Co Ltd, ComTech Energy, Scheidt & Bachmann Gmbh, Sanki Industry Group, Tatsuno Europe AS, TGT Fuel Technologies India Pvt Ltd , Gilbarco Inc, Greka Engineering, FTI International Group Inc, Parker Hannifin Corp.
3. What are the main segments of the Southeast Asia Compressed Natural Gas Dispenser Market?
The market segments include Thailand, Singapore, Indonesia, Malaysia, Rest of Southeast Asia.
4. Can you provide details about the market size?
The market size is estimated to be USD 38.22 Million as of 2022.
5. What are some drivers contributing to market growth?
4.; Growing Demand for Compressed Natural Gas.
6. What are the notable trends driving market growth?
Increasing Natural Gas Consumption Expected to Drive the Market.
7. Are there any restraints impacting market growth?
4.; Rising Alternate Fuel Sources such as Batteries.
8. Can you provide examples of recent developments in the market?
N/A
9. What pricing options are available for accessing the report?
Pricing options include single-user, multi-user, and enterprise licenses priced at USD 4750, USD 5250, and USD 8750 respectively.
10. Is the market size provided in terms of value or volume?
The market size is provided in terms of value, measured in Million and volume, measured in K Unit.
11. Are there any specific market keywords associated with the report?
Yes, the market keyword associated with the report is "Southeast Asia Compressed Natural Gas Dispenser Market," which aids in identifying and referencing the specific market segment covered.
12. How do I determine which pricing option suits my needs best?
The pricing options vary based on user requirements and access needs. Individual users may opt for single-user licenses, while businesses requiring broader access may choose multi-user or enterprise licenses for cost-effective access to the report.
13. Are there any additional resources or data provided in the Southeast Asia Compressed Natural Gas Dispenser Market report?
While the report offers comprehensive insights, it's advisable to review the specific contents or supplementary materials provided to ascertain if additional resources or data are available.
14. How can I stay updated on further developments or reports in the Southeast Asia Compressed Natural Gas Dispenser Market?
To stay informed about further developments, trends, and reports in the Southeast Asia Compressed Natural Gas Dispenser Market, consider subscribing to industry newsletters, following relevant companies and organizations, or regularly checking reputable industry news sources and publications.
Methodology
Step 1 - Identification of Relevant Samples Size from Population Database


Step 2 - Approaches for Defining Global Market Size (Value, Volume* & Price*)

Note*: In applicable scenarios
Step 3 - Data Sources
Primary Research
- Web Analytics
- Survey Reports
- Research Institute
- Latest Research Reports
- Opinion Leaders
Secondary Research
- Annual Reports
- White Paper
- Latest Press Release
- Industry Association
- Paid Database
- Investor Presentations

Step 4 - Data Triangulation
Involves using different sources of information in order to increase the validity of a study
These sources are likely to be stakeholders in a program - participants, other researchers, program staff, other community members, and so on.
Then we put all data in single framework & apply various statistical tools to find out the dynamic on the market.
During the analysis stage, feedback from the stakeholder groups would be compared to determine areas of agreement as well as areas of divergence