

Key Insights
The Specialty Picture Archiving and Communication System (PACS) market is poised for significant expansion, projected to reach an estimated $5.31 billion in 2025. This robust growth is underpinned by a compelling Compound Annual Growth Rate (CAGR) of 8.5%, indicating sustained momentum throughout the forecast period of 2025-2033. The increasing prevalence of chronic diseases and the growing demand for advanced diagnostic imaging solutions are primary drivers of this upward trajectory. Advancements in AI-powered image analysis, cloud integration for enhanced accessibility and collaboration, and the development of specialized PACS for fields like oncology and orthopedics are further fueling market adoption. The ongoing digitalization of healthcare infrastructure and the subsequent need for efficient management of voluminous medical imaging data are also critical factors contributing to the market's positive outlook.
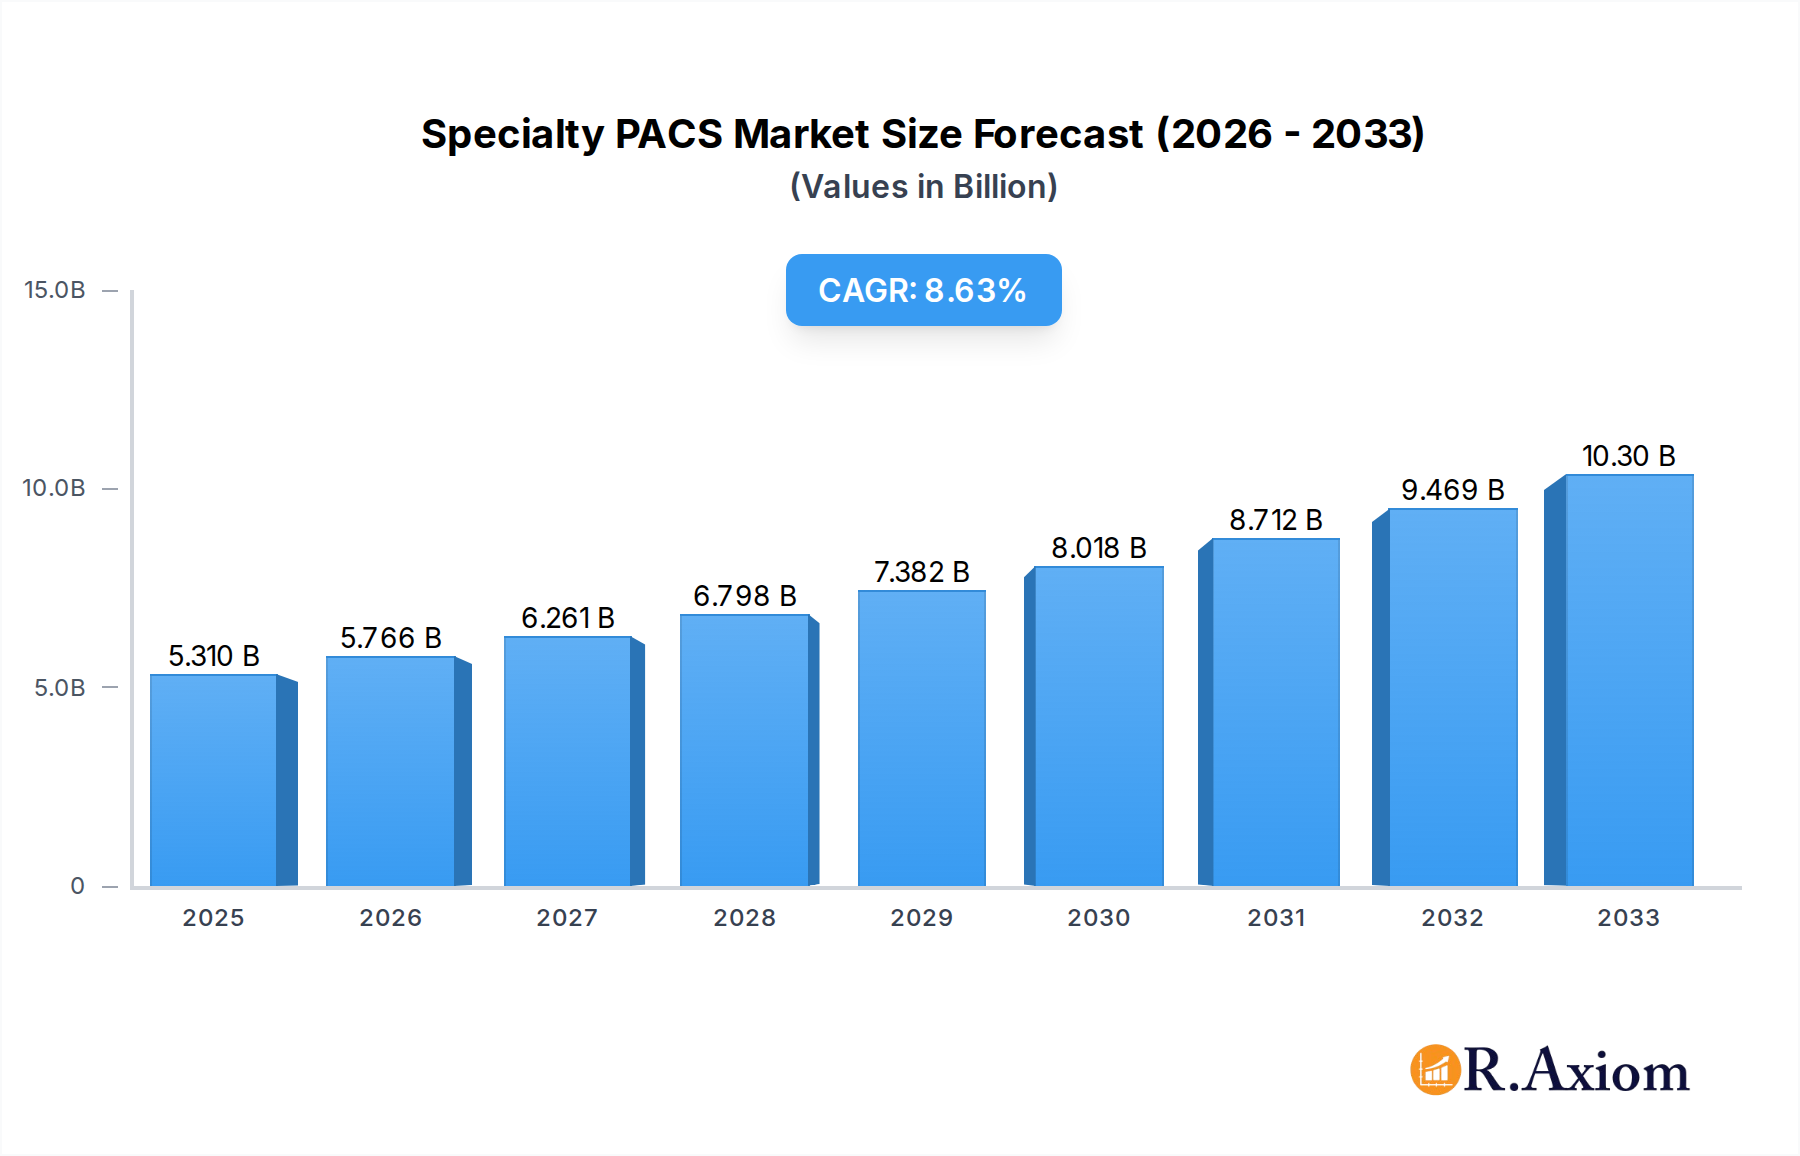
Specialty PACS Market Market Size (In Billion)
Key market segments are anticipated to witness substantial growth. The Cardiovascular PACS segment, driven by the rising incidence of heart disease, is expected to be a major contributor. Similarly, Orthopedic PACS are experiencing increased demand due to the aging global population and the growing number of sports-related injuries. The Oncology PACS segment is also a critical area, supporting advanced cancer diagnosis and treatment planning. In terms of components, software solutions, including AI-enabled analytics, will likely dominate, followed by services and hardware. The shift towards web/cloud-based specialty PACS is a prominent trend, offering greater flexibility, scalability, and cost-effectiveness compared to traditional on-premise solutions. Hospitals and diagnostic centers represent the primary end-users, leveraging these systems to improve diagnostic accuracy, streamline workflows, and enhance patient care outcomes across various medical specialties.

Specialty PACS Market Company Market Share
This in-depth report provides a thorough analysis of the global Specialty Picture Archiving and Communication Systems (PACS) market, offering critical insights for stakeholders navigating this dynamic sector. Covering a study period from 2019 to 2033, with a base year of 2025 and a forecast period of 2025-2033, this report examines market dynamics, competitive landscapes, and future growth trajectories. The market is projected to reach an estimated value of USD XX billion by 2025, with significant growth anticipated in the coming years, driven by advancements in medical imaging, increasing demand for specialized diagnostic solutions, and the evolving needs of healthcare providers worldwide.
Specialty PACS Market Market Concentration & Innovation
The Specialty PACS market exhibits a moderate level of concentration, characterized by the presence of both established giants and agile niche players. Innovation is a primary driver, fueled by the escalating complexity of medical imaging modalities and the demand for highly specialized diagnostic workflows. Key innovation areas include the integration of artificial intelligence (AI) for advanced image analysis, enhanced workflow automation, and the development of vendor-neutral archiving solutions. Regulatory frameworks, such as HIPAA in the US and GDPR in Europe, play a crucial role in shaping product development and market entry, emphasizing data security and patient privacy. Product substitutes, while less prevalent for highly specialized PACS, can include integrated RIS/PACS solutions or rudimentary image management systems in less developed markets. End-user trends are shifting towards cloud-based solutions, remote access capabilities, and interoperability across diverse healthcare IT infrastructures. Mergers and acquisitions (M&A) activities are prevalent as larger players seek to expand their portfolios, acquire innovative technologies, and gain market share. For instance, recent M&A deals in the broader PACS and healthcare IT sector have involved values in the range of USD XX billion to USD XX billion, indicating a robust consolidation trend. Market share is fragmented, with leading companies holding significant portions, particularly in specific specialty segments.
Specialty PACS Market Industry Trends & Insights
The Specialty PACS market is poised for substantial growth, driven by a confluence of technological advancements, increasing healthcare expenditures, and the growing prevalence of chronic diseases. The market's trajectory is significantly influenced by the rapid evolution of medical imaging technologies, including higher resolution scanners, multi-slice CT, advanced MRI sequences, and sophisticated ultrasound equipment. This technological proliferation necessitates advanced PACS solutions capable of handling vast volumes of complex data and facilitating detailed analysis. Furthermore, the global rise in diagnostic imaging procedures, propelled by an aging population and a greater emphasis on early disease detection and personalized medicine, is a primary growth catalyst. The oncology PACS segment, for example, is experiencing a surge in demand due to the increasing incidence of cancer and the need for sophisticated tools to manage and interpret imaging data for treatment planning and monitoring. Similarly, the cardiovascular PACS market benefits from the growing burden of cardiovascular diseases and the continuous innovation in cardiac imaging techniques.
Technological disruptions are profoundly shaping the industry. The integration of artificial intelligence (AI) and machine learning (ML) algorithms is revolutionizing image interpretation, offering enhanced diagnostic accuracy, workflow efficiency, and the potential for predictive analytics. Cloud-based Specialty PACS solutions are gaining significant traction, offering scalability, flexibility, cost-effectiveness, and enhanced accessibility for healthcare providers. These cloud platforms enable seamless data sharing and remote access, crucial for collaborative care and teleradiology. Consumer preferences are increasingly dictating market trends, with healthcare providers demanding user-friendly interfaces, robust interoperability with existing Electronic Health Records (EHR) systems, and comprehensive data security. The competitive dynamics are intensifying, with companies striving to differentiate through specialized features, superior customer support, and integrated service offerings. The market penetration of advanced Specialty PACS solutions is steadily increasing, particularly in developed economies, while emerging economies represent significant untapped potential for future expansion. The compound annual growth rate (CAGR) for the Specialty PACS market is estimated to be in the range of XX% to XX% during the forecast period.
Dominant Markets & Segments in Specialty PACS Market
The Specialty PACS market is characterized by distinct regional dominance and segment leadership, driven by a combination of healthcare infrastructure, economic policies, and technological adoption rates.
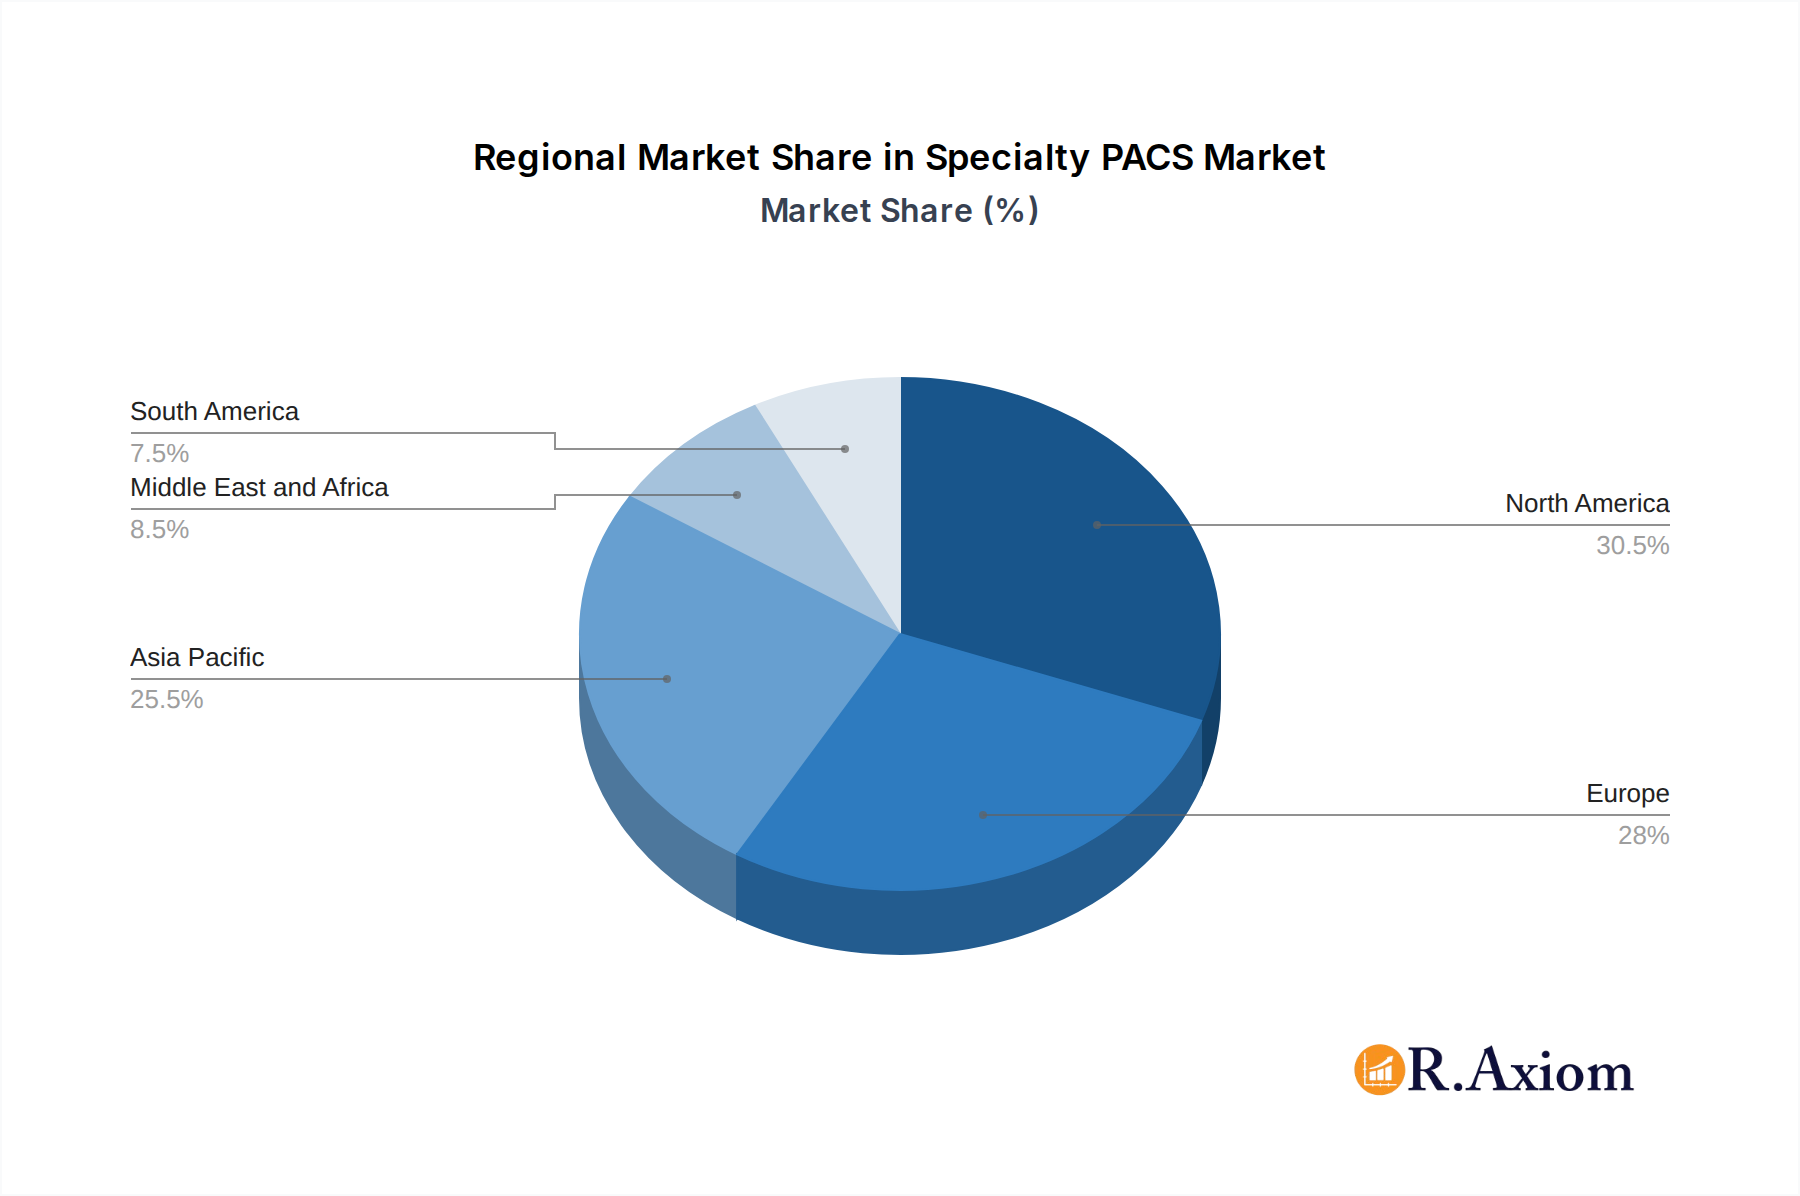
Leading Region: North America currently dominates the Specialty PACS market, largely due to its advanced healthcare infrastructure, high adoption rates of cutting-edge medical technologies, robust research and development activities, and significant government and private investment in healthcare IT. The United States, in particular, with its large patient population and well-established healthcare systems, is a primary contributor to this regional dominance.
Dominant Segments:
Type:
- Cardiovascular PACS: This segment holds a significant market share due to the high prevalence of cardiovascular diseases globally and the critical role of imaging in their diagnosis and management. Continuous advancements in cardiac imaging modalities, such as advanced MRI, CT angiography, and echocardiography, further fuel demand.
- Oncology PACS: The increasing incidence of cancer worldwide and the growing need for sophisticated tools for diagnosis, treatment planning, and follow-up imaging contribute to the strong performance of this segment. AI-powered analysis for oncology imaging is a key growth driver.
Component:
- Software: Software solutions represent the largest segment within Specialty PACS. This includes the core PACS application, image viewers, analysis tools, workflow management modules, and AI algorithms. The continuous development of advanced functionalities and integration capabilities drives software segment growth.
- Services: Services, encompassing implementation, training, maintenance, support, and cloud hosting, constitute a substantial portion of the market. As healthcare providers increasingly rely on these systems, the demand for expert services to ensure optimal operation and integration is high.
Development:
- Web/Cloud-based Specialty PACS: The trend towards cloud-based solutions is rapidly accelerating, making this the fastest-growing development segment. Cloud PACS offer scalability, cost-effectiveness, remote accessibility, and reduced IT burden for healthcare institutions, aligning with modern healthcare IT strategies.
End User:
- Hospitals: Hospitals remain the largest end-user segment for Specialty PACS. Their comprehensive diagnostic needs, large patient volumes, and the necessity for integrated imaging workflows across various specialties make them primary adopters. The ongoing expansion and modernization of hospital facilities further bolster demand.
Economic policies in developed nations, such as favorable reimbursement rates for advanced imaging procedures and government initiatives promoting healthcare digitalization, support market growth. Infrastructure development, particularly in telecommunications and cloud computing, is crucial for the widespread adoption of web/cloud-based solutions, enabling seamless data transfer and access. The market penetration is high in North America and Europe, with Asia-Pacific emerging as a region with significant growth potential due to increasing healthcare investments and a growing demand for quality medical imaging services.
Specialty PACS Market Product Developments
Product developments in the Specialty PACS market are characterized by a strong focus on enhancing diagnostic capabilities, improving workflow efficiency, and ensuring seamless integration. Innovations include the incorporation of advanced AI algorithms for automated image segmentation, lesion detection, and quantitative analysis in specialized areas like oncology and cardiology. The development of vendor-neutral archive (VNA) solutions that can manage imaging data from various modalities and vendors is also a key trend, promoting interoperability and reducing data silos. Furthermore, advancements in user interface design and mobile access capabilities are enhancing the usability and accessibility of PACS for healthcare professionals, enabling real-time image review and collaboration. These developments aim to provide a competitive advantage by offering more intelligent, efficient, and integrated imaging solutions tailored to the specific needs of different medical specialties.
Report Scope & Segmentation Analysis
This report provides a comprehensive analysis of the Specialty PACS market, segmented across key parameters to offer granular insights. The segmentation includes:
Type: The report delves into the market dynamics of Cardiovascular PACS, Orthopedic PACS, Oncology PACS, and Other Types of Specialty PACS. Each segment's growth drivers, market size, and competitive landscape are analyzed. Cardiovascular PACS is expected to witness steady growth due to the high disease burden, while Oncology PACS is projected for rapid expansion driven by advancements in cancer diagnostics.
Component: The market is dissected by Component, encompassing Software, Services, and Hardware. The Software segment is anticipated to dominate due to ongoing feature enhancements and AI integration. The Services segment, including implementation and support, will also show robust growth, while hardware components will see incremental advancements.
Development: The analysis covers both On-premise Specialty PACS and Web/Cloud-based Specialty PACS. The Web/Cloud-based segment is projected to be the fastest-growing, driven by its inherent scalability, accessibility, and cost-effectiveness, aligning with the modern healthcare IT paradigm.
End User: Key end users analyzed include Hospitals, Diagnostic Centers, and Other End Users. Hospitals are expected to remain the largest segment due to their extensive imaging needs and integrated healthcare systems. Diagnostic centers are also significant contributors, with specialized imaging facilities driving demand.
Key Drivers of Specialty PACS Market Growth
The Specialty PACS market is propelled by several key drivers:
- Technological Advancements: Continuous innovation in medical imaging modalities (e.g., higher resolution MRI/CT, advanced ultrasound) necessitates sophisticated PACS for data management and analysis. The integration of Artificial Intelligence (AI) and Machine Learning (ML) for image interpretation and workflow automation is a significant growth catalyst.
- Increasing Prevalence of Chronic Diseases: The rising incidence of conditions like cardiovascular diseases and cancer drives demand for specialized imaging and associated PACS solutions for accurate diagnosis, treatment planning, and monitoring.
- Growing Healthcare Expenditure and Infrastructure Development: Increased investments in healthcare infrastructure, particularly in emerging economies, and rising healthcare expenditure globally are fueling the adoption of advanced PACS technologies.
- Demand for Enhanced Diagnostic Accuracy and Efficiency: Healthcare providers are seeking PACS solutions that improve diagnostic accuracy, reduce interpretation times, and streamline clinical workflows, leading to better patient outcomes.
- Government Initiatives and Regulations: Favorable government policies promoting healthcare digitalization and interoperability, along with stringent regulatory requirements for data security and patient privacy, indirectly support the adoption of robust PACS solutions.
Challenges in the Specialty PACS Market Sector
Despite its strong growth potential, the Specialty PACS market faces several challenges:
- High Implementation and Maintenance Costs: The initial investment in Specialty PACS software, hardware, and ongoing maintenance and support services can be substantial, posing a barrier for smaller healthcare providers or those in resource-constrained regions.
- Interoperability Issues: Integrating Specialty PACS with existing heterogeneous IT systems, including EHRs and other departmental systems, can be complex and challenging, leading to data silos and workflow inefficiencies.
- Data Security and Privacy Concerns: The increasing volume of sensitive patient data managed by PACS raises significant concerns regarding cybersecurity threats, data breaches, and compliance with evolving data privacy regulations.
- Shortage of Skilled Personnel: A lack of adequately trained radiologists, IT professionals, and PACS administrators capable of effectively operating, managing, and maintaining these complex systems can hinder adoption and optimal utilization.
- Resistance to Change and Workflow Disruption: Healthcare institutions may face resistance from staff accustomed to traditional workflows, requiring significant change management efforts and comprehensive training to ensure successful adoption of new PACS technologies.
Emerging Opportunities in Specialty PACS Market
The Specialty PACS market is ripe with emerging opportunities:
- AI-driven Diagnostic Tools: The integration of advanced AI algorithms for image analysis, anomaly detection, and predictive diagnostics presents a significant opportunity to enhance diagnostic accuracy and efficiency, particularly in specialties like radiology, pathology, and ophthalmology.
- Cloud-based and Hybrid PACS Solutions: The growing preference for scalable, flexible, and accessible cloud-based solutions, coupled with the demand for hybrid models that blend on-premise and cloud capabilities, offers considerable market potential.
- Expansion in Emerging Economies: Developing regions with increasing healthcare investments and a growing demand for advanced medical imaging services represent substantial untapped markets for Specialty PACS adoption.
- Interoperability and Vendor-Neutral Archiving (VNA): The increasing focus on seamless data exchange and the need to manage imaging data from diverse sources are driving the demand for VNA solutions and improved interoperability standards.
- Personalized Medicine and Genomics Integration: The convergence of medical imaging with genomic data and personalized medicine initiatives will create opportunities for PACS systems capable of integrating and analyzing multi-modal patient information.
Leading Players in the Specialty PACS Market Market
- Sectra AB
- IBM Corporation
- Novarad
- Topcon Corporation
- Siemens AG
- Philips Healthcare
- Canon USA Inc
- Agfa Healthcare
- McKesson Corporation
- Fujifilm Holdings Corporation (Fujifilm Medical Systems)
Key Developments in Specialty PACS Market Industry
- April 2022: FUJIFILM Healthcare Americas Corporation installed Fujifilm's Synapse Cardiology PACS version 7 throughout Emory Healthcare facilities to store, process, and analyze heart and vascular imaging. Emory Healthcare is the most comprehensive academic health system in Georgia.
- March 2022: Intelerad Medical Systems launched its new Enterprise Imaging and Informatics Suite at the 2022 HIMSS Global Health Conference & Exhibition. This suite is developed to empower hospitals and health systems to break down siloed data and create a seamless, vendor-neutral information hub, integrating vital patient data across the entire healthcare ecosystem.
Strategic Outlook for Specialty PACS Market Market
The strategic outlook for the Specialty PACS market is overwhelmingly positive, driven by ongoing technological advancements and an ever-increasing demand for sophisticated diagnostic imaging solutions. The continued integration of Artificial Intelligence and Machine Learning into PACS platforms promises to revolutionize image analysis, leading to earlier and more accurate diagnoses. The shift towards cloud-based and hybrid PACS models will further enhance accessibility, scalability, and cost-effectiveness for healthcare providers globally. Furthermore, the growing emphasis on interoperability and the development of vendor-neutral archiving solutions will foster a more integrated and efficient healthcare IT ecosystem. As healthcare systems worldwide prioritize early disease detection, personalized medicine, and improved patient outcomes, the demand for specialized PACS solutions tailored to specific medical disciplines is set to escalate, presenting significant opportunities for market players to innovate and expand their reach.
Specialty PACS Market Segmentation
-
1. Type
- 1.1. Cardiovascular PACS
- 1.2. Orthopedic PACS
- 1.3. Oncology PACS
- 1.4. Other Types
-
2. Component
- 2.1. Software
- 2.2. Services
- 2.3. Hardware
-
3. Development
- 3.1. On-premise Specialty PACS
- 3.2. Web/Cloud-based Specialty PACS
-
4. End User
- 4.1. Hospitals
- 4.2. Diagnostic Centers
- 4.3. Other End Users
Specialty PACS Market Segmentation By Geography
-
1. North America
- 1.1. United States
- 1.2. Canada
- 1.3. Mexico
-
2. Europe
- 2.1. Germany
- 2.2. United Kingdom
- 2.3. France
- 2.4. Italy
- 2.5. Spain
- 2.6. Rest of Europe
-
3. Asia Pacific
- 3.1. China
- 3.2. Japan
- 3.3. India
- 3.4. Australia
- 3.5. South Korea
- 3.6. Rest of Asia Pacific
-
4. Middle East and Africa
- 4.1. GCC
- 4.2. South Africa
- 4.3. Rest of Middle East and Africa
-
5. South America
- 5.1. Brazil
- 5.2. Argentina
- 5.3. Rest of South America
Specialty PACS Market Regional Market Share
Geographic Coverage of Specialty PACS Market
Specialty PACS Market REPORT HIGHLIGHTS
| Aspects | Details |
|---|---|
| Study Period | 2020-2034 |
| Base Year | 2025 |
| Estimated Year | 2026 |
| Forecast Period | 2026-2034 |
| Historical Period | 2020-2025 |
| Growth Rate | CAGR of 8.5% from 2020-2034 |
| Segmentation |
|
Table of Contents
- 1. Introduction
- 1.1. Research Scope
- 1.2. Market Segmentation
- 1.3. Research Objective
- 1.4. Definitions and Assumptions
- 2. Executive Summary
- 2.1. Market Snapshot
- 3. Market Dynamics
- 3.1. Market Drivers
- 3.2. Market Restrains
- 3.3. Market Trends
- 3.4. Market Opportunities
- 4. Market Factor Analysis
- 4.1. Porters Five Forces
- 4.1.1. Bargaining Power of Suppliers
- 4.1.2. Bargaining Power of Buyers
- 4.1.3. Threat of New Entrants
- 4.1.4. Threat of Substitutes
- 4.1.5. Competitive Rivalry
- 4.2. PESTEL analysis
- 4.3. BCG Analysis
- 4.3.1. Stars (High Growth, High Market Share)
- 4.3.2. Cash Cows (Low Growth, High Market Share)
- 4.3.3. Question Mark (High Growth, Low Market Share)
- 4.3.4. Dogs (Low Growth, Low Market Share)
- 4.4. Ansoff Matrix Analysis
- 4.5. Supply Chain Analysis
- 4.6. Regulatory Landscape
- 4.7. Current Market Potential and Opportunity Assessment (TAM–SAM–SOM Framework)
- 4.8. RAX Analyst Note
- 4.1. Porters Five Forces
- 5. Market Analysis, Insights and Forecast 2021-2033
- 5.1. Market Analysis, Insights and Forecast - by Type
- 5.1.1. Cardiovascular PACS
- 5.1.2. Orthopedic PACS
- 5.1.3. Oncology PACS
- 5.1.4. Other Types
- 5.2. Market Analysis, Insights and Forecast - by Component
- 5.2.1. Software
- 5.2.2. Services
- 5.2.3. Hardware
- 5.3. Market Analysis, Insights and Forecast - by Development
- 5.3.1. On-premise Specialty PACS
- 5.3.2. Web/Cloud-based Specialty PACS
- 5.4. Market Analysis, Insights and Forecast - by End User
- 5.4.1. Hospitals
- 5.4.2. Diagnostic Centers
- 5.4.3. Other End Users
- 5.5. Market Analysis, Insights and Forecast - by Region
- 5.5.1. North America
- 5.5.2. Europe
- 5.5.3. Asia Pacific
- 5.5.4. Middle East and Africa
- 5.5.5. South America
- 5.1. Market Analysis, Insights and Forecast - by Type
- 6. Global Specialty PACS Market Analysis, Insights and Forecast, 2021-2033
- 6.1. Market Analysis, Insights and Forecast - by Type
- 6.1.1. Cardiovascular PACS
- 6.1.2. Orthopedic PACS
- 6.1.3. Oncology PACS
- 6.1.4. Other Types
- 6.2. Market Analysis, Insights and Forecast - by Component
- 6.2.1. Software
- 6.2.2. Services
- 6.2.3. Hardware
- 6.3. Market Analysis, Insights and Forecast - by Development
- 6.3.1. On-premise Specialty PACS
- 6.3.2. Web/Cloud-based Specialty PACS
- 6.4. Market Analysis, Insights and Forecast - by End User
- 6.4.1. Hospitals
- 6.4.2. Diagnostic Centers
- 6.4.3. Other End Users
- 6.1. Market Analysis, Insights and Forecast - by Type
- 7. North America Specialty PACS Market Analysis, Insights and Forecast, 2020-2032
- 7.1. Market Analysis, Insights and Forecast - by Type
- 7.1.1. Cardiovascular PACS
- 7.1.2. Orthopedic PACS
- 7.1.3. Oncology PACS
- 7.1.4. Other Types
- 7.2. Market Analysis, Insights and Forecast - by Component
- 7.2.1. Software
- 7.2.2. Services
- 7.2.3. Hardware
- 7.3. Market Analysis, Insights and Forecast - by Development
- 7.3.1. On-premise Specialty PACS
- 7.3.2. Web/Cloud-based Specialty PACS
- 7.4. Market Analysis, Insights and Forecast - by End User
- 7.4.1. Hospitals
- 7.4.2. Diagnostic Centers
- 7.4.3. Other End Users
- 7.1. Market Analysis, Insights and Forecast - by Type
- 8. Europe Specialty PACS Market Analysis, Insights and Forecast, 2020-2032
- 8.1. Market Analysis, Insights and Forecast - by Type
- 8.1.1. Cardiovascular PACS
- 8.1.2. Orthopedic PACS
- 8.1.3. Oncology PACS
- 8.1.4. Other Types
- 8.2. Market Analysis, Insights and Forecast - by Component
- 8.2.1. Software
- 8.2.2. Services
- 8.2.3. Hardware
- 8.3. Market Analysis, Insights and Forecast - by Development
- 8.3.1. On-premise Specialty PACS
- 8.3.2. Web/Cloud-based Specialty PACS
- 8.4. Market Analysis, Insights and Forecast - by End User
- 8.4.1. Hospitals
- 8.4.2. Diagnostic Centers
- 8.4.3. Other End Users
- 8.1. Market Analysis, Insights and Forecast - by Type
- 9. Asia Pacific Specialty PACS Market Analysis, Insights and Forecast, 2020-2032
- 9.1. Market Analysis, Insights and Forecast - by Type
- 9.1.1. Cardiovascular PACS
- 9.1.2. Orthopedic PACS
- 9.1.3. Oncology PACS
- 9.1.4. Other Types
- 9.2. Market Analysis, Insights and Forecast - by Component
- 9.2.1. Software
- 9.2.2. Services
- 9.2.3. Hardware
- 9.3. Market Analysis, Insights and Forecast - by Development
- 9.3.1. On-premise Specialty PACS
- 9.3.2. Web/Cloud-based Specialty PACS
- 9.4. Market Analysis, Insights and Forecast - by End User
- 9.4.1. Hospitals
- 9.4.2. Diagnostic Centers
- 9.4.3. Other End Users
- 9.1. Market Analysis, Insights and Forecast - by Type
- 10. Middle East and Africa Specialty PACS Market Analysis, Insights and Forecast, 2020-2032
- 10.1. Market Analysis, Insights and Forecast - by Type
- 10.1.1. Cardiovascular PACS
- 10.1.2. Orthopedic PACS
- 10.1.3. Oncology PACS
- 10.1.4. Other Types
- 10.2. Market Analysis, Insights and Forecast - by Component
- 10.2.1. Software
- 10.2.2. Services
- 10.2.3. Hardware
- 10.3. Market Analysis, Insights and Forecast - by Development
- 10.3.1. On-premise Specialty PACS
- 10.3.2. Web/Cloud-based Specialty PACS
- 10.4. Market Analysis, Insights and Forecast - by End User
- 10.4.1. Hospitals
- 10.4.2. Diagnostic Centers
- 10.4.3. Other End Users
- 10.1. Market Analysis, Insights and Forecast - by Type
- 11. South America Specialty PACS Market Analysis, Insights and Forecast, 2020-2032
- 11.1. Market Analysis, Insights and Forecast - by Type
- 11.1.1. Cardiovascular PACS
- 11.1.2. Orthopedic PACS
- 11.1.3. Oncology PACS
- 11.1.4. Other Types
- 11.2. Market Analysis, Insights and Forecast - by Component
- 11.2.1. Software
- 11.2.2. Services
- 11.2.3. Hardware
- 11.3. Market Analysis, Insights and Forecast - by Development
- 11.3.1. On-premise Specialty PACS
- 11.3.2. Web/Cloud-based Specialty PACS
- 11.4. Market Analysis, Insights and Forecast - by End User
- 11.4.1. Hospitals
- 11.4.2. Diagnostic Centers
- 11.4.3. Other End Users
- 11.1. Market Analysis, Insights and Forecast - by Type
- 12. Competitive Analysis
- 12.1. Company Profiles
- 12.1.1 Sectra AB
- 12.1.1.1. Company Overview
- 12.1.1.2. Products
- 12.1.1.3. Company Financials
- 12.1.1.4. SWOT Analysis
- 12.1.2 IBM Corporation
- 12.1.2.1. Company Overview
- 12.1.2.2. Products
- 12.1.2.3. Company Financials
- 12.1.2.4. SWOT Analysis
- 12.1.3 Novarad
- 12.1.3.1. Company Overview
- 12.1.3.2. Products
- 12.1.3.3. Company Financials
- 12.1.3.4. SWOT Analysis
- 12.1.4 Topcon Corporation
- 12.1.4.1. Company Overview
- 12.1.4.2. Products
- 12.1.4.3. Company Financials
- 12.1.4.4. SWOT Analysis
- 12.1.5 Siemens AG
- 12.1.5.1. Company Overview
- 12.1.5.2. Products
- 12.1.5.3. Company Financials
- 12.1.5.4. SWOT Analysis
- 12.1.6 Philips Healthcare
- 12.1.6.1. Company Overview
- 12.1.6.2. Products
- 12.1.6.3. Company Financials
- 12.1.6.4. SWOT Analysis
- 12.1.7 Canon USA Inc
- 12.1.7.1. Company Overview
- 12.1.7.2. Products
- 12.1.7.3. Company Financials
- 12.1.7.4. SWOT Analysis
- 12.1.8 Agfa Healthcare
- 12.1.8.1. Company Overview
- 12.1.8.2. Products
- 12.1.8.3. Company Financials
- 12.1.8.4. SWOT Analysis
- 12.1.9 McKesson Corporation
- 12.1.9.1. Company Overview
- 12.1.9.2. Products
- 12.1.9.3. Company Financials
- 12.1.9.4. SWOT Analysis
- 12.1.10 Fujifilm Holdings Corporation (Fujifilm Medical Systems)
- 12.1.10.1. Company Overview
- 12.1.10.2. Products
- 12.1.10.3. Company Financials
- 12.1.10.4. SWOT Analysis
- 12.1.1 Sectra AB
- 12.2. Market Entropy
- 12.2.1 Company's Key Areas Served
- 12.2.2 Recent Developments
- 12.3. Company Market Share Analysis 2025
- 12.3.1 Top 5 Companies Market Share Analysis
- 12.3.2 Top 3 Companies Market Share Analysis
- 12.4. List of Potential Customers
- 13. Research Methodology
List of Figures
- Figure 1: Global Specialty PACS Market Revenue Breakdown (billion, %) by Region 2025 & 2033
- Figure 2: Global Specialty PACS Market Volume Breakdown (K Unit, %) by Region 2025 & 2033
- Figure 3: North America Specialty PACS Market Revenue (billion), by Type 2025 & 2033
- Figure 4: North America Specialty PACS Market Volume (K Unit), by Type 2025 & 2033
- Figure 5: North America Specialty PACS Market Revenue Share (%), by Type 2025 & 2033
- Figure 6: North America Specialty PACS Market Volume Share (%), by Type 2025 & 2033
- Figure 7: North America Specialty PACS Market Revenue (billion), by Component 2025 & 2033
- Figure 8: North America Specialty PACS Market Volume (K Unit), by Component 2025 & 2033
- Figure 9: North America Specialty PACS Market Revenue Share (%), by Component 2025 & 2033
- Figure 10: North America Specialty PACS Market Volume Share (%), by Component 2025 & 2033
- Figure 11: North America Specialty PACS Market Revenue (billion), by Development 2025 & 2033
- Figure 12: North America Specialty PACS Market Volume (K Unit), by Development 2025 & 2033
- Figure 13: North America Specialty PACS Market Revenue Share (%), by Development 2025 & 2033
- Figure 14: North America Specialty PACS Market Volume Share (%), by Development 2025 & 2033
- Figure 15: North America Specialty PACS Market Revenue (billion), by End User 2025 & 2033
- Figure 16: North America Specialty PACS Market Volume (K Unit), by End User 2025 & 2033
- Figure 17: North America Specialty PACS Market Revenue Share (%), by End User 2025 & 2033
- Figure 18: North America Specialty PACS Market Volume Share (%), by End User 2025 & 2033
- Figure 19: North America Specialty PACS Market Revenue (billion), by Country 2025 & 2033
- Figure 20: North America Specialty PACS Market Volume (K Unit), by Country 2025 & 2033
- Figure 21: North America Specialty PACS Market Revenue Share (%), by Country 2025 & 2033
- Figure 22: North America Specialty PACS Market Volume Share (%), by Country 2025 & 2033
- Figure 23: Europe Specialty PACS Market Revenue (billion), by Type 2025 & 2033
- Figure 24: Europe Specialty PACS Market Volume (K Unit), by Type 2025 & 2033
- Figure 25: Europe Specialty PACS Market Revenue Share (%), by Type 2025 & 2033
- Figure 26: Europe Specialty PACS Market Volume Share (%), by Type 2025 & 2033
- Figure 27: Europe Specialty PACS Market Revenue (billion), by Component 2025 & 2033
- Figure 28: Europe Specialty PACS Market Volume (K Unit), by Component 2025 & 2033
- Figure 29: Europe Specialty PACS Market Revenue Share (%), by Component 2025 & 2033
- Figure 30: Europe Specialty PACS Market Volume Share (%), by Component 2025 & 2033
- Figure 31: Europe Specialty PACS Market Revenue (billion), by Development 2025 & 2033
- Figure 32: Europe Specialty PACS Market Volume (K Unit), by Development 2025 & 2033
- Figure 33: Europe Specialty PACS Market Revenue Share (%), by Development 2025 & 2033
- Figure 34: Europe Specialty PACS Market Volume Share (%), by Development 2025 & 2033
- Figure 35: Europe Specialty PACS Market Revenue (billion), by End User 2025 & 2033
- Figure 36: Europe Specialty PACS Market Volume (K Unit), by End User 2025 & 2033
- Figure 37: Europe Specialty PACS Market Revenue Share (%), by End User 2025 & 2033
- Figure 38: Europe Specialty PACS Market Volume Share (%), by End User 2025 & 2033
- Figure 39: Europe Specialty PACS Market Revenue (billion), by Country 2025 & 2033
- Figure 40: Europe Specialty PACS Market Volume (K Unit), by Country 2025 & 2033
- Figure 41: Europe Specialty PACS Market Revenue Share (%), by Country 2025 & 2033
- Figure 42: Europe Specialty PACS Market Volume Share (%), by Country 2025 & 2033
- Figure 43: Asia Pacific Specialty PACS Market Revenue (billion), by Type 2025 & 2033
- Figure 44: Asia Pacific Specialty PACS Market Volume (K Unit), by Type 2025 & 2033
- Figure 45: Asia Pacific Specialty PACS Market Revenue Share (%), by Type 2025 & 2033
- Figure 46: Asia Pacific Specialty PACS Market Volume Share (%), by Type 2025 & 2033
- Figure 47: Asia Pacific Specialty PACS Market Revenue (billion), by Component 2025 & 2033
- Figure 48: Asia Pacific Specialty PACS Market Volume (K Unit), by Component 2025 & 2033
- Figure 49: Asia Pacific Specialty PACS Market Revenue Share (%), by Component 2025 & 2033
- Figure 50: Asia Pacific Specialty PACS Market Volume Share (%), by Component 2025 & 2033
- Figure 51: Asia Pacific Specialty PACS Market Revenue (billion), by Development 2025 & 2033
- Figure 52: Asia Pacific Specialty PACS Market Volume (K Unit), by Development 2025 & 2033
- Figure 53: Asia Pacific Specialty PACS Market Revenue Share (%), by Development 2025 & 2033
- Figure 54: Asia Pacific Specialty PACS Market Volume Share (%), by Development 2025 & 2033
- Figure 55: Asia Pacific Specialty PACS Market Revenue (billion), by End User 2025 & 2033
- Figure 56: Asia Pacific Specialty PACS Market Volume (K Unit), by End User 2025 & 2033
- Figure 57: Asia Pacific Specialty PACS Market Revenue Share (%), by End User 2025 & 2033
- Figure 58: Asia Pacific Specialty PACS Market Volume Share (%), by End User 2025 & 2033
- Figure 59: Asia Pacific Specialty PACS Market Revenue (billion), by Country 2025 & 2033
- Figure 60: Asia Pacific Specialty PACS Market Volume (K Unit), by Country 2025 & 2033
- Figure 61: Asia Pacific Specialty PACS Market Revenue Share (%), by Country 2025 & 2033
- Figure 62: Asia Pacific Specialty PACS Market Volume Share (%), by Country 2025 & 2033
- Figure 63: Middle East and Africa Specialty PACS Market Revenue (billion), by Type 2025 & 2033
- Figure 64: Middle East and Africa Specialty PACS Market Volume (K Unit), by Type 2025 & 2033
- Figure 65: Middle East and Africa Specialty PACS Market Revenue Share (%), by Type 2025 & 2033
- Figure 66: Middle East and Africa Specialty PACS Market Volume Share (%), by Type 2025 & 2033
- Figure 67: Middle East and Africa Specialty PACS Market Revenue (billion), by Component 2025 & 2033
- Figure 68: Middle East and Africa Specialty PACS Market Volume (K Unit), by Component 2025 & 2033
- Figure 69: Middle East and Africa Specialty PACS Market Revenue Share (%), by Component 2025 & 2033
- Figure 70: Middle East and Africa Specialty PACS Market Volume Share (%), by Component 2025 & 2033
- Figure 71: Middle East and Africa Specialty PACS Market Revenue (billion), by Development 2025 & 2033
- Figure 72: Middle East and Africa Specialty PACS Market Volume (K Unit), by Development 2025 & 2033
- Figure 73: Middle East and Africa Specialty PACS Market Revenue Share (%), by Development 2025 & 2033
- Figure 74: Middle East and Africa Specialty PACS Market Volume Share (%), by Development 2025 & 2033
- Figure 75: Middle East and Africa Specialty PACS Market Revenue (billion), by End User 2025 & 2033
- Figure 76: Middle East and Africa Specialty PACS Market Volume (K Unit), by End User 2025 & 2033
- Figure 77: Middle East and Africa Specialty PACS Market Revenue Share (%), by End User 2025 & 2033
- Figure 78: Middle East and Africa Specialty PACS Market Volume Share (%), by End User 2025 & 2033
- Figure 79: Middle East and Africa Specialty PACS Market Revenue (billion), by Country 2025 & 2033
- Figure 80: Middle East and Africa Specialty PACS Market Volume (K Unit), by Country 2025 & 2033
- Figure 81: Middle East and Africa Specialty PACS Market Revenue Share (%), by Country 2025 & 2033
- Figure 82: Middle East and Africa Specialty PACS Market Volume Share (%), by Country 2025 & 2033
- Figure 83: South America Specialty PACS Market Revenue (billion), by Type 2025 & 2033
- Figure 84: South America Specialty PACS Market Volume (K Unit), by Type 2025 & 2033
- Figure 85: South America Specialty PACS Market Revenue Share (%), by Type 2025 & 2033
- Figure 86: South America Specialty PACS Market Volume Share (%), by Type 2025 & 2033
- Figure 87: South America Specialty PACS Market Revenue (billion), by Component 2025 & 2033
- Figure 88: South America Specialty PACS Market Volume (K Unit), by Component 2025 & 2033
- Figure 89: South America Specialty PACS Market Revenue Share (%), by Component 2025 & 2033
- Figure 90: South America Specialty PACS Market Volume Share (%), by Component 2025 & 2033
- Figure 91: South America Specialty PACS Market Revenue (billion), by Development 2025 & 2033
- Figure 92: South America Specialty PACS Market Volume (K Unit), by Development 2025 & 2033
- Figure 93: South America Specialty PACS Market Revenue Share (%), by Development 2025 & 2033
- Figure 94: South America Specialty PACS Market Volume Share (%), by Development 2025 & 2033
- Figure 95: South America Specialty PACS Market Revenue (billion), by End User 2025 & 2033
- Figure 96: South America Specialty PACS Market Volume (K Unit), by End User 2025 & 2033
- Figure 97: South America Specialty PACS Market Revenue Share (%), by End User 2025 & 2033
- Figure 98: South America Specialty PACS Market Volume Share (%), by End User 2025 & 2033
- Figure 99: South America Specialty PACS Market Revenue (billion), by Country 2025 & 2033
- Figure 100: South America Specialty PACS Market Volume (K Unit), by Country 2025 & 2033
- Figure 101: South America Specialty PACS Market Revenue Share (%), by Country 2025 & 2033
- Figure 102: South America Specialty PACS Market Volume Share (%), by Country 2025 & 2033
List of Tables
- Table 1: Global Specialty PACS Market Revenue billion Forecast, by Type 2020 & 2033
- Table 2: Global Specialty PACS Market Volume K Unit Forecast, by Type 2020 & 2033
- Table 3: Global Specialty PACS Market Revenue billion Forecast, by Component 2020 & 2033
- Table 4: Global Specialty PACS Market Volume K Unit Forecast, by Component 2020 & 2033
- Table 5: Global Specialty PACS Market Revenue billion Forecast, by Development 2020 & 2033
- Table 6: Global Specialty PACS Market Volume K Unit Forecast, by Development 2020 & 2033
- Table 7: Global Specialty PACS Market Revenue billion Forecast, by End User 2020 & 2033
- Table 8: Global Specialty PACS Market Volume K Unit Forecast, by End User 2020 & 2033
- Table 9: Global Specialty PACS Market Revenue billion Forecast, by Region 2020 & 2033
- Table 10: Global Specialty PACS Market Volume K Unit Forecast, by Region 2020 & 2033
- Table 11: Global Specialty PACS Market Revenue billion Forecast, by Type 2020 & 2033
- Table 12: Global Specialty PACS Market Volume K Unit Forecast, by Type 2020 & 2033
- Table 13: Global Specialty PACS Market Revenue billion Forecast, by Component 2020 & 2033
- Table 14: Global Specialty PACS Market Volume K Unit Forecast, by Component 2020 & 2033
- Table 15: Global Specialty PACS Market Revenue billion Forecast, by Development 2020 & 2033
- Table 16: Global Specialty PACS Market Volume K Unit Forecast, by Development 2020 & 2033
- Table 17: Global Specialty PACS Market Revenue billion Forecast, by End User 2020 & 2033
- Table 18: Global Specialty PACS Market Volume K Unit Forecast, by End User 2020 & 2033
- Table 19: Global Specialty PACS Market Revenue billion Forecast, by Country 2020 & 2033
- Table 20: Global Specialty PACS Market Volume K Unit Forecast, by Country 2020 & 2033
- Table 21: United States Specialty PACS Market Revenue (billion) Forecast, by Application 2020 & 2033
- Table 22: United States Specialty PACS Market Volume (K Unit) Forecast, by Application 2020 & 2033
- Table 23: Canada Specialty PACS Market Revenue (billion) Forecast, by Application 2020 & 2033
- Table 24: Canada Specialty PACS Market Volume (K Unit) Forecast, by Application 2020 & 2033
- Table 25: Mexico Specialty PACS Market Revenue (billion) Forecast, by Application 2020 & 2033
- Table 26: Mexico Specialty PACS Market Volume (K Unit) Forecast, by Application 2020 & 2033
- Table 27: Global Specialty PACS Market Revenue billion Forecast, by Type 2020 & 2033
- Table 28: Global Specialty PACS Market Volume K Unit Forecast, by Type 2020 & 2033
- Table 29: Global Specialty PACS Market Revenue billion Forecast, by Component 2020 & 2033
- Table 30: Global Specialty PACS Market Volume K Unit Forecast, by Component 2020 & 2033
- Table 31: Global Specialty PACS Market Revenue billion Forecast, by Development 2020 & 2033
- Table 32: Global Specialty PACS Market Volume K Unit Forecast, by Development 2020 & 2033
- Table 33: Global Specialty PACS Market Revenue billion Forecast, by End User 2020 & 2033
- Table 34: Global Specialty PACS Market Volume K Unit Forecast, by End User 2020 & 2033
- Table 35: Global Specialty PACS Market Revenue billion Forecast, by Country 2020 & 2033
- Table 36: Global Specialty PACS Market Volume K Unit Forecast, by Country 2020 & 2033
- Table 37: Germany Specialty PACS Market Revenue (billion) Forecast, by Application 2020 & 2033
- Table 38: Germany Specialty PACS Market Volume (K Unit) Forecast, by Application 2020 & 2033
- Table 39: United Kingdom Specialty PACS Market Revenue (billion) Forecast, by Application 2020 & 2033
- Table 40: United Kingdom Specialty PACS Market Volume (K Unit) Forecast, by Application 2020 & 2033
- Table 41: France Specialty PACS Market Revenue (billion) Forecast, by Application 2020 & 2033
- Table 42: France Specialty PACS Market Volume (K Unit) Forecast, by Application 2020 & 2033
- Table 43: Italy Specialty PACS Market Revenue (billion) Forecast, by Application 2020 & 2033
- Table 44: Italy Specialty PACS Market Volume (K Unit) Forecast, by Application 2020 & 2033
- Table 45: Spain Specialty PACS Market Revenue (billion) Forecast, by Application 2020 & 2033
- Table 46: Spain Specialty PACS Market Volume (K Unit) Forecast, by Application 2020 & 2033
- Table 47: Rest of Europe Specialty PACS Market Revenue (billion) Forecast, by Application 2020 & 2033
- Table 48: Rest of Europe Specialty PACS Market Volume (K Unit) Forecast, by Application 2020 & 2033
- Table 49: Global Specialty PACS Market Revenue billion Forecast, by Type 2020 & 2033
- Table 50: Global Specialty PACS Market Volume K Unit Forecast, by Type 2020 & 2033
- Table 51: Global Specialty PACS Market Revenue billion Forecast, by Component 2020 & 2033
- Table 52: Global Specialty PACS Market Volume K Unit Forecast, by Component 2020 & 2033
- Table 53: Global Specialty PACS Market Revenue billion Forecast, by Development 2020 & 2033
- Table 54: Global Specialty PACS Market Volume K Unit Forecast, by Development 2020 & 2033
- Table 55: Global Specialty PACS Market Revenue billion Forecast, by End User 2020 & 2033
- Table 56: Global Specialty PACS Market Volume K Unit Forecast, by End User 2020 & 2033
- Table 57: Global Specialty PACS Market Revenue billion Forecast, by Country 2020 & 2033
- Table 58: Global Specialty PACS Market Volume K Unit Forecast, by Country 2020 & 2033
- Table 59: China Specialty PACS Market Revenue (billion) Forecast, by Application 2020 & 2033
- Table 60: China Specialty PACS Market Volume (K Unit) Forecast, by Application 2020 & 2033
- Table 61: Japan Specialty PACS Market Revenue (billion) Forecast, by Application 2020 & 2033
- Table 62: Japan Specialty PACS Market Volume (K Unit) Forecast, by Application 2020 & 2033
- Table 63: India Specialty PACS Market Revenue (billion) Forecast, by Application 2020 & 2033
- Table 64: India Specialty PACS Market Volume (K Unit) Forecast, by Application 2020 & 2033
- Table 65: Australia Specialty PACS Market Revenue (billion) Forecast, by Application 2020 & 2033
- Table 66: Australia Specialty PACS Market Volume (K Unit) Forecast, by Application 2020 & 2033
- Table 67: South Korea Specialty PACS Market Revenue (billion) Forecast, by Application 2020 & 2033
- Table 68: South Korea Specialty PACS Market Volume (K Unit) Forecast, by Application 2020 & 2033
- Table 69: Rest of Asia Pacific Specialty PACS Market Revenue (billion) Forecast, by Application 2020 & 2033
- Table 70: Rest of Asia Pacific Specialty PACS Market Volume (K Unit) Forecast, by Application 2020 & 2033
- Table 71: Global Specialty PACS Market Revenue billion Forecast, by Type 2020 & 2033
- Table 72: Global Specialty PACS Market Volume K Unit Forecast, by Type 2020 & 2033
- Table 73: Global Specialty PACS Market Revenue billion Forecast, by Component 2020 & 2033
- Table 74: Global Specialty PACS Market Volume K Unit Forecast, by Component 2020 & 2033
- Table 75: Global Specialty PACS Market Revenue billion Forecast, by Development 2020 & 2033
- Table 76: Global Specialty PACS Market Volume K Unit Forecast, by Development 2020 & 2033
- Table 77: Global Specialty PACS Market Revenue billion Forecast, by End User 2020 & 2033
- Table 78: Global Specialty PACS Market Volume K Unit Forecast, by End User 2020 & 2033
- Table 79: Global Specialty PACS Market Revenue billion Forecast, by Country 2020 & 2033
- Table 80: Global Specialty PACS Market Volume K Unit Forecast, by Country 2020 & 2033
- Table 81: GCC Specialty PACS Market Revenue (billion) Forecast, by Application 2020 & 2033
- Table 82: GCC Specialty PACS Market Volume (K Unit) Forecast, by Application 2020 & 2033
- Table 83: South Africa Specialty PACS Market Revenue (billion) Forecast, by Application 2020 & 2033
- Table 84: South Africa Specialty PACS Market Volume (K Unit) Forecast, by Application 2020 & 2033
- Table 85: Rest of Middle East and Africa Specialty PACS Market Revenue (billion) Forecast, by Application 2020 & 2033
- Table 86: Rest of Middle East and Africa Specialty PACS Market Volume (K Unit) Forecast, by Application 2020 & 2033
- Table 87: Global Specialty PACS Market Revenue billion Forecast, by Type 2020 & 2033
- Table 88: Global Specialty PACS Market Volume K Unit Forecast, by Type 2020 & 2033
- Table 89: Global Specialty PACS Market Revenue billion Forecast, by Component 2020 & 2033
- Table 90: Global Specialty PACS Market Volume K Unit Forecast, by Component 2020 & 2033
- Table 91: Global Specialty PACS Market Revenue billion Forecast, by Development 2020 & 2033
- Table 92: Global Specialty PACS Market Volume K Unit Forecast, by Development 2020 & 2033
- Table 93: Global Specialty PACS Market Revenue billion Forecast, by End User 2020 & 2033
- Table 94: Global Specialty PACS Market Volume K Unit Forecast, by End User 2020 & 2033
- Table 95: Global Specialty PACS Market Revenue billion Forecast, by Country 2020 & 2033
- Table 96: Global Specialty PACS Market Volume K Unit Forecast, by Country 2020 & 2033
- Table 97: Brazil Specialty PACS Market Revenue (billion) Forecast, by Application 2020 & 2033
- Table 98: Brazil Specialty PACS Market Volume (K Unit) Forecast, by Application 2020 & 2033
- Table 99: Argentina Specialty PACS Market Revenue (billion) Forecast, by Application 2020 & 2033
- Table 100: Argentina Specialty PACS Market Volume (K Unit) Forecast, by Application 2020 & 2033
- Table 101: Rest of South America Specialty PACS Market Revenue (billion) Forecast, by Application 2020 & 2033
- Table 102: Rest of South America Specialty PACS Market Volume (K Unit) Forecast, by Application 2020 & 2033
Frequently Asked Questions
1. What is the projected Compound Annual Growth Rate (CAGR) of the Specialty PACS Market?
The projected CAGR is approximately 8.5%.
2. Which companies are prominent players in the Specialty PACS Market?
Key companies in the market include Sectra AB, IBM Corporation, Novarad, Topcon Corporation, Siemens AG, Philips Healthcare, Canon USA Inc, Agfa Healthcare, McKesson Corporation, Fujifilm Holdings Corporation (Fujifilm Medical Systems).
3. What are the main segments of the Specialty PACS Market?
The market segments include Type, Component, Development, End User.
4. Can you provide details about the market size?
The market size is estimated to be USD 5.31 billion as of 2022.
5. What are some drivers contributing to market growth?
Growing Use of Imaging Devices; Growing Burden of Chronic Diseases.
6. What are the notable trends driving market growth?
On-premise Specialty PACS are Expected to Hold the Largest Market Share in the Specialty PACS Market.
7. Are there any restraints impacting market growth?
Data Security and Privacy Issues.
8. Can you provide examples of recent developments in the market?
April 2022: FUJIFILM Healthcare Americas Corporation installed Fujifilm's Synapse Cardiology PACS version 7 throughout Emory Healthcare facilities to store, process, and analyze heart and vascular imaging. Emory Healthcare is the most comprehensive academic health system in Georgia.
9. What pricing options are available for accessing the report?
Pricing options include single-user, multi-user, and enterprise licenses priced at USD 4750, USD 5250, and USD 8750 respectively.
10. Is the market size provided in terms of value or volume?
The market size is provided in terms of value, measured in billion and volume, measured in K Unit.
11. Are there any specific market keywords associated with the report?
Yes, the market keyword associated with the report is "Specialty PACS Market," which aids in identifying and referencing the specific market segment covered.
12. How do I determine which pricing option suits my needs best?
The pricing options vary based on user requirements and access needs. Individual users may opt for single-user licenses, while businesses requiring broader access may choose multi-user or enterprise licenses for cost-effective access to the report.
13. Are there any additional resources or data provided in the Specialty PACS Market report?
While the report offers comprehensive insights, it's advisable to review the specific contents or supplementary materials provided to ascertain if additional resources or data are available.
14. How can I stay updated on further developments or reports in the Specialty PACS Market?
To stay informed about further developments, trends, and reports in the Specialty PACS Market, consider subscribing to industry newsletters, following relevant companies and organizations, or regularly checking reputable industry news sources and publications.
Methodology
Step 1 - Identification of Relevant Samples Size from Population Database


Step 2 - Approaches for Defining Global Market Size (Value, Volume* & Price*)

Note*: In applicable scenarios
Step 3 - Data Sources
Primary Research
- Web Analytics
- Survey Reports
- Research Institute
- Latest Research Reports
- Opinion Leaders
Secondary Research
- Annual Reports
- White Paper
- Latest Press Release
- Industry Association
- Paid Database
- Investor Presentations

Step 4 - Data Triangulation
Involves using different sources of information in order to increase the validity of a study
These sources are likely to be stakeholders in a program - participants, other researchers, program staff, other community members, and so on.
Then we put all data in single framework & apply various statistical tools to find out the dynamic on the market.
During the analysis stage, feedback from the stakeholder groups would be compared to determine areas of agreement as well as areas of divergence