

Key Insights
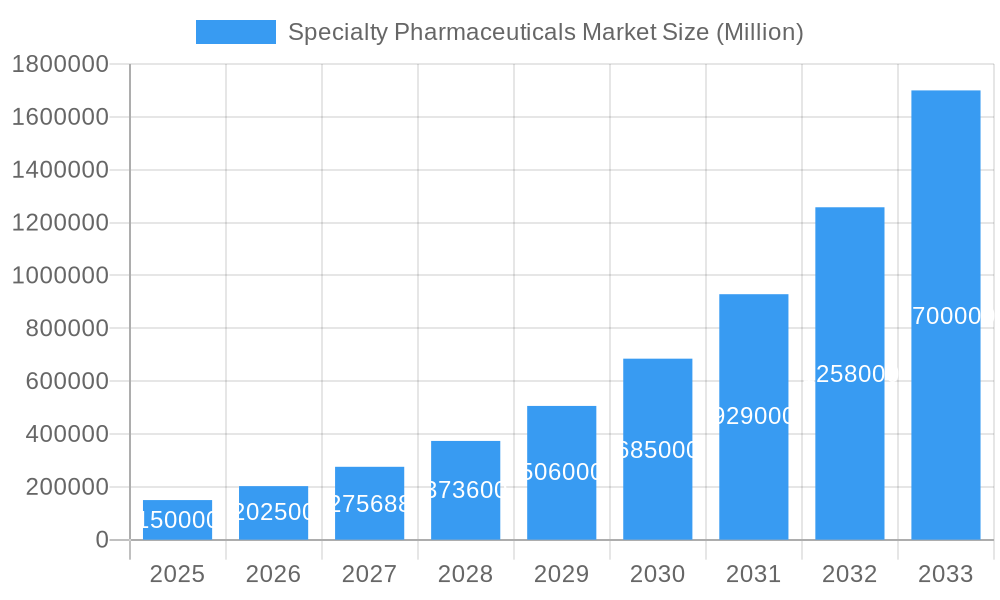
The specialty pharmaceuticals market is projected for substantial expansion, forecasting a market size of $285.1 billion by 2033. This growth is underpinned by a robust compound annual growth rate (CAGR) of 26.5% from 2025 to 2033. Key drivers include the rising incidence of chronic conditions such as cancer, multiple sclerosis, and inflammatory diseases, coupled with technological advancements yielding novel biologics, targeted therapies, and personalized medicines. An aging global population further fuels demand for specialized treatments. Market segmentation highlights oncology as the leading therapeutic area, followed by inflammatory conditions, multiple sclerosis, and infectious diseases. Parenteral administration is anticipated to hold a significant share due to its efficacy in specialty treatments, with hospitals and specialty pharmacies dominating distribution channels. Significant R&D investment and strategic M&A activities are reshaping the competitive landscape, despite pricing pressures and regulatory challenges.
Specialty Pharmaceuticals Market Market Size (In Billion)
Geographically, North America, led by the United States, is expected to retain a dominant market share, attributed to its advanced healthcare infrastructure, rapid adoption of innovative therapies, and strong research funding. Europe and Asia Pacific are also exhibiting strong growth trajectories, influenced by healthcare expenditure and regulatory environments. Emerging markets in Asia Pacific and the Middle East & Africa offer considerable growth potential with improving healthcare access and increasing purchasing power. However, diverse regulatory frameworks and reimbursement policies across regions will impact market penetration and profitability. The forecast period (2025-2033) predicts sustained market growth, potentially moderating as innovative drugs mature and competition increases.
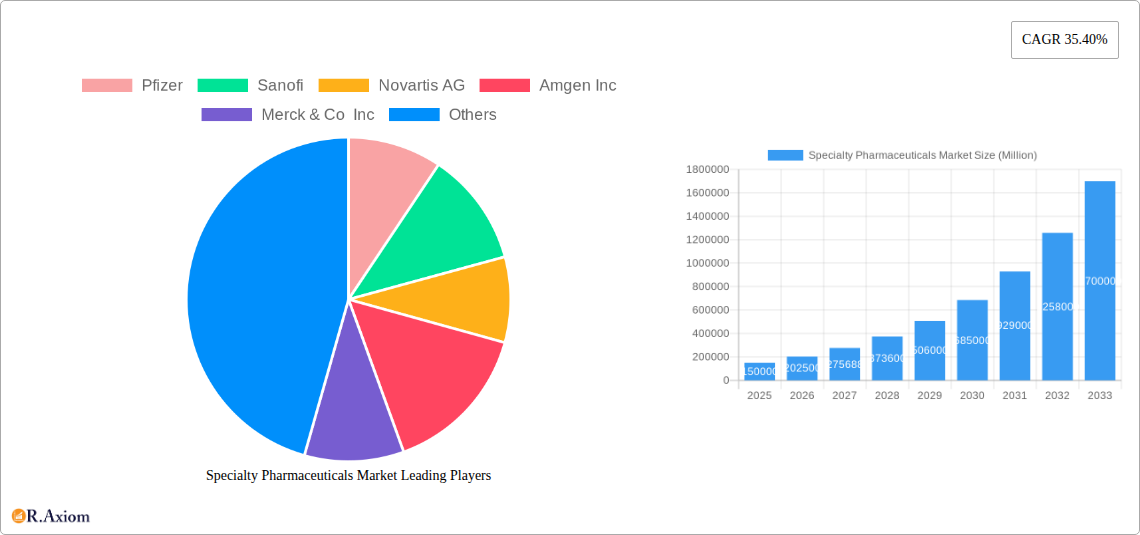
Specialty Pharmaceuticals Market Company Market Share
Specialty Pharmaceuticals Market: A Comprehensive Report (2019-2033)
This in-depth report provides a comprehensive analysis of the Specialty Pharmaceuticals Market, offering invaluable insights for industry stakeholders, investors, and researchers. The study period covers 2019-2033, with 2025 as the base year and a forecast period spanning 2025-2033. The report meticulously examines market segmentation, competitive dynamics, growth drivers, and emerging opportunities, incorporating both historical data (2019-2024) and future projections. The report quantifies market size in Millions.
Specialty Pharmaceuticals Market Market Concentration & Innovation
The global specialty pharmaceuticals market exhibits a moderately concentrated landscape, dominated by a few multinational pharmaceutical giants. Key players like Pfizer, Sanofi, Novartis AG, Amgen Inc, Merck & Co Inc, F Hoffmann-La Roche Ltd, Johnson & Johnson, Teva Pharmaceutical Industries Ltd, Viatris, AbbVie Inc, Gilead Sciences Inc, and Bristol-Myers Squibb Company collectively hold a significant market share (estimated at xx%). Market concentration is influenced by factors such as extensive R&D investments, robust patent portfolios, and strong global distribution networks.
Innovation plays a crucial role, with companies focusing on developing novel therapies for complex diseases, including biologics, targeted therapies, and cell and gene therapies. Regulatory frameworks, including FDA approvals and pricing policies, significantly shape market dynamics. Product substitution is a notable factor, with biosimilars and generic equivalents challenging the dominance of innovator drugs. End-user trends, particularly the rising prevalence of chronic diseases and an aging population, fuel market growth. Mergers and acquisitions (M&A) are prevalent, with deal values reaching xx Million annually in recent years. Examples include [Insert Specific M&A deals and values, if available]. The report provides a detailed analysis of M&A activities, assessing their impact on market consolidation and innovation.
Specialty Pharmaceuticals Market Industry Trends & Insights
The specialty pharmaceuticals market is experiencing robust growth, driven by several key trends. The increasing prevalence of chronic diseases such as cancer, autoimmune disorders, and infectious diseases is a major driver, necessitating the use of high-cost specialty drugs. The aging global population significantly contributes to the rise in chronic disease prevalence, further fueling demand. Technological advancements, including the development of novel drug delivery systems and personalized medicine approaches, are transforming the market landscape. The emergence of biosimilars and other generic alternatives is creating a more competitive market environment. Consumer preferences are shifting towards more convenient and personalized treatment options. This is driving the demand for innovative drug delivery systems and digital health solutions.
The competitive landscape is intensely competitive, characterized by significant R&D investments, strategic partnerships, and aggressive marketing campaigns. The market is expected to grow at a CAGR of xx% during the forecast period (2025-2033). Market penetration of novel therapies is increasing steadily, with xx% market penetration for [Insert specific therapy example] expected by 2033.
Dominant Markets & Segments in Specialty Pharmaceuticals Market
Dominant Regions/Countries: North America currently dominates the market due to high healthcare expenditure, robust R&D infrastructure, and early adoption of advanced therapies. However, emerging markets in Asia-Pacific and Latin America are expected to witness significant growth due to increasing healthcare spending and rising disease prevalence.
Dominant Segments:
- By Therapeutic Area: Oncology holds the largest market share, driven by the high prevalence of cancer and the continuous development of innovative cancer therapies. Inflammatory conditions and multiple sclerosis are other significant segments, exhibiting substantial growth potential.
- By Route of Administration: Parenteral administration (e.g., injections) dominates due to the efficacy of biologics and complex therapies. However, oral and transdermal drug delivery systems are gaining traction owing to enhanced patient convenience.
- By Distribution Channel: Specialty pharmacies are experiencing significant growth as they provide specialized services and expertise in handling complex specialty drugs. However, hospitals and retail pharmacies continue to play a significant role in dispensing specialty medications.
Key Drivers:
- North America: High healthcare expenditure, advanced healthcare infrastructure, strong regulatory support, and early adoption of new technologies.
- Europe: Well-established healthcare systems, significant R&D investments, and growing prevalence of chronic diseases.
- Asia-Pacific: Rising healthcare spending, increasing awareness of chronic diseases, and growing middle class.
Specialty Pharmaceuticals Market Product Developments
The specialty pharmaceuticals market is witnessing rapid product innovation, with a focus on targeted therapies, biologics, and advanced drug delivery systems. These innovations are designed to enhance therapeutic efficacy, improve patient compliance, and minimize side effects. Technological advancements, such as personalized medicine and gene therapy, are transforming the landscape. New products are entering the market, creating significant competition and influencing market share dynamics. The market fit for these products is highly dependent on factors like regulatory approval, pricing strategies, and clinical efficacy data.
Report Scope & Segmentation Analysis
This report comprehensively analyzes the specialty pharmaceuticals market across various segments:
- By Therapeutic Area: Oncology, Inflammatory Conditions, Multiple Sclerosis, Infectious Diseases, Others (Women's Health and Respiratory). Each segment's growth projection and competitive landscape are meticulously examined.
- By Route of Administration: Oral, Parenteral, Transdermal. Market sizes and growth projections for each route of administration are detailed, considering factors such as patient preference and drug efficacy.
- By Distribution Channel: Hospitals, Retail Pharmacies, Specialty Pharmacies. Competitive dynamics within each channel are explored, considering distribution strategies and market access.
Key Drivers of Specialty Pharmaceuticals Market Growth
The specialty pharmaceuticals market's growth is fueled by several key factors: The rising prevalence of chronic diseases globally, particularly cancer and autoimmune disorders, drives demand for innovative therapies. Significant R&D investments by pharmaceutical companies are leading to the development of novel and effective treatments. Favorable regulatory frameworks that expedite the approval process for innovative drugs are also contributing to market expansion. Technological advancements in drug delivery systems and personalized medicine are transforming treatment paradigms.
Challenges in the Specialty Pharmaceuticals Market Sector
Several challenges hinder the growth of the specialty pharmaceuticals market: High drug prices create access barriers, particularly in emerging markets. Stringent regulatory requirements and lengthy approval processes increase the time-to-market for new drugs. Supply chain disruptions and manufacturing complexities can impact drug availability. Intense competition among pharmaceutical companies necessitates robust marketing strategies to gain market share.
Emerging Opportunities in Specialty Pharmaceuticals Market
Several emerging opportunities exist within the specialty pharmaceuticals market: The development of biosimilars offers the potential for more affordable treatments. Personalized medicine approaches provide opportunities for targeted therapies tailored to individual patient needs. Expansion into emerging markets with high unmet needs presents significant growth potential. Advancements in digital health technologies are enhancing patient engagement and treatment adherence.
Leading Players in the Specialty Pharmaceuticals Market Market
Key Developments in Specialty Pharmaceuticals Market Industry
- March 2022: Intellia Therapeutics, Inc. received FDA orphan drug designation for NTLA-5001, a TCR-T cell therapy for acute myeloid leukemia (AML). This significantly accelerates the development and approval process for this innovative treatment.
- February 2022: Optum launched Optum Specialty Fusion, a specialty medication management solution. This initiative aims to improve patient care and reduce the costs associated with complex specialty medications.
Strategic Outlook for Specialty Pharmaceuticals Market Market
The specialty pharmaceuticals market is poised for continued robust growth, driven by the factors discussed above. Future market potential lies in the development and adoption of personalized medicine approaches, expansion into emerging markets, and innovation in drug delivery systems. Opportunities exist for companies to invest in R&D, strategic partnerships, and advanced manufacturing capabilities to maintain a competitive edge. The market presents substantial opportunities for growth and investment.
Specialty Pharmaceuticals Market Segmentation
-
1. Therapeutic Area
- 1.1. Oncology
- 1.2. Inflammatory Conditions
- 1.3. Multiple Sclerosis
- 1.4. Infectious Diseases
- 1.5. Others (Women's Health and Respiratory)
-
2. Route of Administration
- 2.1. Oral
- 2.2. Parenteral
- 2.3. Transdermal
-
3. Distribution Channel
- 3.1. Hospitals
- 3.2. Retail Pharmacies
- 3.3. Specialty Pharmacies
Specialty Pharmaceuticals Market Segmentation By Geography
-
1. North America
- 1.1. United States
- 1.2. Canada
- 1.3. Mexico
-
2. Europe
- 2.1. Germany
- 2.2. United Kingdom
- 2.3. France
- 2.4. Italy
- 2.5. Spain
- 2.6. Rest of Europe
-
3. Asia Pacific
- 3.1. China
- 3.2. Japan
- 3.3. India
- 3.4. Australia
- 3.5. South Korea
- 3.6. Rest of Asia Pacific
-
4. Middle East and Africa
- 4.1. GCC
- 4.2. South Africa
- 4.3. Rest of Middle East and Africa
-
5. South America
- 5.1. Brazil
- 5.2. Argentina
- 5.3. Rest of South America
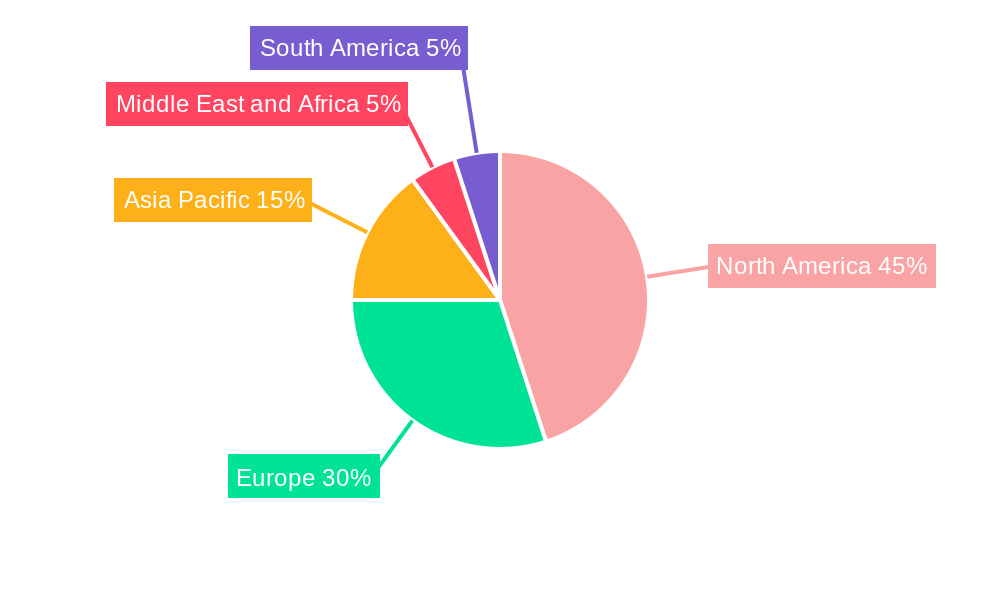
Specialty Pharmaceuticals Market Regional Market Share
Geographic Coverage of Specialty Pharmaceuticals Market
Specialty Pharmaceuticals Market REPORT HIGHLIGHTS
| Aspects | Details |
|---|---|
| Study Period | 2020-2034 |
| Base Year | 2025 |
| Estimated Year | 2026 |
| Forecast Period | 2026-2034 |
| Historical Period | 2020-2025 |
| Growth Rate | CAGR of 26.5% from 2020-2034 |
| Segmentation |
|
Table of Contents
- 1. Introduction
- 1.1. Research Scope
- 1.2. Market Segmentation
- 1.3. Research Objective
- 1.4. Definitions and Assumptions
- 2. Executive Summary
- 2.1. Market Snapshot
- 3. Market Dynamics
- 3.1. Market Drivers
- 3.2. Market Restrains
- 3.3. Market Trends
- 3.4. Market Opportunities
- 4. Market Factor Analysis
- 4.1. Porters Five Forces
- 4.1.1. Bargaining Power of Suppliers
- 4.1.2. Bargaining Power of Buyers
- 4.1.3. Threat of New Entrants
- 4.1.4. Threat of Substitutes
- 4.1.5. Competitive Rivalry
- 4.2. PESTEL analysis
- 4.3. BCG Analysis
- 4.3.1. Stars (High Growth, High Market Share)
- 4.3.2. Cash Cows (Low Growth, High Market Share)
- 4.3.3. Question Mark (High Growth, Low Market Share)
- 4.3.4. Dogs (Low Growth, Low Market Share)
- 4.4. Ansoff Matrix Analysis
- 4.5. Supply Chain Analysis
- 4.6. Regulatory Landscape
- 4.7. Current Market Potential and Opportunity Assessment (TAM–SAM–SOM Framework)
- 4.8. RAX Analyst Note
- 4.1. Porters Five Forces
- 5. Market Analysis, Insights and Forecast 2021-2033
- 5.1. Market Analysis, Insights and Forecast - by Therapeutic Area
- 5.1.1. Oncology
- 5.1.2. Inflammatory Conditions
- 5.1.3. Multiple Sclerosis
- 5.1.4. Infectious Diseases
- 5.1.5. Others (Women's Health and Respiratory)
- 5.2. Market Analysis, Insights and Forecast - by Route of Administration
- 5.2.1. Oral
- 5.2.2. Parenteral
- 5.2.3. Transdermal
- 5.3. Market Analysis, Insights and Forecast - by Distribution Channel
- 5.3.1. Hospitals
- 5.3.2. Retail Pharmacies
- 5.3.3. Specialty Pharmacies
- 5.4. Market Analysis, Insights and Forecast - by Region
- 5.4.1. North America
- 5.4.2. Europe
- 5.4.3. Asia Pacific
- 5.4.4. Middle East and Africa
- 5.4.5. South America
- 5.1. Market Analysis, Insights and Forecast - by Therapeutic Area
- 6. Global Specialty Pharmaceuticals Market Analysis, Insights and Forecast, 2021-2033
- 6.1. Market Analysis, Insights and Forecast - by Therapeutic Area
- 6.1.1. Oncology
- 6.1.2. Inflammatory Conditions
- 6.1.3. Multiple Sclerosis
- 6.1.4. Infectious Diseases
- 6.1.5. Others (Women's Health and Respiratory)
- 6.2. Market Analysis, Insights and Forecast - by Route of Administration
- 6.2.1. Oral
- 6.2.2. Parenteral
- 6.2.3. Transdermal
- 6.3. Market Analysis, Insights and Forecast - by Distribution Channel
- 6.3.1. Hospitals
- 6.3.2. Retail Pharmacies
- 6.3.3. Specialty Pharmacies
- 6.1. Market Analysis, Insights and Forecast - by Therapeutic Area
- 7. North America Specialty Pharmaceuticals Market Analysis, Insights and Forecast, 2020-2032
- 7.1. Market Analysis, Insights and Forecast - by Therapeutic Area
- 7.1.1. Oncology
- 7.1.2. Inflammatory Conditions
- 7.1.3. Multiple Sclerosis
- 7.1.4. Infectious Diseases
- 7.1.5. Others (Women's Health and Respiratory)
- 7.2. Market Analysis, Insights and Forecast - by Route of Administration
- 7.2.1. Oral
- 7.2.2. Parenteral
- 7.2.3. Transdermal
- 7.3. Market Analysis, Insights and Forecast - by Distribution Channel
- 7.3.1. Hospitals
- 7.3.2. Retail Pharmacies
- 7.3.3. Specialty Pharmacies
- 7.1. Market Analysis, Insights and Forecast - by Therapeutic Area
- 8. Europe Specialty Pharmaceuticals Market Analysis, Insights and Forecast, 2020-2032
- 8.1. Market Analysis, Insights and Forecast - by Therapeutic Area
- 8.1.1. Oncology
- 8.1.2. Inflammatory Conditions
- 8.1.3. Multiple Sclerosis
- 8.1.4. Infectious Diseases
- 8.1.5. Others (Women's Health and Respiratory)
- 8.2. Market Analysis, Insights and Forecast - by Route of Administration
- 8.2.1. Oral
- 8.2.2. Parenteral
- 8.2.3. Transdermal
- 8.3. Market Analysis, Insights and Forecast - by Distribution Channel
- 8.3.1. Hospitals
- 8.3.2. Retail Pharmacies
- 8.3.3. Specialty Pharmacies
- 8.1. Market Analysis, Insights and Forecast - by Therapeutic Area
- 9. Asia Pacific Specialty Pharmaceuticals Market Analysis, Insights and Forecast, 2020-2032
- 9.1. Market Analysis, Insights and Forecast - by Therapeutic Area
- 9.1.1. Oncology
- 9.1.2. Inflammatory Conditions
- 9.1.3. Multiple Sclerosis
- 9.1.4. Infectious Diseases
- 9.1.5. Others (Women's Health and Respiratory)
- 9.2. Market Analysis, Insights and Forecast - by Route of Administration
- 9.2.1. Oral
- 9.2.2. Parenteral
- 9.2.3. Transdermal
- 9.3. Market Analysis, Insights and Forecast - by Distribution Channel
- 9.3.1. Hospitals
- 9.3.2. Retail Pharmacies
- 9.3.3. Specialty Pharmacies
- 9.1. Market Analysis, Insights and Forecast - by Therapeutic Area
- 10. Middle East and Africa Specialty Pharmaceuticals Market Analysis, Insights and Forecast, 2020-2032
- 10.1. Market Analysis, Insights and Forecast - by Therapeutic Area
- 10.1.1. Oncology
- 10.1.2. Inflammatory Conditions
- 10.1.3. Multiple Sclerosis
- 10.1.4. Infectious Diseases
- 10.1.5. Others (Women's Health and Respiratory)
- 10.2. Market Analysis, Insights and Forecast - by Route of Administration
- 10.2.1. Oral
- 10.2.2. Parenteral
- 10.2.3. Transdermal
- 10.3. Market Analysis, Insights and Forecast - by Distribution Channel
- 10.3.1. Hospitals
- 10.3.2. Retail Pharmacies
- 10.3.3. Specialty Pharmacies
- 10.1. Market Analysis, Insights and Forecast - by Therapeutic Area
- 11. South America Specialty Pharmaceuticals Market Analysis, Insights and Forecast, 2020-2032
- 11.1. Market Analysis, Insights and Forecast - by Therapeutic Area
- 11.1.1. Oncology
- 11.1.2. Inflammatory Conditions
- 11.1.3. Multiple Sclerosis
- 11.1.4. Infectious Diseases
- 11.1.5. Others (Women's Health and Respiratory)
- 11.2. Market Analysis, Insights and Forecast - by Route of Administration
- 11.2.1. Oral
- 11.2.2. Parenteral
- 11.2.3. Transdermal
- 11.3. Market Analysis, Insights and Forecast - by Distribution Channel
- 11.3.1. Hospitals
- 11.3.2. Retail Pharmacies
- 11.3.3. Specialty Pharmacies
- 11.1. Market Analysis, Insights and Forecast - by Therapeutic Area
- 12. Competitive Analysis
- 12.1. Company Profiles
- 12.1.1 Pfizer
- 12.1.1.1. Company Overview
- 12.1.1.2. Products
- 12.1.1.3. Company Financials
- 12.1.1.4. SWOT Analysis
- 12.1.2 Sanofi
- 12.1.2.1. Company Overview
- 12.1.2.2. Products
- 12.1.2.3. Company Financials
- 12.1.2.4. SWOT Analysis
- 12.1.3 Novartis AG
- 12.1.3.1. Company Overview
- 12.1.3.2. Products
- 12.1.3.3. Company Financials
- 12.1.3.4. SWOT Analysis
- 12.1.4 Amgen Inc
- 12.1.4.1. Company Overview
- 12.1.4.2. Products
- 12.1.4.3. Company Financials
- 12.1.4.4. SWOT Analysis
- 12.1.5 Merck & Co Inc
- 12.1.5.1. Company Overview
- 12.1.5.2. Products
- 12.1.5.3. Company Financials
- 12.1.5.4. SWOT Analysis
- 12.1.6 F Hoffmann-La Roche Ltd
- 12.1.6.1. Company Overview
- 12.1.6.2. Products
- 12.1.6.3. Company Financials
- 12.1.6.4. SWOT Analysis
- 12.1.7 Johnson and Johnson
- 12.1.7.1. Company Overview
- 12.1.7.2. Products
- 12.1.7.3. Company Financials
- 12.1.7.4. SWOT Analysis
- 12.1.8 Teva Pharmaceutical Industries Ltd
- 12.1.8.1. Company Overview
- 12.1.8.2. Products
- 12.1.8.3. Company Financials
- 12.1.8.4. SWOT Analysis
- 12.1.9 Viatris
- 12.1.9.1. Company Overview
- 12.1.9.2. Products
- 12.1.9.3. Company Financials
- 12.1.9.4. SWOT Analysis
- 12.1.10 AbbVie Inc
- 12.1.10.1. Company Overview
- 12.1.10.2. Products
- 12.1.10.3. Company Financials
- 12.1.10.4. SWOT Analysis
- 12.1.11 Gilead Sciences Inc
- 12.1.11.1. Company Overview
- 12.1.11.2. Products
- 12.1.11.3. Company Financials
- 12.1.11.4. SWOT Analysis
- 12.1.12 Bristol-Myers Squibb Company
- 12.1.12.1. Company Overview
- 12.1.12.2. Products
- 12.1.12.3. Company Financials
- 12.1.12.4. SWOT Analysis
- 12.1.1 Pfizer
- 12.2. Market Entropy
- 12.2.1 Company's Key Areas Served
- 12.2.2 Recent Developments
- 12.3. Company Market Share Analysis 2025
- 12.3.1 Top 5 Companies Market Share Analysis
- 12.3.2 Top 3 Companies Market Share Analysis
- 12.4. List of Potential Customers
- 13. Research Methodology
List of Figures
- Figure 1: Global Specialty Pharmaceuticals Market Revenue Breakdown (billion, %) by Region 2025 & 2033
- Figure 2: Global Specialty Pharmaceuticals Market Volume Breakdown (K Unit, %) by Region 2025 & 2033
- Figure 3: North America Specialty Pharmaceuticals Market Revenue (billion), by Therapeutic Area 2025 & 2033
- Figure 4: North America Specialty Pharmaceuticals Market Volume (K Unit), by Therapeutic Area 2025 & 2033
- Figure 5: North America Specialty Pharmaceuticals Market Revenue Share (%), by Therapeutic Area 2025 & 2033
- Figure 6: North America Specialty Pharmaceuticals Market Volume Share (%), by Therapeutic Area 2025 & 2033
- Figure 7: North America Specialty Pharmaceuticals Market Revenue (billion), by Route of Administration 2025 & 2033
- Figure 8: North America Specialty Pharmaceuticals Market Volume (K Unit), by Route of Administration 2025 & 2033
- Figure 9: North America Specialty Pharmaceuticals Market Revenue Share (%), by Route of Administration 2025 & 2033
- Figure 10: North America Specialty Pharmaceuticals Market Volume Share (%), by Route of Administration 2025 & 2033
- Figure 11: North America Specialty Pharmaceuticals Market Revenue (billion), by Distribution Channel 2025 & 2033
- Figure 12: North America Specialty Pharmaceuticals Market Volume (K Unit), by Distribution Channel 2025 & 2033
- Figure 13: North America Specialty Pharmaceuticals Market Revenue Share (%), by Distribution Channel 2025 & 2033
- Figure 14: North America Specialty Pharmaceuticals Market Volume Share (%), by Distribution Channel 2025 & 2033
- Figure 15: North America Specialty Pharmaceuticals Market Revenue (billion), by Country 2025 & 2033
- Figure 16: North America Specialty Pharmaceuticals Market Volume (K Unit), by Country 2025 & 2033
- Figure 17: North America Specialty Pharmaceuticals Market Revenue Share (%), by Country 2025 & 2033
- Figure 18: North America Specialty Pharmaceuticals Market Volume Share (%), by Country 2025 & 2033
- Figure 19: Europe Specialty Pharmaceuticals Market Revenue (billion), by Therapeutic Area 2025 & 2033
- Figure 20: Europe Specialty Pharmaceuticals Market Volume (K Unit), by Therapeutic Area 2025 & 2033
- Figure 21: Europe Specialty Pharmaceuticals Market Revenue Share (%), by Therapeutic Area 2025 & 2033
- Figure 22: Europe Specialty Pharmaceuticals Market Volume Share (%), by Therapeutic Area 2025 & 2033
- Figure 23: Europe Specialty Pharmaceuticals Market Revenue (billion), by Route of Administration 2025 & 2033
- Figure 24: Europe Specialty Pharmaceuticals Market Volume (K Unit), by Route of Administration 2025 & 2033
- Figure 25: Europe Specialty Pharmaceuticals Market Revenue Share (%), by Route of Administration 2025 & 2033
- Figure 26: Europe Specialty Pharmaceuticals Market Volume Share (%), by Route of Administration 2025 & 2033
- Figure 27: Europe Specialty Pharmaceuticals Market Revenue (billion), by Distribution Channel 2025 & 2033
- Figure 28: Europe Specialty Pharmaceuticals Market Volume (K Unit), by Distribution Channel 2025 & 2033
- Figure 29: Europe Specialty Pharmaceuticals Market Revenue Share (%), by Distribution Channel 2025 & 2033
- Figure 30: Europe Specialty Pharmaceuticals Market Volume Share (%), by Distribution Channel 2025 & 2033
- Figure 31: Europe Specialty Pharmaceuticals Market Revenue (billion), by Country 2025 & 2033
- Figure 32: Europe Specialty Pharmaceuticals Market Volume (K Unit), by Country 2025 & 2033
- Figure 33: Europe Specialty Pharmaceuticals Market Revenue Share (%), by Country 2025 & 2033
- Figure 34: Europe Specialty Pharmaceuticals Market Volume Share (%), by Country 2025 & 2033
- Figure 35: Asia Pacific Specialty Pharmaceuticals Market Revenue (billion), by Therapeutic Area 2025 & 2033
- Figure 36: Asia Pacific Specialty Pharmaceuticals Market Volume (K Unit), by Therapeutic Area 2025 & 2033
- Figure 37: Asia Pacific Specialty Pharmaceuticals Market Revenue Share (%), by Therapeutic Area 2025 & 2033
- Figure 38: Asia Pacific Specialty Pharmaceuticals Market Volume Share (%), by Therapeutic Area 2025 & 2033
- Figure 39: Asia Pacific Specialty Pharmaceuticals Market Revenue (billion), by Route of Administration 2025 & 2033
- Figure 40: Asia Pacific Specialty Pharmaceuticals Market Volume (K Unit), by Route of Administration 2025 & 2033
- Figure 41: Asia Pacific Specialty Pharmaceuticals Market Revenue Share (%), by Route of Administration 2025 & 2033
- Figure 42: Asia Pacific Specialty Pharmaceuticals Market Volume Share (%), by Route of Administration 2025 & 2033
- Figure 43: Asia Pacific Specialty Pharmaceuticals Market Revenue (billion), by Distribution Channel 2025 & 2033
- Figure 44: Asia Pacific Specialty Pharmaceuticals Market Volume (K Unit), by Distribution Channel 2025 & 2033
- Figure 45: Asia Pacific Specialty Pharmaceuticals Market Revenue Share (%), by Distribution Channel 2025 & 2033
- Figure 46: Asia Pacific Specialty Pharmaceuticals Market Volume Share (%), by Distribution Channel 2025 & 2033
- Figure 47: Asia Pacific Specialty Pharmaceuticals Market Revenue (billion), by Country 2025 & 2033
- Figure 48: Asia Pacific Specialty Pharmaceuticals Market Volume (K Unit), by Country 2025 & 2033
- Figure 49: Asia Pacific Specialty Pharmaceuticals Market Revenue Share (%), by Country 2025 & 2033
- Figure 50: Asia Pacific Specialty Pharmaceuticals Market Volume Share (%), by Country 2025 & 2033
- Figure 51: Middle East and Africa Specialty Pharmaceuticals Market Revenue (billion), by Therapeutic Area 2025 & 2033
- Figure 52: Middle East and Africa Specialty Pharmaceuticals Market Volume (K Unit), by Therapeutic Area 2025 & 2033
- Figure 53: Middle East and Africa Specialty Pharmaceuticals Market Revenue Share (%), by Therapeutic Area 2025 & 2033
- Figure 54: Middle East and Africa Specialty Pharmaceuticals Market Volume Share (%), by Therapeutic Area 2025 & 2033
- Figure 55: Middle East and Africa Specialty Pharmaceuticals Market Revenue (billion), by Route of Administration 2025 & 2033
- Figure 56: Middle East and Africa Specialty Pharmaceuticals Market Volume (K Unit), by Route of Administration 2025 & 2033
- Figure 57: Middle East and Africa Specialty Pharmaceuticals Market Revenue Share (%), by Route of Administration 2025 & 2033
- Figure 58: Middle East and Africa Specialty Pharmaceuticals Market Volume Share (%), by Route of Administration 2025 & 2033
- Figure 59: Middle East and Africa Specialty Pharmaceuticals Market Revenue (billion), by Distribution Channel 2025 & 2033
- Figure 60: Middle East and Africa Specialty Pharmaceuticals Market Volume (K Unit), by Distribution Channel 2025 & 2033
- Figure 61: Middle East and Africa Specialty Pharmaceuticals Market Revenue Share (%), by Distribution Channel 2025 & 2033
- Figure 62: Middle East and Africa Specialty Pharmaceuticals Market Volume Share (%), by Distribution Channel 2025 & 2033
- Figure 63: Middle East and Africa Specialty Pharmaceuticals Market Revenue (billion), by Country 2025 & 2033
- Figure 64: Middle East and Africa Specialty Pharmaceuticals Market Volume (K Unit), by Country 2025 & 2033
- Figure 65: Middle East and Africa Specialty Pharmaceuticals Market Revenue Share (%), by Country 2025 & 2033
- Figure 66: Middle East and Africa Specialty Pharmaceuticals Market Volume Share (%), by Country 2025 & 2033
- Figure 67: South America Specialty Pharmaceuticals Market Revenue (billion), by Therapeutic Area 2025 & 2033
- Figure 68: South America Specialty Pharmaceuticals Market Volume (K Unit), by Therapeutic Area 2025 & 2033
- Figure 69: South America Specialty Pharmaceuticals Market Revenue Share (%), by Therapeutic Area 2025 & 2033
- Figure 70: South America Specialty Pharmaceuticals Market Volume Share (%), by Therapeutic Area 2025 & 2033
- Figure 71: South America Specialty Pharmaceuticals Market Revenue (billion), by Route of Administration 2025 & 2033
- Figure 72: South America Specialty Pharmaceuticals Market Volume (K Unit), by Route of Administration 2025 & 2033
- Figure 73: South America Specialty Pharmaceuticals Market Revenue Share (%), by Route of Administration 2025 & 2033
- Figure 74: South America Specialty Pharmaceuticals Market Volume Share (%), by Route of Administration 2025 & 2033
- Figure 75: South America Specialty Pharmaceuticals Market Revenue (billion), by Distribution Channel 2025 & 2033
- Figure 76: South America Specialty Pharmaceuticals Market Volume (K Unit), by Distribution Channel 2025 & 2033
- Figure 77: South America Specialty Pharmaceuticals Market Revenue Share (%), by Distribution Channel 2025 & 2033
- Figure 78: South America Specialty Pharmaceuticals Market Volume Share (%), by Distribution Channel 2025 & 2033
- Figure 79: South America Specialty Pharmaceuticals Market Revenue (billion), by Country 2025 & 2033
- Figure 80: South America Specialty Pharmaceuticals Market Volume (K Unit), by Country 2025 & 2033
- Figure 81: South America Specialty Pharmaceuticals Market Revenue Share (%), by Country 2025 & 2033
- Figure 82: South America Specialty Pharmaceuticals Market Volume Share (%), by Country 2025 & 2033
List of Tables
- Table 1: Global Specialty Pharmaceuticals Market Revenue billion Forecast, by Therapeutic Area 2020 & 2033
- Table 2: Global Specialty Pharmaceuticals Market Volume K Unit Forecast, by Therapeutic Area 2020 & 2033
- Table 3: Global Specialty Pharmaceuticals Market Revenue billion Forecast, by Route of Administration 2020 & 2033
- Table 4: Global Specialty Pharmaceuticals Market Volume K Unit Forecast, by Route of Administration 2020 & 2033
- Table 5: Global Specialty Pharmaceuticals Market Revenue billion Forecast, by Distribution Channel 2020 & 2033
- Table 6: Global Specialty Pharmaceuticals Market Volume K Unit Forecast, by Distribution Channel 2020 & 2033
- Table 7: Global Specialty Pharmaceuticals Market Revenue billion Forecast, by Region 2020 & 2033
- Table 8: Global Specialty Pharmaceuticals Market Volume K Unit Forecast, by Region 2020 & 2033
- Table 9: Global Specialty Pharmaceuticals Market Revenue billion Forecast, by Therapeutic Area 2020 & 2033
- Table 10: Global Specialty Pharmaceuticals Market Volume K Unit Forecast, by Therapeutic Area 2020 & 2033
- Table 11: Global Specialty Pharmaceuticals Market Revenue billion Forecast, by Route of Administration 2020 & 2033
- Table 12: Global Specialty Pharmaceuticals Market Volume K Unit Forecast, by Route of Administration 2020 & 2033
- Table 13: Global Specialty Pharmaceuticals Market Revenue billion Forecast, by Distribution Channel 2020 & 2033
- Table 14: Global Specialty Pharmaceuticals Market Volume K Unit Forecast, by Distribution Channel 2020 & 2033
- Table 15: Global Specialty Pharmaceuticals Market Revenue billion Forecast, by Country 2020 & 2033
- Table 16: Global Specialty Pharmaceuticals Market Volume K Unit Forecast, by Country 2020 & 2033
- Table 17: United States Specialty Pharmaceuticals Market Revenue (billion) Forecast, by Application 2020 & 2033
- Table 18: United States Specialty Pharmaceuticals Market Volume (K Unit) Forecast, by Application 2020 & 2033
- Table 19: Canada Specialty Pharmaceuticals Market Revenue (billion) Forecast, by Application 2020 & 2033
- Table 20: Canada Specialty Pharmaceuticals Market Volume (K Unit) Forecast, by Application 2020 & 2033
- Table 21: Mexico Specialty Pharmaceuticals Market Revenue (billion) Forecast, by Application 2020 & 2033
- Table 22: Mexico Specialty Pharmaceuticals Market Volume (K Unit) Forecast, by Application 2020 & 2033
- Table 23: Global Specialty Pharmaceuticals Market Revenue billion Forecast, by Therapeutic Area 2020 & 2033
- Table 24: Global Specialty Pharmaceuticals Market Volume K Unit Forecast, by Therapeutic Area 2020 & 2033
- Table 25: Global Specialty Pharmaceuticals Market Revenue billion Forecast, by Route of Administration 2020 & 2033
- Table 26: Global Specialty Pharmaceuticals Market Volume K Unit Forecast, by Route of Administration 2020 & 2033
- Table 27: Global Specialty Pharmaceuticals Market Revenue billion Forecast, by Distribution Channel 2020 & 2033
- Table 28: Global Specialty Pharmaceuticals Market Volume K Unit Forecast, by Distribution Channel 2020 & 2033
- Table 29: Global Specialty Pharmaceuticals Market Revenue billion Forecast, by Country 2020 & 2033
- Table 30: Global Specialty Pharmaceuticals Market Volume K Unit Forecast, by Country 2020 & 2033
- Table 31: Germany Specialty Pharmaceuticals Market Revenue (billion) Forecast, by Application 2020 & 2033
- Table 32: Germany Specialty Pharmaceuticals Market Volume (K Unit) Forecast, by Application 2020 & 2033
- Table 33: United Kingdom Specialty Pharmaceuticals Market Revenue (billion) Forecast, by Application 2020 & 2033
- Table 34: United Kingdom Specialty Pharmaceuticals Market Volume (K Unit) Forecast, by Application 2020 & 2033
- Table 35: France Specialty Pharmaceuticals Market Revenue (billion) Forecast, by Application 2020 & 2033
- Table 36: France Specialty Pharmaceuticals Market Volume (K Unit) Forecast, by Application 2020 & 2033
- Table 37: Italy Specialty Pharmaceuticals Market Revenue (billion) Forecast, by Application 2020 & 2033
- Table 38: Italy Specialty Pharmaceuticals Market Volume (K Unit) Forecast, by Application 2020 & 2033
- Table 39: Spain Specialty Pharmaceuticals Market Revenue (billion) Forecast, by Application 2020 & 2033
- Table 40: Spain Specialty Pharmaceuticals Market Volume (K Unit) Forecast, by Application 2020 & 2033
- Table 41: Rest of Europe Specialty Pharmaceuticals Market Revenue (billion) Forecast, by Application 2020 & 2033
- Table 42: Rest of Europe Specialty Pharmaceuticals Market Volume (K Unit) Forecast, by Application 2020 & 2033
- Table 43: Global Specialty Pharmaceuticals Market Revenue billion Forecast, by Therapeutic Area 2020 & 2033
- Table 44: Global Specialty Pharmaceuticals Market Volume K Unit Forecast, by Therapeutic Area 2020 & 2033
- Table 45: Global Specialty Pharmaceuticals Market Revenue billion Forecast, by Route of Administration 2020 & 2033
- Table 46: Global Specialty Pharmaceuticals Market Volume K Unit Forecast, by Route of Administration 2020 & 2033
- Table 47: Global Specialty Pharmaceuticals Market Revenue billion Forecast, by Distribution Channel 2020 & 2033
- Table 48: Global Specialty Pharmaceuticals Market Volume K Unit Forecast, by Distribution Channel 2020 & 2033
- Table 49: Global Specialty Pharmaceuticals Market Revenue billion Forecast, by Country 2020 & 2033
- Table 50: Global Specialty Pharmaceuticals Market Volume K Unit Forecast, by Country 2020 & 2033
- Table 51: China Specialty Pharmaceuticals Market Revenue (billion) Forecast, by Application 2020 & 2033
- Table 52: China Specialty Pharmaceuticals Market Volume (K Unit) Forecast, by Application 2020 & 2033
- Table 53: Japan Specialty Pharmaceuticals Market Revenue (billion) Forecast, by Application 2020 & 2033
- Table 54: Japan Specialty Pharmaceuticals Market Volume (K Unit) Forecast, by Application 2020 & 2033
- Table 55: India Specialty Pharmaceuticals Market Revenue (billion) Forecast, by Application 2020 & 2033
- Table 56: India Specialty Pharmaceuticals Market Volume (K Unit) Forecast, by Application 2020 & 2033
- Table 57: Australia Specialty Pharmaceuticals Market Revenue (billion) Forecast, by Application 2020 & 2033
- Table 58: Australia Specialty Pharmaceuticals Market Volume (K Unit) Forecast, by Application 2020 & 2033
- Table 59: South Korea Specialty Pharmaceuticals Market Revenue (billion) Forecast, by Application 2020 & 2033
- Table 60: South Korea Specialty Pharmaceuticals Market Volume (K Unit) Forecast, by Application 2020 & 2033
- Table 61: Rest of Asia Pacific Specialty Pharmaceuticals Market Revenue (billion) Forecast, by Application 2020 & 2033
- Table 62: Rest of Asia Pacific Specialty Pharmaceuticals Market Volume (K Unit) Forecast, by Application 2020 & 2033
- Table 63: Global Specialty Pharmaceuticals Market Revenue billion Forecast, by Therapeutic Area 2020 & 2033
- Table 64: Global Specialty Pharmaceuticals Market Volume K Unit Forecast, by Therapeutic Area 2020 & 2033
- Table 65: Global Specialty Pharmaceuticals Market Revenue billion Forecast, by Route of Administration 2020 & 2033
- Table 66: Global Specialty Pharmaceuticals Market Volume K Unit Forecast, by Route of Administration 2020 & 2033
- Table 67: Global Specialty Pharmaceuticals Market Revenue billion Forecast, by Distribution Channel 2020 & 2033
- Table 68: Global Specialty Pharmaceuticals Market Volume K Unit Forecast, by Distribution Channel 2020 & 2033
- Table 69: Global Specialty Pharmaceuticals Market Revenue billion Forecast, by Country 2020 & 2033
- Table 70: Global Specialty Pharmaceuticals Market Volume K Unit Forecast, by Country 2020 & 2033
- Table 71: GCC Specialty Pharmaceuticals Market Revenue (billion) Forecast, by Application 2020 & 2033
- Table 72: GCC Specialty Pharmaceuticals Market Volume (K Unit) Forecast, by Application 2020 & 2033
- Table 73: South Africa Specialty Pharmaceuticals Market Revenue (billion) Forecast, by Application 2020 & 2033
- Table 74: South Africa Specialty Pharmaceuticals Market Volume (K Unit) Forecast, by Application 2020 & 2033
- Table 75: Rest of Middle East and Africa Specialty Pharmaceuticals Market Revenue (billion) Forecast, by Application 2020 & 2033
- Table 76: Rest of Middle East and Africa Specialty Pharmaceuticals Market Volume (K Unit) Forecast, by Application 2020 & 2033
- Table 77: Global Specialty Pharmaceuticals Market Revenue billion Forecast, by Therapeutic Area 2020 & 2033
- Table 78: Global Specialty Pharmaceuticals Market Volume K Unit Forecast, by Therapeutic Area 2020 & 2033
- Table 79: Global Specialty Pharmaceuticals Market Revenue billion Forecast, by Route of Administration 2020 & 2033
- Table 80: Global Specialty Pharmaceuticals Market Volume K Unit Forecast, by Route of Administration 2020 & 2033
- Table 81: Global Specialty Pharmaceuticals Market Revenue billion Forecast, by Distribution Channel 2020 & 2033
- Table 82: Global Specialty Pharmaceuticals Market Volume K Unit Forecast, by Distribution Channel 2020 & 2033
- Table 83: Global Specialty Pharmaceuticals Market Revenue billion Forecast, by Country 2020 & 2033
- Table 84: Global Specialty Pharmaceuticals Market Volume K Unit Forecast, by Country 2020 & 2033
- Table 85: Brazil Specialty Pharmaceuticals Market Revenue (billion) Forecast, by Application 2020 & 2033
- Table 86: Brazil Specialty Pharmaceuticals Market Volume (K Unit) Forecast, by Application 2020 & 2033
- Table 87: Argentina Specialty Pharmaceuticals Market Revenue (billion) Forecast, by Application 2020 & 2033
- Table 88: Argentina Specialty Pharmaceuticals Market Volume (K Unit) Forecast, by Application 2020 & 2033
- Table 89: Rest of South America Specialty Pharmaceuticals Market Revenue (billion) Forecast, by Application 2020 & 2033
- Table 90: Rest of South America Specialty Pharmaceuticals Market Volume (K Unit) Forecast, by Application 2020 & 2033
Frequently Asked Questions
1. What is the projected Compound Annual Growth Rate (CAGR) of the Specialty Pharmaceuticals Market?
The projected CAGR is approximately 26.5%.
2. Which companies are prominent players in the Specialty Pharmaceuticals Market?
Key companies in the market include Pfizer, Sanofi, Novartis AG, Amgen Inc, Merck & Co Inc, F Hoffmann-La Roche Ltd, Johnson and Johnson, Teva Pharmaceutical Industries Ltd, Viatris, AbbVie Inc, Gilead Sciences Inc, Bristol-Myers Squibb Company.
3. What are the main segments of the Specialty Pharmaceuticals Market?
The market segments include Therapeutic Area, Route of Administration, Distribution Channel.
4. Can you provide details about the market size?
The market size is estimated to be USD 285.1 billion as of 2022.
5. What are some drivers contributing to market growth?
Increasing Burden of Chronic and Rare Diseases; Growing Research and Development Activities.
6. What are the notable trends driving market growth?
Oncology Segment is Expected to Account for the Large Market Share Over the Forecast Period.
7. Are there any restraints impacting market growth?
High Cost of Drugs.
8. Can you provide examples of recent developments in the market?
In March 2022, Intellia Therapeutics, Inc. received US Food and Drug Administration (FDA) orphan drug designation for Intellia's ex vivo investigational T cell receptor (TCR)-T cell therapy, NTLA-5001, for the treatment of acute myeloid leukemia (AML).
9. What pricing options are available for accessing the report?
Pricing options include single-user, multi-user, and enterprise licenses priced at USD 4750, USD 5250, and USD 8750 respectively.
10. Is the market size provided in terms of value or volume?
The market size is provided in terms of value, measured in billion and volume, measured in K Unit.
11. Are there any specific market keywords associated with the report?
Yes, the market keyword associated with the report is "Specialty Pharmaceuticals Market," which aids in identifying and referencing the specific market segment covered.
12. How do I determine which pricing option suits my needs best?
The pricing options vary based on user requirements and access needs. Individual users may opt for single-user licenses, while businesses requiring broader access may choose multi-user or enterprise licenses for cost-effective access to the report.
13. Are there any additional resources or data provided in the Specialty Pharmaceuticals Market report?
While the report offers comprehensive insights, it's advisable to review the specific contents or supplementary materials provided to ascertain if additional resources or data are available.
14. How can I stay updated on further developments or reports in the Specialty Pharmaceuticals Market?
To stay informed about further developments, trends, and reports in the Specialty Pharmaceuticals Market, consider subscribing to industry newsletters, following relevant companies and organizations, or regularly checking reputable industry news sources and publications.
Methodology
Step 1 - Identification of Relevant Samples Size from Population Database


Step 2 - Approaches for Defining Global Market Size (Value, Volume* & Price*)

Note*: In applicable scenarios
Step 3 - Data Sources
Primary Research
- Web Analytics
- Survey Reports
- Research Institute
- Latest Research Reports
- Opinion Leaders
Secondary Research
- Annual Reports
- White Paper
- Latest Press Release
- Industry Association
- Paid Database
- Investor Presentations

Step 4 - Data Triangulation
Involves using different sources of information in order to increase the validity of a study
These sources are likely to be stakeholders in a program - participants, other researchers, program staff, other community members, and so on.
Then we put all data in single framework & apply various statistical tools to find out the dynamic on the market.
During the analysis stage, feedback from the stakeholder groups would be compared to determine areas of agreement as well as areas of divergence