

Key Insights
The global Spectrum and Signal Analyzers market is poised for significant expansion, driven by relentless innovation and escalating demand across critical industries. In 2024, the market is valued at $1.35 billion, projected to grow at a robust Compound Annual Growth Rate (CAGR) of 5.98% throughout the forecast period of 2025-2033. This expansion is fueled by several key drivers, including the burgeoning need for advanced wireless communication technologies, the rapid proliferation of 5G deployment, and the increasing complexity of electronic systems in sectors like automotive, aerospace & defense, and telecommunications. The continuous evolution of radar systems, satellite communications, and the Internet of Things (IoT) ecosystem further amplifies the demand for sophisticated spectrum and signal analysis solutions. Emerging trends such as the integration of artificial intelligence (AI) and machine learning (ML) into analyzer functionalities are enhancing their predictive capabilities and efficiency, enabling more accurate troubleshooting and performance optimization. Furthermore, the growing adoption of portable and cloud-connected spectrum analyzers is democratizing access to these critical tools for a wider range of users and applications.
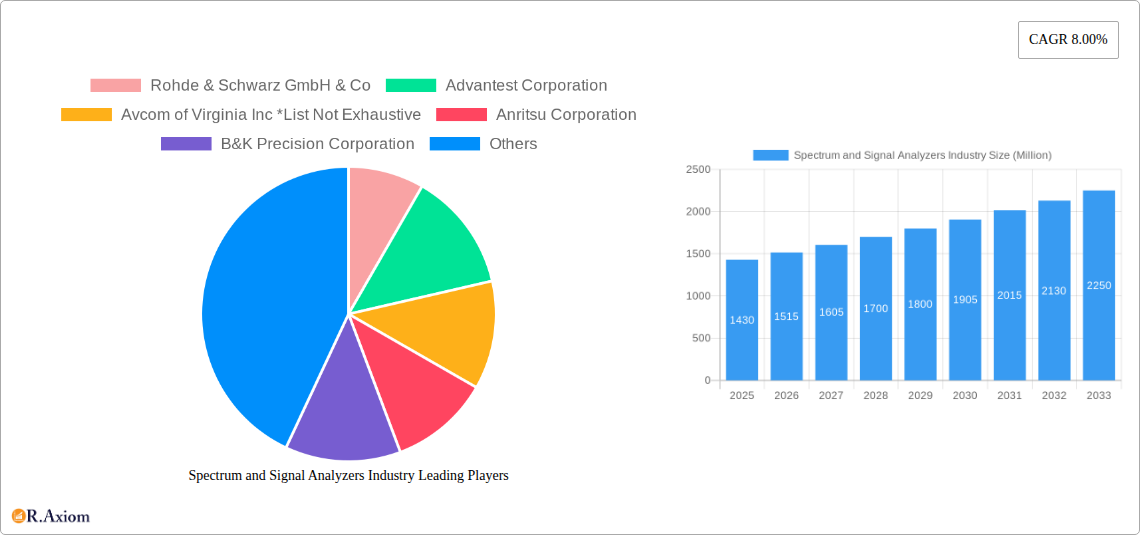
Spectrum and Signal Analyzers Industry Market Size (In Billion)
Despite the promising growth trajectory, the market faces certain restraints that could temper its pace. The high cost of advanced spectrum and signal analyzers, coupled with the need for specialized technical expertise for their operation, can present a barrier to entry for smaller organizations or emerging markets. Additionally, stringent regulatory compliance requirements in certain industries and geographical regions can add complexity and time to product development and deployment cycles. Nevertheless, the market is actively segmenting to cater to diverse needs. Key frequency range segments include Less than 6 GHz, 6-18 GHz, and More than 18 GHz, each serving distinct applications. The primary end-user industries driving adoption are IT & Telecommunication, Automotive, Aerospace & Defense, and Healthcare, with Other End-user Industries also contributing to market demand. Major players like Keysight Technologies, Rohde & Schwarz, and Anritsu Corporation are at the forefront of innovation, developing next-generation solutions to meet the evolving demands of this dynamic market.

Spectrum and Signal Analyzers Industry Company Market Share
This in-depth market research report provides a detailed analysis of the global Spectrum and Signal Analyzers Industry, covering market dynamics, trends, key players, and future projections. The study encompasses the Historical Period (2019-2024), Base Year (2025), and a robust Forecast Period (2025-2033), with a Study Period spanning from 2019 to 2033. Leveraging high-traffic keywords such as RF spectrum analyzer, signal intelligence, wireless testing, 5G test equipment, IoT testing, EMI/EMC testing, frequency range analysis, and aerospace & defense electronics, this report offers actionable insights for stakeholders seeking to capitalize on the evolving landscape of spectrum and signal analysis technologies. The global market is projected to reach billions in value by 2033, driven by advancements in wireless communication, increasing adoption of advanced technologies across various end-user industries, and the growing need for precise signal measurement and analysis.
Spectrum and Signal Analyzers Industry Market Concentration & Innovation
The Spectrum and Signal Analyzers Industry exhibits a moderate to high degree of market concentration, with a few dominant players holding significant market share, estimated to be in the billions of USD. Key companies like Keysight Technologies Inc., Rohde & Schwarz GmbH & Co., and Anritsu Corporation are at the forefront, investing heavily in research and development to maintain their competitive edge. Innovation is primarily driven by the relentless pace of technological advancements in wireless communication, including the deployment of 5G and the emerging 6G technologies, the proliferation of the Internet of Things (IoT), and the increasing complexity of electronic systems in sectors like automotive and aerospace. Regulatory frameworks, particularly those governing spectrum allocation and electromagnetic compatibility (EMC), also play a crucial role in shaping product development and market access. While direct product substitutes are limited, the increasing availability of software-defined solutions and integrated testing platforms can be considered indirect alternatives. End-user trends are characterized by a growing demand for portable, versatile, and high-performance analyzers capable of operating across a wide range of frequency ranges, from less than 6 GHz to beyond 18 GHz. Merger and acquisition (M&A) activities, with deal values potentially reaching hundreds of millions of USD, are strategic moves by leading companies to expand their product portfolios, acquire new technologies, and strengthen their market presence.
Spectrum and Signal Analyzers Industry Industry Trends & Insights
The Spectrum and Signal Analyzers Industry is on a robust growth trajectory, fueled by a confluence of technological advancements, expanding market applications, and an increasing reliance on sophisticated wireless communication systems. The global market is experiencing a significant Compound Annual Growth Rate (CAGR), estimated to be in the high single digits, translating into market valuations soaring into the tens of billions of USD by the end of the forecast period. Key growth drivers include the ubiquitous adoption of 5G technology and the ongoing research and development for 6G, which necessitate advanced spectrum analysis tools for efficient spectrum utilization, interference detection, and signal integrity testing. The burgeoning Internet of Things (IoT) ecosystem, with its billions of connected devices, creates a continuous demand for spectrum analyzers to ensure seamless connectivity, troubleshoot network issues, and validate device performance across diverse applications. The Automotive industry's rapid evolution, particularly the integration of advanced driver-assistance systems (ADAS), autonomous driving technologies, and in-car connectivity, requires precise RF testing for vehicle-to-everything (V2X) communication and radar systems. Similarly, the Aerospace & Defense sector relies heavily on spectrum analyzers for radar systems, electronic warfare, satellite communications, and secure communication networks, driving demand for high-frequency and high-performance instruments.
Technological disruptions, such as the advancement of software-defined radio (SDR) and artificial intelligence (AI) integration in test and measurement equipment, are enhancing the capabilities of spectrum analyzers, enabling real-time analysis, automated troubleshooting, and predictive maintenance. Consumer preferences are shifting towards smaller, more portable, and user-friendly devices that offer greater flexibility and cost-effectiveness without compromising on performance. The competitive landscape is characterized by intense innovation, strategic partnerships, and a focus on expanding geographical reach. Companies are continuously striving to develop analyzers with wider bandwidths, higher dynamic ranges, improved sensitivity, and advanced signal processing capabilities to meet the evolving demands of industries requiring precise signal characterization and verification. Market penetration is steadily increasing across all major end-user industries, reflecting the indispensable role of spectrum and signal analyzers in modern technological development and deployment. The market is anticipated to witness substantial growth, reaching valuations in the billions of USD, driven by these intertwined trends.
Dominant Markets & Segments in Spectrum and Signal Analyzers Industry
The Spectrum and Signal Analyzers Industry is segmented by Frequency Range and End-user Industry, with distinct segments exhibiting varying growth rates and market dominance.
Frequency Range Dominance:
- More than 18 GHz: This segment is experiencing robust growth and holds a significant market share, estimated to be in the billions of USD. The increasing demand for higher bandwidths in 5G and future 6G deployments, satellite communications, advanced radar systems in aerospace and defense, and high-frequency wireless backhaul solutions are key drivers. The complexity of signal analysis at these higher frequencies necessitates sophisticated and high-performance spectrum analyzers, driving innovation and investment in this category. Economic policies supporting technological advancement and infrastructure development in the telecommunications sector are crucial for this segment's expansion.
- 6-18 GHz: This segment remains a strong performer, particularly due to its extensive application in Wi-Fi standards, microwave backhaul, and various defense communication systems. The ongoing deployment of dense wireless networks and the need for interference analysis within this band ensure consistent demand.
- Less than 6 GHz: While mature, this segment continues to be vital for a wide array of applications, including cellular communication (4G and parts of 5G), industrial IoT, and general-purpose RF testing. Its broad applicability and the sheer volume of devices operating in this range ensure sustained market relevance, contributing billions to the overall market value.
End-user Industry Dominance:
- IT & Telecommunication: This is the largest and most dominant end-user industry segment, accounting for a substantial portion of the market value, projected to reach tens of billions of USD by 2033. The relentless expansion of wireless networks, the global rollout of 5G, and the ongoing research into 6G are the primary catalysts. Spectrum analyzers are indispensable for network design, deployment, optimization, interference monitoring, and compliance testing, ensuring the efficient and reliable operation of communication infrastructure. Government initiatives promoting digital transformation and broadband access further bolster this segment's growth.
- Aerospace & Defense: This segment represents another significant market, with demand driven by advanced radar systems, electronic warfare (EW) capabilities, satellite communications, and secure military communication networks. The increasing sophistication of defense technologies and the constant need for superior signal intelligence necessitate high-performance spectrum analyzers. Market size in this segment is estimated to be in the billions of USD.
- Automotive: The rapid integration of advanced connectivity features, including V2X communication, autonomous driving sensors (radar and LiDAR), and in-car infotainment systems, is driving substantial growth in this segment. Spectrum analyzers are crucial for validating the performance and safety of these wireless systems.
- Healthcare: While a smaller segment compared to others, the healthcare industry's increasing adoption of wireless medical devices, remote patient monitoring, and advanced diagnostic equipment is creating growing demand for reliable RF testing solutions.
Spectrum and Signal Analyzers Industry Product Developments
Recent product developments in the Spectrum and Signal Analyzers Industry showcase a strong emphasis on enhanced performance, broader frequency coverage, and increased usability. A notable example is Yokogawa's introduction of the AQ6375E and AQ6376E optical spectrum analyzers (OSAs) in August 2022. These grating-based OSAs offer exceptional optical performance, capable of measuring a wide array of wavelengths, spanning Short-Wave Infrared (SWIR) beyond 2 micrometers and Mid-Wave Infrared (MWIR) beyond 3 micrometers, catering to advanced optical device innovation and production needs. In June 2021, Signal Hound unveiled the SM435B, a 43.5 GHz RF spectrum analyzer and monitor receiver, expanding their offerings into higher frequency applications relevant to 5G cellular, aerospace, and military sectors. Concurrently, Signal Hound also released the BB60D, a 6 GHz real-time spectrum analyzer with significant performance improvements, including a 10dB higher dynamic range and enhanced phase distortion, making it a powerful tool for a variety of RF testing scenarios. These developments highlight the industry's commitment to pushing the boundaries of measurement technology, addressing the evolving demands of high-frequency applications and specialized testing requirements.
Report Scope & Segmentation Analysis
This report meticulously analyzes the Spectrum and Signal Analyzers Industry across key segmentation dimensions. The Frequency Range segmentation includes Less than 6 GHz, 6-18 GHz, and More than 18 GHz, with the latter two expected to experience the most dynamic growth due to 5G and emerging 6G technologies. The End-user Industry segmentation encompasses IT & Telecommunication, Automotive, Aerospace & Defense, Healthcare, and Other End-user Industries. The IT & Telecommunication segment is projected to dominate market share, followed closely by Aerospace & Defense, with Automotive exhibiting rapid expansion. Each segment's unique demand drivers, market sizes (in billions of USD), and competitive dynamics are explored, providing a comprehensive understanding of the market landscape and future growth projections.
Key Drivers of Spectrum and Signal Analyzers Industry Growth
The Spectrum and Signal Analyzers Industry is propelled by several critical growth drivers. The escalating demand for 5G and the development of 6G networks is a paramount factor, necessitating advanced equipment for spectrum analysis, interference detection, and signal integrity testing. The burgeoning Internet of Things (IoT) ecosystem, with its billions of interconnected devices, requires robust solutions for reliable wireless communication and troubleshooting. Technological advancements, such as the integration of Artificial Intelligence (AI) and Machine Learning (ML) into test and measurement equipment, are enhancing analytical capabilities and automation. Furthermore, the defense sector's continuous need for sophisticated electronic warfare, radar, and secure communication systems fuels the demand for high-performance analyzers. Government initiatives supporting digital infrastructure development and spectrum modernization also play a significant role in stimulating market growth, contributing to the industry's valuation in the billions of USD.
Challenges in the Spectrum and Signal Analyzers Industry Sector
Despite the robust growth, the Spectrum and Signal Analyzers Industry faces several challenges. Increasing complexity of wireless technologies demands more sophisticated and costly equipment, posing a barrier for smaller organizations. Stringent regulatory compliance for spectrum usage and electromagnetic compatibility can lead to extended product development cycles and increased testing costs. Supply chain disruptions, as witnessed in recent years, can impact component availability and production timelines, affecting market responsiveness. The rapid pace of technological evolution also presents a challenge, requiring continuous investment in R&D to stay competitive, with potential obsolescence of older models. Furthermore, competition from lower-cost alternatives and the need to balance performance with affordability create a dynamic competitive landscape, impacting profit margins for some products, though the overall market value continues to climb into the billions.
Emerging Opportunities in Spectrum and Signal Analyzers Industry
The Spectrum and Signal Analyzers Industry is ripe with emerging opportunities. The continuous expansion of 5G network infrastructure and the advent of 6G present significant opportunities for advanced spectrum analyzers capable of operating at higher frequencies and wider bandwidths. The growing adoption of connected vehicles and autonomous driving technologies is creating a substantial demand for specialized RF testing solutions for V2X communication and sensor validation, representing a market worth billions. The proliferation of satellite-based internet services and the increasing use of non-terrestrial networks (NTNs) will drive the need for sophisticated spectrum analysis in space and ground segments. Furthermore, the rise of software-defined testing platforms and cloud-based analysis solutions offers opportunities for new business models and service offerings, providing greater flexibility and accessibility to users. The demand for miniaturized and portable analyzers for field applications in sectors like IoT and remote sensing also presents a significant growth avenue.
Leading Players in the Spectrum and Signal Analyzers Industry Market
- Rohde & Schwarz GmbH & Co
- Advantest Corporation
- Avcom of Virginia Inc
- Anritsu Corporation
- B&K Precision Corporation
- National Instruments Corporation
- LP Technologies Inc
- Keysight Technologies Inc
- Yokogawa Electric Corporation
- Teledyne Lecroy Inc
- Stanford Research Systems Inc
Key Developments in Spectrum and Signal Analyzers Industry Industry
- August 2022: Yokogawa introduced two unique optical spectrum analyzers (OSAs), the AQ6375E and AQ6376E. These grating-based OSAs offer top-tier optical performance, spanning SWIR over 2 µm and MWIR beyond 3 µm, addressing industry demand for measuring a wide variety of wavelengths for optical device innovation and production.
- June 2021: Signal Hound unveiled the SM435B, a 43.5 GHz RF spectrum analyzer and monitor receiver. This product extends their penetration into new industry segments, finding applications in 5G cellular, aerospace, and military contexts.
- June 2021: Signal Hound announced the BB60D, a 6 GHz real-time spectrum analyzer. This model offers significant performance enhancements over its predecessor, including a 10dB higher dynamic range and 10dB improved phase distortion, along with an incorporated preselector covering 130 MHz to 6 GHz.
Strategic Outlook for Spectrum and Signal Analyzers Industry Market
The strategic outlook for the Spectrum and Signal Analyzers Industry is exceptionally positive, with continued expansion anticipated into the billions of USD by 2033. Growth catalysts include the ongoing global rollout of 5G and the relentless pursuit of 6G technologies, which will necessitate highly advanced spectrum analysis capabilities. The burgeoning IoT market and the increasing adoption of connected devices across all sectors will drive demand for versatile and cost-effective testing solutions. Strategic investments in research and development, focusing on AI-driven analytics, miniaturization, and enhanced frequency coverage, will be crucial for market leaders. Furthermore, the growing importance of reliable communication in critical sectors like automotive, aerospace, and defense will ensure a sustained and robust demand for sophisticated spectrum and signal analyzers, positioning the industry for significant future growth and innovation.
Spectrum and Signal Analyzers Industry Segmentation
-
1. Frequency Range
- 1.1. Less than 6 GHz
- 1.2. 6-18 GHz
- 1.3. More than 18 GHz
-
2. End-user Industry
- 2.1. IT & Telecommunication
- 2.2. Automotive
- 2.3. Aerospace & Defense
- 2.4. Healthcare
- 2.5. Other End-user Industries
Spectrum and Signal Analyzers Industry Segmentation By Geography
- 1. North America
- 2. Europe
- 3. Asia Pacific
- 4. Latin America
- 5. Middle East
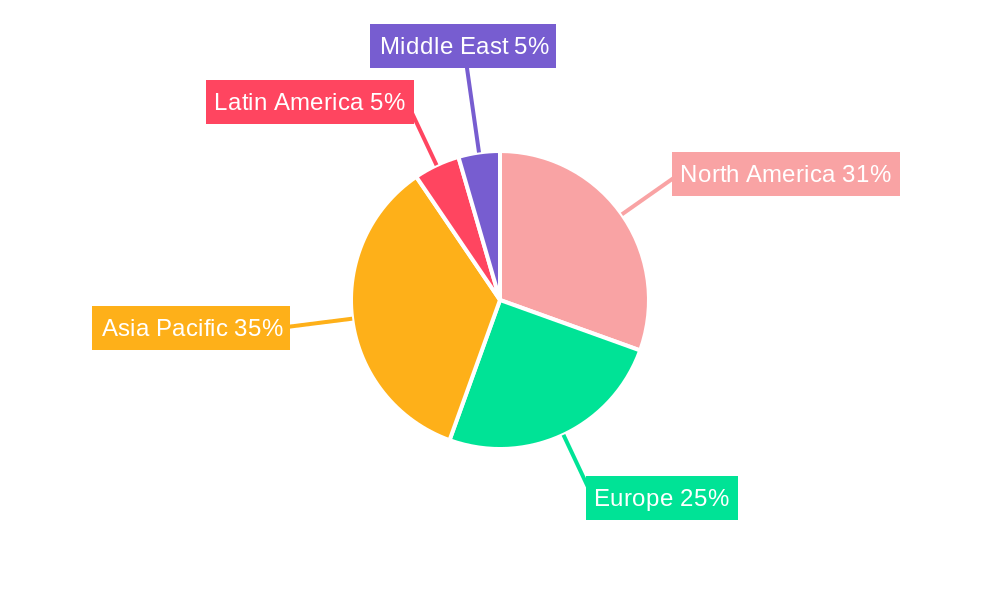
Spectrum and Signal Analyzers Industry Regional Market Share
Geographic Coverage of Spectrum and Signal Analyzers Industry
Spectrum and Signal Analyzers Industry REPORT HIGHLIGHTS
| Aspects | Details |
|---|---|
| Study Period | 2020-2034 |
| Base Year | 2025 |
| Estimated Year | 2026 |
| Forecast Period | 2026-2034 |
| Historical Period | 2020-2025 |
| Growth Rate | CAGR of 5.98% from 2020-2034 |
| Segmentation |
|
Table of Contents
- 1. Introduction
- 1.1. Research Scope
- 1.2. Market Segmentation
- 1.3. Research Objective
- 1.4. Definitions and Assumptions
- 2. Executive Summary
- 2.1. Market Snapshot
- 3. Market Dynamics
- 3.1. Market Drivers
- 3.2. Market Restrains
- 3.3. Market Trends
- 3.4. Market Opportunities
- 4. Market Factor Analysis
- 4.1. Porters Five Forces
- 4.1.1. Bargaining Power of Suppliers
- 4.1.2. Bargaining Power of Buyers
- 4.1.3. Threat of New Entrants
- 4.1.4. Threat of Substitutes
- 4.1.5. Competitive Rivalry
- 4.2. PESTEL analysis
- 4.3. BCG Analysis
- 4.3.1. Stars (High Growth, High Market Share)
- 4.3.2. Cash Cows (Low Growth, High Market Share)
- 4.3.3. Question Mark (High Growth, Low Market Share)
- 4.3.4. Dogs (Low Growth, Low Market Share)
- 4.4. Ansoff Matrix Analysis
- 4.5. Supply Chain Analysis
- 4.6. Regulatory Landscape
- 4.7. Current Market Potential and Opportunity Assessment (TAM–SAM–SOM Framework)
- 4.8. RAX Analyst Note
- 4.1. Porters Five Forces
- 5. Market Analysis, Insights and Forecast 2021-2033
- 5.1. Market Analysis, Insights and Forecast - by Frequency Range
- 5.1.1. Less than 6 GHz
- 5.1.2. 6-18 GHz
- 5.1.3. More than 18 GHz
- 5.2. Market Analysis, Insights and Forecast - by End-user Industry
- 5.2.1. IT & Telecommunication
- 5.2.2. Automotive
- 5.2.3. Aerospace & Defense
- 5.2.4. Healthcare
- 5.2.5. Other End-user Industries
- 5.3. Market Analysis, Insights and Forecast - by Region
- 5.3.1. North America
- 5.3.2. Europe
- 5.3.3. Asia Pacific
- 5.3.4. Latin America
- 5.3.5. Middle East
- 5.1. Market Analysis, Insights and Forecast - by Frequency Range
- 6. Global Spectrum and Signal Analyzers Industry Analysis, Insights and Forecast, 2021-2033
- 6.1. Market Analysis, Insights and Forecast - by Frequency Range
- 6.1.1. Less than 6 GHz
- 6.1.2. 6-18 GHz
- 6.1.3. More than 18 GHz
- 6.2. Market Analysis, Insights and Forecast - by End-user Industry
- 6.2.1. IT & Telecommunication
- 6.2.2. Automotive
- 6.2.3. Aerospace & Defense
- 6.2.4. Healthcare
- 6.2.5. Other End-user Industries
- 6.1. Market Analysis, Insights and Forecast - by Frequency Range
- 7. North America Spectrum and Signal Analyzers Industry Analysis, Insights and Forecast, 2020-2032
- 7.1. Market Analysis, Insights and Forecast - by Frequency Range
- 7.1.1. Less than 6 GHz
- 7.1.2. 6-18 GHz
- 7.1.3. More than 18 GHz
- 7.2. Market Analysis, Insights and Forecast - by End-user Industry
- 7.2.1. IT & Telecommunication
- 7.2.2. Automotive
- 7.2.3. Aerospace & Defense
- 7.2.4. Healthcare
- 7.2.5. Other End-user Industries
- 7.1. Market Analysis, Insights and Forecast - by Frequency Range
- 8. Europe Spectrum and Signal Analyzers Industry Analysis, Insights and Forecast, 2020-2032
- 8.1. Market Analysis, Insights and Forecast - by Frequency Range
- 8.1.1. Less than 6 GHz
- 8.1.2. 6-18 GHz
- 8.1.3. More than 18 GHz
- 8.2. Market Analysis, Insights and Forecast - by End-user Industry
- 8.2.1. IT & Telecommunication
- 8.2.2. Automotive
- 8.2.3. Aerospace & Defense
- 8.2.4. Healthcare
- 8.2.5. Other End-user Industries
- 8.1. Market Analysis, Insights and Forecast - by Frequency Range
- 9. Asia Pacific Spectrum and Signal Analyzers Industry Analysis, Insights and Forecast, 2020-2032
- 9.1. Market Analysis, Insights and Forecast - by Frequency Range
- 9.1.1. Less than 6 GHz
- 9.1.2. 6-18 GHz
- 9.1.3. More than 18 GHz
- 9.2. Market Analysis, Insights and Forecast - by End-user Industry
- 9.2.1. IT & Telecommunication
- 9.2.2. Automotive
- 9.2.3. Aerospace & Defense
- 9.2.4. Healthcare
- 9.2.5. Other End-user Industries
- 9.1. Market Analysis, Insights and Forecast - by Frequency Range
- 10. Latin America Spectrum and Signal Analyzers Industry Analysis, Insights and Forecast, 2020-2032
- 10.1. Market Analysis, Insights and Forecast - by Frequency Range
- 10.1.1. Less than 6 GHz
- 10.1.2. 6-18 GHz
- 10.1.3. More than 18 GHz
- 10.2. Market Analysis, Insights and Forecast - by End-user Industry
- 10.2.1. IT & Telecommunication
- 10.2.2. Automotive
- 10.2.3. Aerospace & Defense
- 10.2.4. Healthcare
- 10.2.5. Other End-user Industries
- 10.1. Market Analysis, Insights and Forecast - by Frequency Range
- 11. Middle East Spectrum and Signal Analyzers Industry Analysis, Insights and Forecast, 2020-2032
- 11.1. Market Analysis, Insights and Forecast - by Frequency Range
- 11.1.1. Less than 6 GHz
- 11.1.2. 6-18 GHz
- 11.1.3. More than 18 GHz
- 11.2. Market Analysis, Insights and Forecast - by End-user Industry
- 11.2.1. IT & Telecommunication
- 11.2.2. Automotive
- 11.2.3. Aerospace & Defense
- 11.2.4. Healthcare
- 11.2.5. Other End-user Industries
- 11.1. Market Analysis, Insights and Forecast - by Frequency Range
- 12. Competitive Analysis
- 12.1. Company Profiles
- 12.1.1 Rohde & Schwarz GmbH & Co
- 12.1.1.1. Company Overview
- 12.1.1.2. Products
- 12.1.1.3. Company Financials
- 12.1.1.4. SWOT Analysis
- 12.1.2 Advantest Corporation
- 12.1.2.1. Company Overview
- 12.1.2.2. Products
- 12.1.2.3. Company Financials
- 12.1.2.4. SWOT Analysis
- 12.1.3 Avcom of Virginia Inc *List Not Exhaustive
- 12.1.3.1. Company Overview
- 12.1.3.2. Products
- 12.1.3.3. Company Financials
- 12.1.3.4. SWOT Analysis
- 12.1.4 Anritsu Corporation
- 12.1.4.1. Company Overview
- 12.1.4.2. Products
- 12.1.4.3. Company Financials
- 12.1.4.4. SWOT Analysis
- 12.1.5 B&K Precision Corporation
- 12.1.5.1. Company Overview
- 12.1.5.2. Products
- 12.1.5.3. Company Financials
- 12.1.5.4. SWOT Analysis
- 12.1.6 National Instruments Corporation
- 12.1.6.1. Company Overview
- 12.1.6.2. Products
- 12.1.6.3. Company Financials
- 12.1.6.4. SWOT Analysis
- 12.1.7 LP Technologies Inc
- 12.1.7.1. Company Overview
- 12.1.7.2. Products
- 12.1.7.3. Company Financials
- 12.1.7.4. SWOT Analysis
- 12.1.8 Keysight Technologies Inc
- 12.1.8.1. Company Overview
- 12.1.8.2. Products
- 12.1.8.3. Company Financials
- 12.1.8.4. SWOT Analysis
- 12.1.9 Yokogawa Electric Corporation
- 12.1.9.1. Company Overview
- 12.1.9.2. Products
- 12.1.9.3. Company Financials
- 12.1.9.4. SWOT Analysis
- 12.1.10 Teledyne Lecroy Inc
- 12.1.10.1. Company Overview
- 12.1.10.2. Products
- 12.1.10.3. Company Financials
- 12.1.10.4. SWOT Analysis
- 12.1.11 Stanford Research Systems Inc
- 12.1.11.1. Company Overview
- 12.1.11.2. Products
- 12.1.11.3. Company Financials
- 12.1.11.4. SWOT Analysis
- 12.1.1 Rohde & Schwarz GmbH & Co
- 12.2. Market Entropy
- 12.2.1 Company's Key Areas Served
- 12.2.2 Recent Developments
- 12.3. Company Market Share Analysis 2025
- 12.3.1 Top 5 Companies Market Share Analysis
- 12.3.2 Top 3 Companies Market Share Analysis
- 12.4. List of Potential Customers
- 13. Research Methodology
List of Figures
- Figure 1: Global Spectrum and Signal Analyzers Industry Revenue Breakdown (undefined, %) by Region 2025 & 2033
- Figure 2: North America Spectrum and Signal Analyzers Industry Revenue (undefined), by Frequency Range 2025 & 2033
- Figure 3: North America Spectrum and Signal Analyzers Industry Revenue Share (%), by Frequency Range 2025 & 2033
- Figure 4: North America Spectrum and Signal Analyzers Industry Revenue (undefined), by End-user Industry 2025 & 2033
- Figure 5: North America Spectrum and Signal Analyzers Industry Revenue Share (%), by End-user Industry 2025 & 2033
- Figure 6: North America Spectrum and Signal Analyzers Industry Revenue (undefined), by Country 2025 & 2033
- Figure 7: North America Spectrum and Signal Analyzers Industry Revenue Share (%), by Country 2025 & 2033
- Figure 8: Europe Spectrum and Signal Analyzers Industry Revenue (undefined), by Frequency Range 2025 & 2033
- Figure 9: Europe Spectrum and Signal Analyzers Industry Revenue Share (%), by Frequency Range 2025 & 2033
- Figure 10: Europe Spectrum and Signal Analyzers Industry Revenue (undefined), by End-user Industry 2025 & 2033
- Figure 11: Europe Spectrum and Signal Analyzers Industry Revenue Share (%), by End-user Industry 2025 & 2033
- Figure 12: Europe Spectrum and Signal Analyzers Industry Revenue (undefined), by Country 2025 & 2033
- Figure 13: Europe Spectrum and Signal Analyzers Industry Revenue Share (%), by Country 2025 & 2033
- Figure 14: Asia Pacific Spectrum and Signal Analyzers Industry Revenue (undefined), by Frequency Range 2025 & 2033
- Figure 15: Asia Pacific Spectrum and Signal Analyzers Industry Revenue Share (%), by Frequency Range 2025 & 2033
- Figure 16: Asia Pacific Spectrum and Signal Analyzers Industry Revenue (undefined), by End-user Industry 2025 & 2033
- Figure 17: Asia Pacific Spectrum and Signal Analyzers Industry Revenue Share (%), by End-user Industry 2025 & 2033
- Figure 18: Asia Pacific Spectrum and Signal Analyzers Industry Revenue (undefined), by Country 2025 & 2033
- Figure 19: Asia Pacific Spectrum and Signal Analyzers Industry Revenue Share (%), by Country 2025 & 2033
- Figure 20: Latin America Spectrum and Signal Analyzers Industry Revenue (undefined), by Frequency Range 2025 & 2033
- Figure 21: Latin America Spectrum and Signal Analyzers Industry Revenue Share (%), by Frequency Range 2025 & 2033
- Figure 22: Latin America Spectrum and Signal Analyzers Industry Revenue (undefined), by End-user Industry 2025 & 2033
- Figure 23: Latin America Spectrum and Signal Analyzers Industry Revenue Share (%), by End-user Industry 2025 & 2033
- Figure 24: Latin America Spectrum and Signal Analyzers Industry Revenue (undefined), by Country 2025 & 2033
- Figure 25: Latin America Spectrum and Signal Analyzers Industry Revenue Share (%), by Country 2025 & 2033
- Figure 26: Middle East Spectrum and Signal Analyzers Industry Revenue (undefined), by Frequency Range 2025 & 2033
- Figure 27: Middle East Spectrum and Signal Analyzers Industry Revenue Share (%), by Frequency Range 2025 & 2033
- Figure 28: Middle East Spectrum and Signal Analyzers Industry Revenue (undefined), by End-user Industry 2025 & 2033
- Figure 29: Middle East Spectrum and Signal Analyzers Industry Revenue Share (%), by End-user Industry 2025 & 2033
- Figure 30: Middle East Spectrum and Signal Analyzers Industry Revenue (undefined), by Country 2025 & 2033
- Figure 31: Middle East Spectrum and Signal Analyzers Industry Revenue Share (%), by Country 2025 & 2033
List of Tables
- Table 1: Global Spectrum and Signal Analyzers Industry Revenue undefined Forecast, by Frequency Range 2020 & 2033
- Table 2: Global Spectrum and Signal Analyzers Industry Revenue undefined Forecast, by End-user Industry 2020 & 2033
- Table 3: Global Spectrum and Signal Analyzers Industry Revenue undefined Forecast, by Region 2020 & 2033
- Table 4: Global Spectrum and Signal Analyzers Industry Revenue undefined Forecast, by Frequency Range 2020 & 2033
- Table 5: Global Spectrum and Signal Analyzers Industry Revenue undefined Forecast, by End-user Industry 2020 & 2033
- Table 6: Global Spectrum and Signal Analyzers Industry Revenue undefined Forecast, by Country 2020 & 2033
- Table 7: Global Spectrum and Signal Analyzers Industry Revenue undefined Forecast, by Frequency Range 2020 & 2033
- Table 8: Global Spectrum and Signal Analyzers Industry Revenue undefined Forecast, by End-user Industry 2020 & 2033
- Table 9: Global Spectrum and Signal Analyzers Industry Revenue undefined Forecast, by Country 2020 & 2033
- Table 10: Global Spectrum and Signal Analyzers Industry Revenue undefined Forecast, by Frequency Range 2020 & 2033
- Table 11: Global Spectrum and Signal Analyzers Industry Revenue undefined Forecast, by End-user Industry 2020 & 2033
- Table 12: Global Spectrum and Signal Analyzers Industry Revenue undefined Forecast, by Country 2020 & 2033
- Table 13: Global Spectrum and Signal Analyzers Industry Revenue undefined Forecast, by Frequency Range 2020 & 2033
- Table 14: Global Spectrum and Signal Analyzers Industry Revenue undefined Forecast, by End-user Industry 2020 & 2033
- Table 15: Global Spectrum and Signal Analyzers Industry Revenue undefined Forecast, by Country 2020 & 2033
- Table 16: Global Spectrum and Signal Analyzers Industry Revenue undefined Forecast, by Frequency Range 2020 & 2033
- Table 17: Global Spectrum and Signal Analyzers Industry Revenue undefined Forecast, by End-user Industry 2020 & 2033
- Table 18: Global Spectrum and Signal Analyzers Industry Revenue undefined Forecast, by Country 2020 & 2033
Frequently Asked Questions
1. What is the projected Compound Annual Growth Rate (CAGR) of the Spectrum and Signal Analyzers Industry?
The projected CAGR is approximately 5.98%.
2. Which companies are prominent players in the Spectrum and Signal Analyzers Industry?
Key companies in the market include Rohde & Schwarz GmbH & Co, Advantest Corporation, Avcom of Virginia Inc *List Not Exhaustive, Anritsu Corporation, B&K Precision Corporation, National Instruments Corporation, LP Technologies Inc, Keysight Technologies Inc, Yokogawa Electric Corporation, Teledyne Lecroy Inc, Stanford Research Systems Inc.
3. What are the main segments of the Spectrum and Signal Analyzers Industry?
The market segments include Frequency Range, End-user Industry.
4. Can you provide details about the market size?
The market size is estimated to be USD XXX N/A as of 2022.
5. What are some drivers contributing to market growth?
Growing Demand for Spectrum Analyzers With Multi-Tasking Capabilities; Technological Advancement Leading to Innovation in Spectrum Analyzer Offering.
6. What are the notable trends driving market growth?
Automotive Segment is Expected to Witness Significant Growth.
7. Are there any restraints impacting market growth?
Requirement of Cost-Effective Spectrum Analyzers With Maximum Features.
8. Can you provide examples of recent developments in the market?
August 2022 - Yokogawa introduced two unique optical spectrum analyzers (OSAs) to address industry demand for a device that can measure a wide variety of wavelengths in order to satisfy new requirements in optical device innovation and production. The Yokogawa AQ6375E and AQ6376E were the unique grating-based OSAs with top-tier optical performance that span SWIR over 2 m & MWIR beyond 3 m.
9. What pricing options are available for accessing the report?
Pricing options include single-user, multi-user, and enterprise licenses priced at USD 4750, USD 5250, and USD 8750 respectively.
10. Is the market size provided in terms of value or volume?
The market size is provided in terms of value, measured in N/A.
11. Are there any specific market keywords associated with the report?
Yes, the market keyword associated with the report is "Spectrum and Signal Analyzers Industry," which aids in identifying and referencing the specific market segment covered.
12. How do I determine which pricing option suits my needs best?
The pricing options vary based on user requirements and access needs. Individual users may opt for single-user licenses, while businesses requiring broader access may choose multi-user or enterprise licenses for cost-effective access to the report.
13. Are there any additional resources or data provided in the Spectrum and Signal Analyzers Industry report?
While the report offers comprehensive insights, it's advisable to review the specific contents or supplementary materials provided to ascertain if additional resources or data are available.
14. How can I stay updated on further developments or reports in the Spectrum and Signal Analyzers Industry?
To stay informed about further developments, trends, and reports in the Spectrum and Signal Analyzers Industry, consider subscribing to industry newsletters, following relevant companies and organizations, or regularly checking reputable industry news sources and publications.
Methodology
Step 1 - Identification of Relevant Samples Size from Population Database


Step 2 - Approaches for Defining Global Market Size (Value, Volume* & Price*)

Note*: In applicable scenarios
Step 3 - Data Sources
Primary Research
- Web Analytics
- Survey Reports
- Research Institute
- Latest Research Reports
- Opinion Leaders
Secondary Research
- Annual Reports
- White Paper
- Latest Press Release
- Industry Association
- Paid Database
- Investor Presentations

Step 4 - Data Triangulation
Involves using different sources of information in order to increase the validity of a study
These sources are likely to be stakeholders in a program - participants, other researchers, program staff, other community members, and so on.
Then we put all data in single framework & apply various statistical tools to find out the dynamic on the market.
During the analysis stage, feedback from the stakeholder groups would be compared to determine areas of agreement as well as areas of divergence