

Key Insights
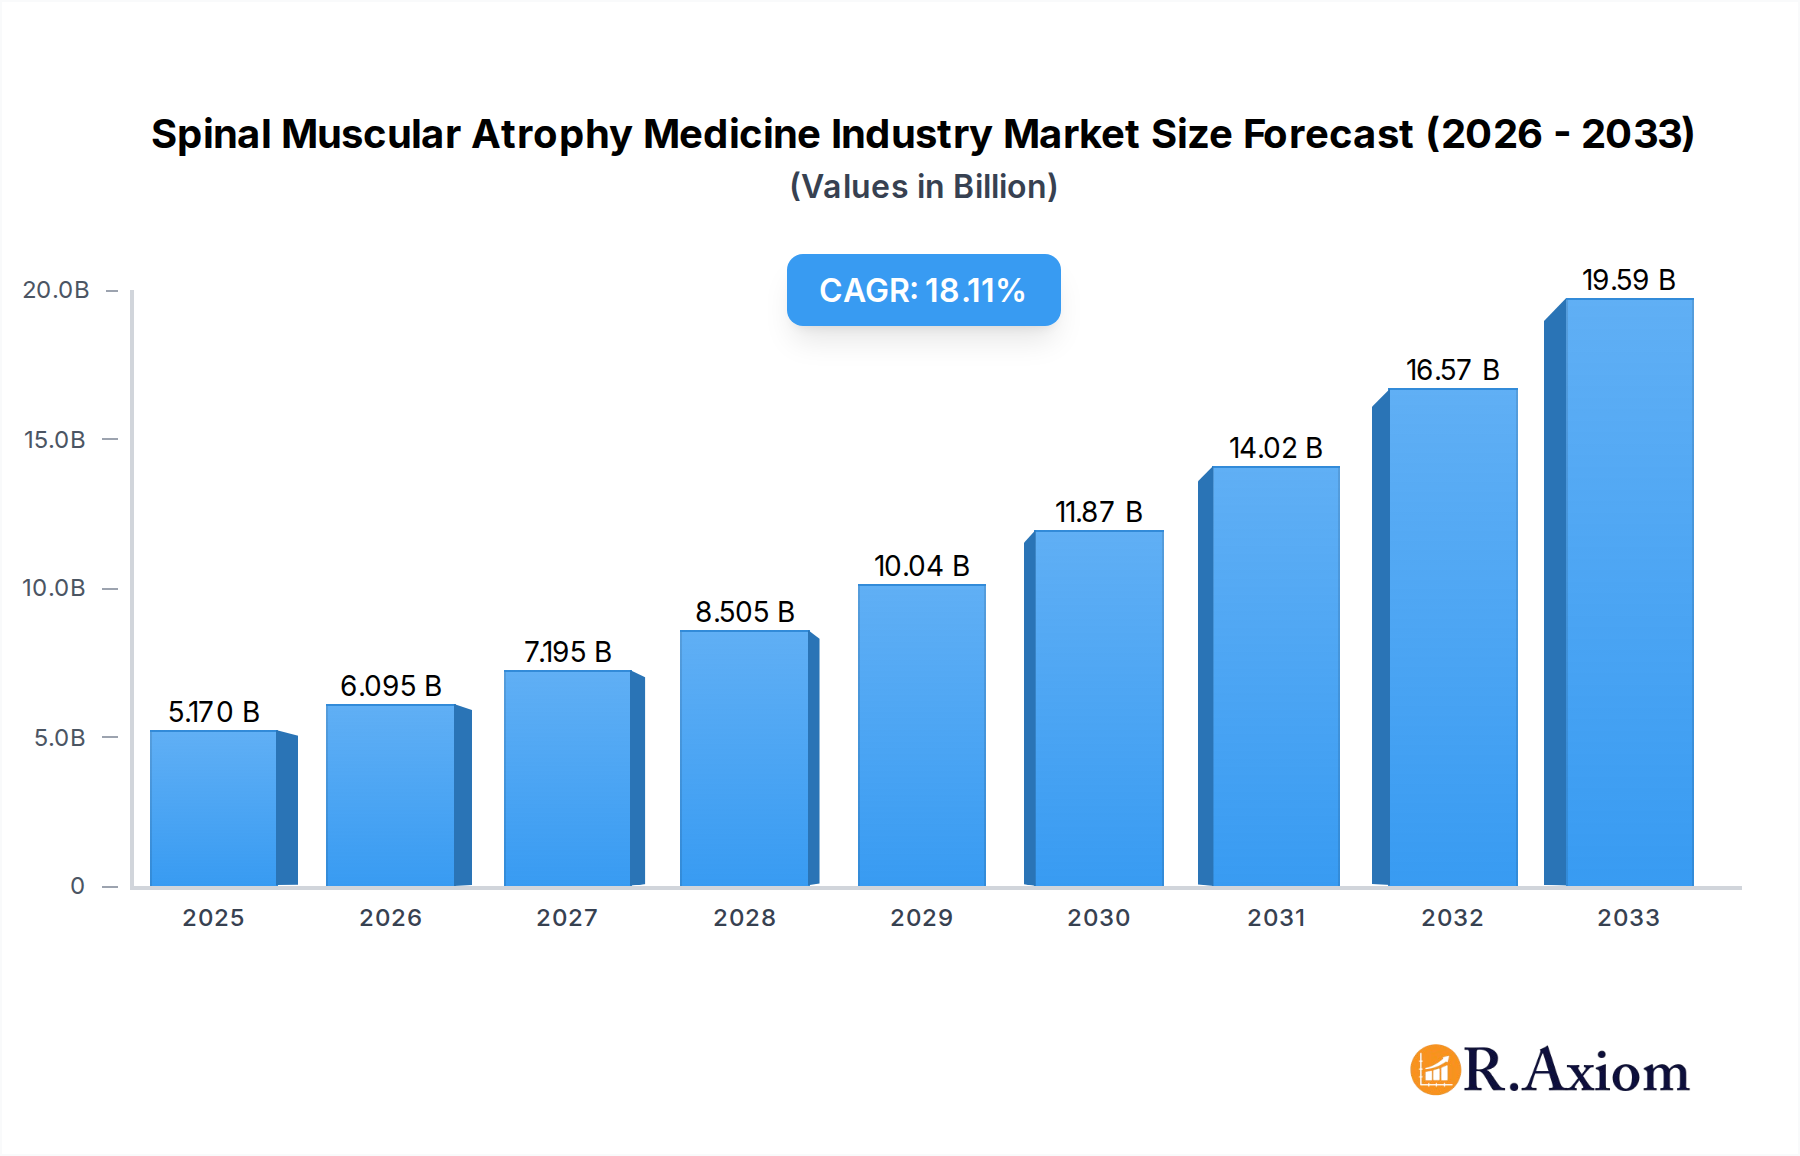
The global Spinal Muscular Atrophy (SMA) medicine market is poised for significant expansion, projected to reach an estimated $5.17 billion in 2025, driven by advancements in gene therapy and a robust compound annual growth rate (CAGR) of 17.68% through 2033. This rapid growth underscores the increasing effectiveness and accessibility of novel treatments for SMA, a rare genetic neuromuscular disorder. Key market drivers include the development of groundbreaking gene replacement therapies and innovative drug formulations, which are transforming patient outcomes and expanding treatment options. The rising prevalence of SMA diagnoses, coupled with enhanced diagnostic capabilities and increasing awareness among healthcare professionals and patients, further fuels market expansion. Moreover, favorable regulatory pathways and growing investment in research and development are accelerating the approval and commercialization of life-changing SMA therapies.

Spinal Muscular Atrophy Medicine Industry Market Size (In Billion)
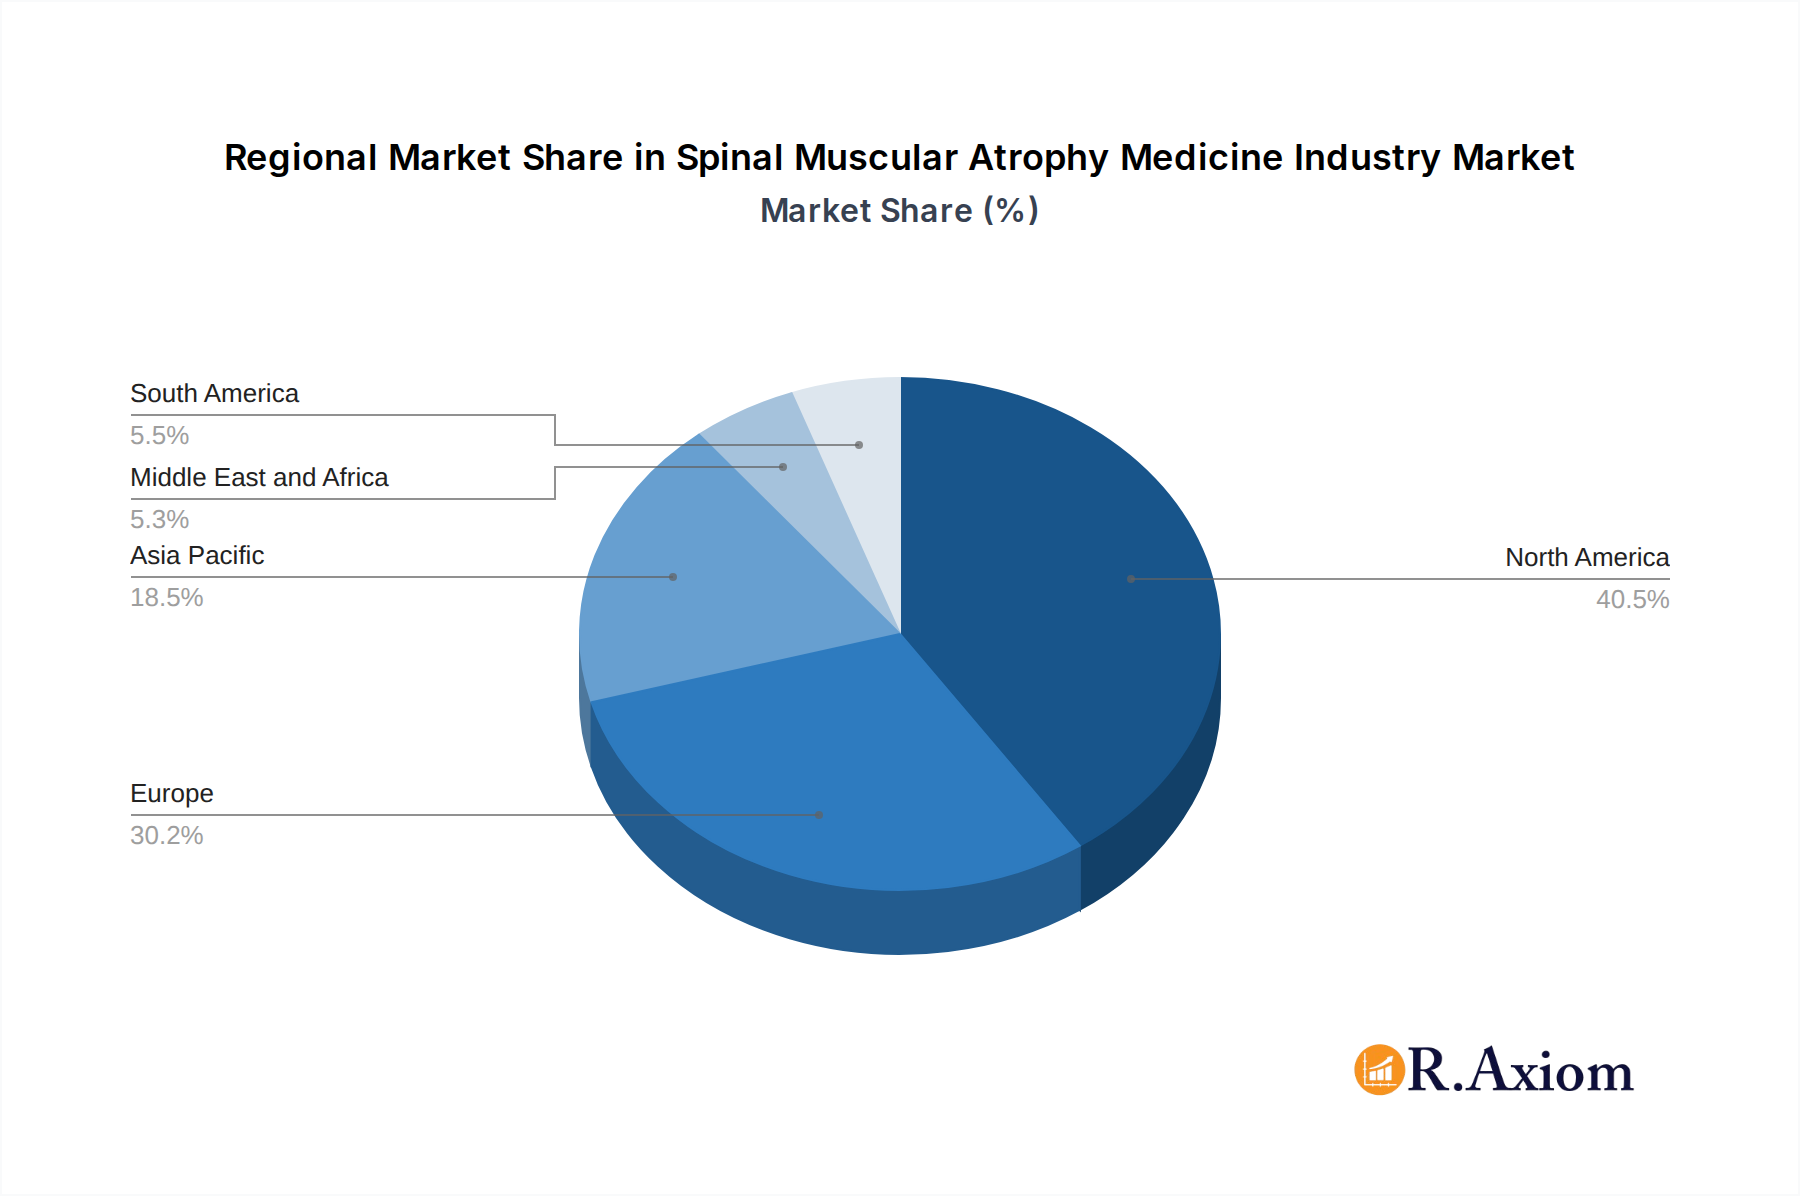
The SMA medicine market is characterized by a dynamic landscape with key players like Novartis International AG, Sanofi Aventis Inc. (Genzyme Corporation), and Avexis Inc. leading the charge with their innovative therapeutic solutions. The market segmentation reveals a strong emphasis on advanced treatment modalities such as gene replacement therapy, indicating a shift towards curative or disease-modifying approaches. While oral administration is gaining traction for convenience, intrathecal delivery remains critical for targeted treatment. Geographically, North America and Europe are expected to dominate the market due to strong healthcare infrastructures, high adoption rates for advanced therapies, and significant patient populations. However, the Asia Pacific region is anticipated to witness substantial growth, driven by increasing healthcare expenditure, expanding access to treatments, and growing awareness of rare diseases. Emerging trends also point towards the development of personalized medicine approaches and combination therapies to address the complex nature of SMA.
Spinal Muscular Atrophy Medicine Industry Company Market Share
This comprehensive report offers an in-depth analysis of the Spinal Muscular Atrophy (SMA) Medicine Industry, a critical and rapidly evolving sector within the global pharmaceuticals market. Spanning from 2019 to 2033, with a base year of 2025 and a forecast period extending to 2033, this study provides unparalleled insights into market dynamics, innovation, and future potential. The global SMA medicine market is projected to reach XXX billion by 2033, demonstrating a robust Compound Annual Growth Rate (CAGR) of XX% during the forecast period. This report is meticulously segmented by SMA Type (Type 1, Type 2, Type 3, Type 4), Procedure (Gene Replacement Therapy, Drug Therapy, Other Procedures), and Route of Administration (Oral, Intrathecal), offering a granular view of market penetration and growth trajectories. Delve into the strategic landscapes, competitive forces, and breakthrough advancements shaping this vital industry, crucial for pharmaceutical manufacturers, biotech innovators, investors, and regulatory bodies seeking to understand and capitalize on the SMA medicine market.
Spinal Muscular Atrophy Medicine Industry Market Concentration & Innovation
The Spinal Muscular Atrophy (SMA) Medicine Industry is characterized by a dynamic interplay of market concentration and relentless innovation. Key players such as Novartis International AG, Isis Pharmaceuticals Inc, Sanofi Aventis Inc (GenZyme Corporation), Cytokinetics Inc, Avexis Inc, Biogen Inc, Catalyst Pharmaceutical, F Hoffmann - La Roche Ltd, Chugai Pharmaceutical, and Pfizer Inc are actively shaping the competitive landscape. Market concentration is influenced by the significant R&D investments required for developing novel SMA therapies and the stringent regulatory pathways. Innovation is primarily driven by advancements in genetic therapies, gene replacement strategies, and small molecule drug development aimed at addressing the underlying genetic defects of SMA. The regulatory framework, while rigorous, is also a facilitator of innovation, encouraging the development of life-changing treatments. Product substitutes are currently limited due to the genetic nature of SMA, but the development of more targeted and effective therapies is a continuous pursuit. End-user trends are increasingly focused on early diagnosis, improved quality of life, and long-term disease management, pushing for therapies that can be administered with minimal invasiveness and offer sustained efficacy. Mergers and acquisitions (M&A) activities are strategic moves by larger pharmaceutical companies to acquire promising early-stage technologies and pipeline assets. Recent M&A deal values are estimated to be in the range of hundreds of millions to billions of dollars, reflecting the high stakes and potential returns in this niche but critical market. For instance, the acquisition of Avexis by Novartis for over $8.7 billion underscores the significant value placed on gene therapy for SMA.
Spinal Muscular Atrophy Medicine Industry Industry Trends & Insights
The Spinal Muscular Atrophy (SMA) Medicine Industry is witnessing transformative trends driven by groundbreaking scientific discoveries, evolving healthcare policies, and a growing unmet medical need. The market growth drivers are predominantly fueled by the increasing prevalence of SMA diagnoses, a growing awareness among patient communities and healthcare professionals, and substantial investment in research and development for novel therapeutics. Technological disruptions, particularly in the fields of gene therapy and precision medicine, are revolutionizing treatment paradigms. Gene replacement therapies, such as Zolgensma (onasemnogene abeparvovec), have set new benchmarks in treating the underlying genetic cause of SMA, offering hope for previously untreatable conditions. Similarly, novel drug therapies, including Evrysdi (risdiplam), provide oral administration options that improve patient compliance and quality of life. The market penetration of these advanced therapies is steadily increasing, albeit at a premium price point, reflecting their profound impact on patient outcomes. Consumer preferences are shifting towards therapies that offer the potential for significant motor function improvement, increased survival rates, and reduced burden of care. This includes a demand for less invasive administration routes and treatments that can be initiated earlier in the disease progression. Competitive dynamics are intense, with a handful of major pharmaceutical players dominating the market, alongside emerging biotech firms vying for market share through innovative pipeline candidates. The competitive landscape is shaped by patent exclusivity, regulatory approvals, and the ongoing clinical evaluation of new treatment modalities. The estimated market size for SMA therapeutics has seen exponential growth, projected to surpass hundreds of billions of dollars by the end of the forecast period. The CAGR for the SMA medicine market is estimated at a substantial XX%, reflecting its rapid expansion driven by scientific advancements and increasing patient access to effective treatments. Emerging markets and expanded indications for existing therapies are also contributing to this robust growth trajectory. The focus on personalized medicine and the development of companion diagnostics are further refining treatment strategies, leading to improved efficacy and better patient stratification.
Dominant Markets & Segments in Spinal Muscular Atrophy Medicine Industry
The Spinal Muscular Atrophy (SMA) Medicine Industry exhibits distinct dominance across various geographical regions and therapeutic segments, driven by a confluence of economic, regulatory, and healthcare infrastructure factors. In terms of geographical dominance, North America, particularly the United States, currently leads the market due to its advanced healthcare system, high healthcare expenditure, robust research and development ecosystem, and early adoption of innovative therapies. The presence of major pharmaceutical companies and well-established patient advocacy groups further solidifies its position. Europe follows closely, with key markets like Germany, the UK, and France demonstrating strong growth driven by supportive reimbursement policies and increasing awareness. Asia-Pacific is emerging as a significant growth region, propelled by increasing healthcare investments, a growing population, and the expanding access to treatments in countries like India and China.
Within the segmentation analysis:
Type: Type 1 SMA, characterized by the most severe symptoms and early onset, currently represents the largest segment by value due to the critical need for early intervention and the significant impact of available therapies on survival and development. However, Type 2 and Type 3 segments are expected to experience substantial growth as diagnostic capabilities improve and longer-term treatment options become more prevalent. Type 4, while less common, also presents opportunities for targeted therapeutic development.
- Key Drivers for Type 1 Dominance: Early diagnosis rates, availability of gene replacement therapies, and high unmet need for life-saving interventions.
- Growth Drivers for Type 2 & 3: Increased awareness, improved diagnostic tools, and the availability of oral therapies for chronic management.
Procedure: Gene Replacement Therapy currently holds a significant market share, offering a potentially curative approach for certain SMA types. This segment is characterized by high upfront costs but offers long-term benefits. Drug Therapy, encompassing small molecule therapeutics and other pharmacological interventions, is also a substantial segment and is expected to grow considerably due to its broader applicability, accessibility, and various administration routes. "Other Procedures" may include supportive care and emerging experimental approaches.
- Key Drivers for Gene Replacement Therapy: Potential for one-time curative treatment, significant clinical efficacy.
- Growth Drivers for Drug Therapy: Oral administration convenience, wider patient eligibility, and ongoing development of novel drug targets.
Route of Administration: Intrathecal administration, crucial for delivering gene therapies and certain other treatments directly to the central nervous system, is a dominant route, particularly for severe SMA types. However, the Oral route is rapidly gaining prominence due to its convenience, improved patient compliance, and accessibility, especially for chronic management and broader patient populations.
- Key Drivers for Intrathecal Dominance: Direct delivery to the spinal cord, essential for certain gene therapies.
- Growth Drivers for Oral Administration: Patient convenience, improved adherence, and wider applicability for chronic management.
The market dominance is a result of sustained research, strategic regulatory approvals, and increasing patient access to innovative treatments, positioning the SMA Medicine Industry for continued expansion across all its key segments.
Spinal Muscular Atrophy Medicine Industry Product Developments
The Spinal Muscular Atrophy (SMA) Medicine Industry is abuzz with transformative product developments, primarily centered around gene therapy and novel small molecule drugs. Avexis Inc.'s Zolgensma, a gene replacement therapy, represents a paradigm shift, offering a one-time treatment to address the genetic root of SMA by replacing the mutated SMN1 gene. This has set a high standard for efficacy and market potential. Simultaneously, Biogen Inc.'s Spinraza (nusinersen) continues to be a cornerstone therapy, administered intrathecally to increase SMN protein levels, demonstrating significant improvements in motor function and survival. Roche launched Evrysdi (risdiplam), an oral medication that also increases SMN protein production, providing a crucial alternative for patients who cannot receive intrathecal injections or gene therapy. These advancements are characterized by sophisticated delivery mechanisms, targeted molecular action, and improved safety profiles, offering distinct competitive advantages in addressing the diverse needs of SMA patients across different severities and age groups. The ongoing research into next-generation gene therapies and combination treatments promises further therapeutic breakthroughs, solidifying the market's commitment to innovative patient care.
Report Scope & Segmentation Analysis
This report meticulously analyzes the Spinal Muscular Atrophy (SMA) Medicine Industry across its crucial segments, providing granular insights into market dynamics and growth projections from 2019 to 2033.
Type: The market is segmented into Type 1, Type 2, Type 3, and Type 4 SMA. Type 1, the most severe form, currently represents a significant market share due to the urgent need for life-saving interventions. However, Type 2 and Type 3 segments are projected for robust growth as diagnostic capabilities improve and long-term management strategies are implemented. Market sizes and growth projections are carefully detailed for each type, reflecting disease prevalence and treatment accessibility.
Procedure: The analysis covers Gene Replacement Therapy, Drug Therapy, and Other Procedures. Gene Replacement Therapy, while innovative and impactful, often carries a higher price point and specific eligibility criteria. Drug Therapy, encompassing a range of pharmaceuticals, is a broader and growing segment, offering diverse treatment options. Projections for each procedure type consider technological advancements, regulatory approvals, and market penetration rates.
Route of Administration: Key routes examined include Oral and Intrathecal. Intrathecal administration is critical for certain gene therapies and neurological treatments. The Oral route is experiencing rapid expansion due to its convenience and improved patient compliance, especially for chronic management. Growth projections for each route are informed by patient preference trends and the development of new formulations.
Each segment is analyzed with its projected market size, growth rate, and key competitive dynamics, offering a comprehensive understanding of the SMA medicine market landscape.
Key Drivers of Spinal Muscular Atrophy Medicine Industry Growth
The growth of the Spinal Muscular Atrophy (SMA) Medicine Industry is propelled by several interconnected drivers. Firstly, significant advancements in genetic sequencing and diagnostic technologies have led to earlier and more accurate identification of SMA cases, increasing the patient pool eligible for treatment. Secondly, groundbreaking innovations in gene therapy and drug development have introduced highly effective treatments that can significantly alter the disease's natural progression and improve patient outcomes. The development of therapies like Zolgensma and Evrysdi has been a major catalyst. Thirdly, growing global awareness of SMA among healthcare professionals and the public, supported by strong patient advocacy groups, is driving demand for diagnosis and treatment. Finally, favorable regulatory pathways for rare diseases and orphan drugs, coupled with increasing healthcare expenditure in developed and emerging economies, are facilitating market access and reimbursement for these life-changing therapies.
Challenges in the Spinal Muscular Atrophy Medicine Industry Sector
Despite its promising growth, the Spinal Muscular Atrophy (SMA) Medicine Industry faces significant challenges. The high cost of novel therapies, particularly gene replacement treatments, poses a substantial barrier to widespread accessibility and affordability for many healthcare systems and patients globally. Stringent and lengthy regulatory approval processes for rare disease treatments, while crucial for safety, can delay market entry and increase development costs. Furthermore, the limited patient population for SMA, being a rare disease, presents challenges in market sizing and achieving economies of scale for manufacturers. Competition from a few dominant players also intensifies the pressure to innovate and differentiate. Lastly, ensuring consistent supply chain integrity for complex biological therapies and managing their cold chain requirements adds logistical hurdles.
Emerging Opportunities in Spinal Muscular Atrophy Medicine Industry
The Spinal Muscular Atrophy (SMA) Medicine Industry is ripe with emerging opportunities driven by continuous scientific innovation and evolving patient needs. The development of next-generation gene therapies with improved safety profiles and broader efficacy across SMA subtypes represents a significant frontier. Expanding the application of existing therapies to older patient populations or those with different disease severities offers substantial market potential. The increasing focus on personalized medicine and the development of companion diagnostics to better stratify patients for optimal treatment selection is another key area. Furthermore, advancements in drug delivery systems, including less invasive methods and oral formulations, are creating opportunities for enhanced patient compliance and quality of life. The growing awareness and improving healthcare infrastructure in emerging economies also present a vast untapped market for SMA treatments.
Leading Players in the Spinal Muscular Atrophy Medicine Industry Market
- Novartis International AG
- Isis Pharmaceuticals Inc
- Sanofi Aventis Inc (GenZyme Corporation)
- Cytokinetics Inc
- Avexis Inc
- Biogen Inc
- Catalyst Pharmaceutical
- F Hoffmann - La Roche Ltd
- Chugai Pharmaceutical
- Pfizer Inc
Key Developments in Spinal Muscular Atrophy Medicine Industry Industry
- August 2021: Novartis announced the lift of a partial clinical trial hold and planned to initiate a new, pivotal Phase 3 study of intrathecal OAV-101 in older patients with spinal muscular atrophy.
- July 2021: Roche launched prescription medicine Evrysdi in India, which is used for spinal muscular atrophy in adults and children aged two months and older.
Strategic Outlook for Spinal Muscular Atrophy Medicine Industry Market
The strategic outlook for the Spinal Muscular Atrophy (SMA) Medicine Industry is exceptionally promising, driven by a potent combination of scientific advancement and increasing patient access. The market is poised for sustained growth, fueled by ongoing research into more effective and diversified therapeutic modalities, including next-generation gene therapies and novel small molecule drugs. A key strategic imperative will be to address the significant cost barriers associated with current treatments, fostering greater market penetration through innovative pricing models and value-based healthcare approaches. Expanding the reach of life-changing therapies into underserved regions and developing treatments for a wider spectrum of SMA subtypes will unlock substantial market potential. Furthermore, the industry's focus on improving patient quality of life through less invasive administration routes and enhanced long-term management strategies will continue to shape product development and market positioning, ensuring a robust and impactful future for SMA medicine.
Spinal Muscular Atrophy Medicine Industry Segmentation
-
1. Type
- 1.1. Type 1
- 1.2. Type 2
- 1.3. Type 3
- 1.4. Type 4
-
2. Procedure
- 2.1. Gene Replacement Therapy
- 2.2. Drug Therapy
- 2.3. Other Procedures
-
3. Route of Administration
- 3.1. Oral
- 3.2. Intrathecal
Spinal Muscular Atrophy Medicine Industry Segmentation By Geography
-
1. North America
- 1.1. United States
- 1.2. Canada
- 1.3. Mexico
-
2. Europe
- 2.1. Germany
- 2.2. United Kingdom
- 2.3. France
- 2.4. Italy
- 2.5. Spain
- 2.6. Rest of Europe
-
3. Asia Pacific
- 3.1. China
- 3.2. Japan
- 3.3. India
- 3.4. Australia
- 3.5. South Korea
- 3.6. Rest of Asia Pacific
-
4. Middle East and Africa
- 4.1. GCC
- 4.2. South Africa
- 4.3. Rest of Middle East and Africa
-
5. South America
- 5.1. Brazil
- 5.2. Argentina
- 5.3. Rest of South America
Spinal Muscular Atrophy Medicine Industry Regional Market Share
Geographic Coverage of Spinal Muscular Atrophy Medicine Industry
Spinal Muscular Atrophy Medicine Industry REPORT HIGHLIGHTS
| Aspects | Details |
|---|---|
| Study Period | 2020-2034 |
| Base Year | 2025 |
| Estimated Year | 2026 |
| Forecast Period | 2026-2034 |
| Historical Period | 2020-2025 |
| Growth Rate | CAGR of 17.68% from 2020-2034 |
| Segmentation |
|
Table of Contents
- 1. Introduction
- 1.1. Research Scope
- 1.2. Market Segmentation
- 1.3. Research Objective
- 1.4. Definitions and Assumptions
- 2. Executive Summary
- 2.1. Market Snapshot
- 3. Market Dynamics
- 3.1. Market Drivers
- 3.2. Market Restrains
- 3.3. Market Trends
- 3.4. Market Opportunities
- 4. Market Factor Analysis
- 4.1. Porters Five Forces
- 4.1.1. Bargaining Power of Suppliers
- 4.1.2. Bargaining Power of Buyers
- 4.1.3. Threat of New Entrants
- 4.1.4. Threat of Substitutes
- 4.1.5. Competitive Rivalry
- 4.2. PESTEL analysis
- 4.3. BCG Analysis
- 4.3.1. Stars (High Growth, High Market Share)
- 4.3.2. Cash Cows (Low Growth, High Market Share)
- 4.3.3. Question Mark (High Growth, Low Market Share)
- 4.3.4. Dogs (Low Growth, Low Market Share)
- 4.4. Ansoff Matrix Analysis
- 4.5. Supply Chain Analysis
- 4.6. Regulatory Landscape
- 4.7. Current Market Potential and Opportunity Assessment (TAM–SAM–SOM Framework)
- 4.8. RAX Analyst Note
- 4.1. Porters Five Forces
- 5. Market Analysis, Insights and Forecast 2021-2033
- 5.1. Market Analysis, Insights and Forecast - by Type
- 5.1.1. Type 1
- 5.1.2. Type 2
- 5.1.3. Type 3
- 5.1.4. Type 4
- 5.2. Market Analysis, Insights and Forecast - by Procedure
- 5.2.1. Gene Replacement Therapy
- 5.2.2. Drug Therapy
- 5.2.3. Other Procedures
- 5.3. Market Analysis, Insights and Forecast - by Route of Administration
- 5.3.1. Oral
- 5.3.2. Intrathecal
- 5.4. Market Analysis, Insights and Forecast - by Region
- 5.4.1. North America
- 5.4.2. Europe
- 5.4.3. Asia Pacific
- 5.4.4. Middle East and Africa
- 5.4.5. South America
- 5.1. Market Analysis, Insights and Forecast - by Type
- 6. Global Spinal Muscular Atrophy Medicine Industry Analysis, Insights and Forecast, 2021-2033
- 6.1. Market Analysis, Insights and Forecast - by Type
- 6.1.1. Type 1
- 6.1.2. Type 2
- 6.1.3. Type 3
- 6.1.4. Type 4
- 6.2. Market Analysis, Insights and Forecast - by Procedure
- 6.2.1. Gene Replacement Therapy
- 6.2.2. Drug Therapy
- 6.2.3. Other Procedures
- 6.3. Market Analysis, Insights and Forecast - by Route of Administration
- 6.3.1. Oral
- 6.3.2. Intrathecal
- 6.1. Market Analysis, Insights and Forecast - by Type
- 7. North America Spinal Muscular Atrophy Medicine Industry Analysis, Insights and Forecast, 2020-2032
- 7.1. Market Analysis, Insights and Forecast - by Type
- 7.1.1. Type 1
- 7.1.2. Type 2
- 7.1.3. Type 3
- 7.1.4. Type 4
- 7.2. Market Analysis, Insights and Forecast - by Procedure
- 7.2.1. Gene Replacement Therapy
- 7.2.2. Drug Therapy
- 7.2.3. Other Procedures
- 7.3. Market Analysis, Insights and Forecast - by Route of Administration
- 7.3.1. Oral
- 7.3.2. Intrathecal
- 7.1. Market Analysis, Insights and Forecast - by Type
- 8. Europe Spinal Muscular Atrophy Medicine Industry Analysis, Insights and Forecast, 2020-2032
- 8.1. Market Analysis, Insights and Forecast - by Type
- 8.1.1. Type 1
- 8.1.2. Type 2
- 8.1.3. Type 3
- 8.1.4. Type 4
- 8.2. Market Analysis, Insights and Forecast - by Procedure
- 8.2.1. Gene Replacement Therapy
- 8.2.2. Drug Therapy
- 8.2.3. Other Procedures
- 8.3. Market Analysis, Insights and Forecast - by Route of Administration
- 8.3.1. Oral
- 8.3.2. Intrathecal
- 8.1. Market Analysis, Insights and Forecast - by Type
- 9. Asia Pacific Spinal Muscular Atrophy Medicine Industry Analysis, Insights and Forecast, 2020-2032
- 9.1. Market Analysis, Insights and Forecast - by Type
- 9.1.1. Type 1
- 9.1.2. Type 2
- 9.1.3. Type 3
- 9.1.4. Type 4
- 9.2. Market Analysis, Insights and Forecast - by Procedure
- 9.2.1. Gene Replacement Therapy
- 9.2.2. Drug Therapy
- 9.2.3. Other Procedures
- 9.3. Market Analysis, Insights and Forecast - by Route of Administration
- 9.3.1. Oral
- 9.3.2. Intrathecal
- 9.1. Market Analysis, Insights and Forecast - by Type
- 10. Middle East and Africa Spinal Muscular Atrophy Medicine Industry Analysis, Insights and Forecast, 2020-2032
- 10.1. Market Analysis, Insights and Forecast - by Type
- 10.1.1. Type 1
- 10.1.2. Type 2
- 10.1.3. Type 3
- 10.1.4. Type 4
- 10.2. Market Analysis, Insights and Forecast - by Procedure
- 10.2.1. Gene Replacement Therapy
- 10.2.2. Drug Therapy
- 10.2.3. Other Procedures
- 10.3. Market Analysis, Insights and Forecast - by Route of Administration
- 10.3.1. Oral
- 10.3.2. Intrathecal
- 10.1. Market Analysis, Insights and Forecast - by Type
- 11. South America Spinal Muscular Atrophy Medicine Industry Analysis, Insights and Forecast, 2020-2032
- 11.1. Market Analysis, Insights and Forecast - by Type
- 11.1.1. Type 1
- 11.1.2. Type 2
- 11.1.3. Type 3
- 11.1.4. Type 4
- 11.2. Market Analysis, Insights and Forecast - by Procedure
- 11.2.1. Gene Replacement Therapy
- 11.2.2. Drug Therapy
- 11.2.3. Other Procedures
- 11.3. Market Analysis, Insights and Forecast - by Route of Administration
- 11.3.1. Oral
- 11.3.2. Intrathecal
- 11.1. Market Analysis, Insights and Forecast - by Type
- 12. Competitive Analysis
- 12.1. Company Profiles
- 12.1.1 Novartis International AG
- 12.1.1.1. Company Overview
- 12.1.1.2. Products
- 12.1.1.3. Company Financials
- 12.1.1.4. SWOT Analysis
- 12.1.2 Isis Pharmaceuticals Inc
- 12.1.2.1. Company Overview
- 12.1.2.2. Products
- 12.1.2.3. Company Financials
- 12.1.2.4. SWOT Analysis
- 12.1.3 Sanofi Aventis Inc (GenZyme Corporation)
- 12.1.3.1. Company Overview
- 12.1.3.2. Products
- 12.1.3.3. Company Financials
- 12.1.3.4. SWOT Analysis
- 12.1.4 Cytokinetics Inc
- 12.1.4.1. Company Overview
- 12.1.4.2. Products
- 12.1.4.3. Company Financials
- 12.1.4.4. SWOT Analysis
- 12.1.5 Avexis Inc
- 12.1.5.1. Company Overview
- 12.1.5.2. Products
- 12.1.5.3. Company Financials
- 12.1.5.4. SWOT Analysis
- 12.1.6 Biogen Inc
- 12.1.6.1. Company Overview
- 12.1.6.2. Products
- 12.1.6.3. Company Financials
- 12.1.6.4. SWOT Analysis
- 12.1.7 Catalyst Pharmaceutical
- 12.1.7.1. Company Overview
- 12.1.7.2. Products
- 12.1.7.3. Company Financials
- 12.1.7.4. SWOT Analysis
- 12.1.8 F Hoffmann - La Roche Ltd
- 12.1.8.1. Company Overview
- 12.1.8.2. Products
- 12.1.8.3. Company Financials
- 12.1.8.4. SWOT Analysis
- 12.1.9 Chugai Pharmaceutical
- 12.1.9.1. Company Overview
- 12.1.9.2. Products
- 12.1.9.3. Company Financials
- 12.1.9.4. SWOT Analysis
- 12.1.10 Pfizer Inc
- 12.1.10.1. Company Overview
- 12.1.10.2. Products
- 12.1.10.3. Company Financials
- 12.1.10.4. SWOT Analysis
- 12.1.1 Novartis International AG
- 12.2. Market Entropy
- 12.2.1 Company's Key Areas Served
- 12.2.2 Recent Developments
- 12.3. Company Market Share Analysis 2025
- 12.3.1 Top 5 Companies Market Share Analysis
- 12.3.2 Top 3 Companies Market Share Analysis
- 12.4. List of Potential Customers
- 13. Research Methodology
List of Figures
- Figure 1: Global Spinal Muscular Atrophy Medicine Industry Revenue Breakdown (billion, %) by Region 2025 & 2033
- Figure 2: Global Spinal Muscular Atrophy Medicine Industry Volume Breakdown (K Unit, %) by Region 2025 & 2033
- Figure 3: North America Spinal Muscular Atrophy Medicine Industry Revenue (billion), by Type 2025 & 2033
- Figure 4: North America Spinal Muscular Atrophy Medicine Industry Volume (K Unit), by Type 2025 & 2033
- Figure 5: North America Spinal Muscular Atrophy Medicine Industry Revenue Share (%), by Type 2025 & 2033
- Figure 6: North America Spinal Muscular Atrophy Medicine Industry Volume Share (%), by Type 2025 & 2033
- Figure 7: North America Spinal Muscular Atrophy Medicine Industry Revenue (billion), by Procedure 2025 & 2033
- Figure 8: North America Spinal Muscular Atrophy Medicine Industry Volume (K Unit), by Procedure 2025 & 2033
- Figure 9: North America Spinal Muscular Atrophy Medicine Industry Revenue Share (%), by Procedure 2025 & 2033
- Figure 10: North America Spinal Muscular Atrophy Medicine Industry Volume Share (%), by Procedure 2025 & 2033
- Figure 11: North America Spinal Muscular Atrophy Medicine Industry Revenue (billion), by Route of Administration 2025 & 2033
- Figure 12: North America Spinal Muscular Atrophy Medicine Industry Volume (K Unit), by Route of Administration 2025 & 2033
- Figure 13: North America Spinal Muscular Atrophy Medicine Industry Revenue Share (%), by Route of Administration 2025 & 2033
- Figure 14: North America Spinal Muscular Atrophy Medicine Industry Volume Share (%), by Route of Administration 2025 & 2033
- Figure 15: North America Spinal Muscular Atrophy Medicine Industry Revenue (billion), by Country 2025 & 2033
- Figure 16: North America Spinal Muscular Atrophy Medicine Industry Volume (K Unit), by Country 2025 & 2033
- Figure 17: North America Spinal Muscular Atrophy Medicine Industry Revenue Share (%), by Country 2025 & 2033
- Figure 18: North America Spinal Muscular Atrophy Medicine Industry Volume Share (%), by Country 2025 & 2033
- Figure 19: Europe Spinal Muscular Atrophy Medicine Industry Revenue (billion), by Type 2025 & 2033
- Figure 20: Europe Spinal Muscular Atrophy Medicine Industry Volume (K Unit), by Type 2025 & 2033
- Figure 21: Europe Spinal Muscular Atrophy Medicine Industry Revenue Share (%), by Type 2025 & 2033
- Figure 22: Europe Spinal Muscular Atrophy Medicine Industry Volume Share (%), by Type 2025 & 2033
- Figure 23: Europe Spinal Muscular Atrophy Medicine Industry Revenue (billion), by Procedure 2025 & 2033
- Figure 24: Europe Spinal Muscular Atrophy Medicine Industry Volume (K Unit), by Procedure 2025 & 2033
- Figure 25: Europe Spinal Muscular Atrophy Medicine Industry Revenue Share (%), by Procedure 2025 & 2033
- Figure 26: Europe Spinal Muscular Atrophy Medicine Industry Volume Share (%), by Procedure 2025 & 2033
- Figure 27: Europe Spinal Muscular Atrophy Medicine Industry Revenue (billion), by Route of Administration 2025 & 2033
- Figure 28: Europe Spinal Muscular Atrophy Medicine Industry Volume (K Unit), by Route of Administration 2025 & 2033
- Figure 29: Europe Spinal Muscular Atrophy Medicine Industry Revenue Share (%), by Route of Administration 2025 & 2033
- Figure 30: Europe Spinal Muscular Atrophy Medicine Industry Volume Share (%), by Route of Administration 2025 & 2033
- Figure 31: Europe Spinal Muscular Atrophy Medicine Industry Revenue (billion), by Country 2025 & 2033
- Figure 32: Europe Spinal Muscular Atrophy Medicine Industry Volume (K Unit), by Country 2025 & 2033
- Figure 33: Europe Spinal Muscular Atrophy Medicine Industry Revenue Share (%), by Country 2025 & 2033
- Figure 34: Europe Spinal Muscular Atrophy Medicine Industry Volume Share (%), by Country 2025 & 2033
- Figure 35: Asia Pacific Spinal Muscular Atrophy Medicine Industry Revenue (billion), by Type 2025 & 2033
- Figure 36: Asia Pacific Spinal Muscular Atrophy Medicine Industry Volume (K Unit), by Type 2025 & 2033
- Figure 37: Asia Pacific Spinal Muscular Atrophy Medicine Industry Revenue Share (%), by Type 2025 & 2033
- Figure 38: Asia Pacific Spinal Muscular Atrophy Medicine Industry Volume Share (%), by Type 2025 & 2033
- Figure 39: Asia Pacific Spinal Muscular Atrophy Medicine Industry Revenue (billion), by Procedure 2025 & 2033
- Figure 40: Asia Pacific Spinal Muscular Atrophy Medicine Industry Volume (K Unit), by Procedure 2025 & 2033
- Figure 41: Asia Pacific Spinal Muscular Atrophy Medicine Industry Revenue Share (%), by Procedure 2025 & 2033
- Figure 42: Asia Pacific Spinal Muscular Atrophy Medicine Industry Volume Share (%), by Procedure 2025 & 2033
- Figure 43: Asia Pacific Spinal Muscular Atrophy Medicine Industry Revenue (billion), by Route of Administration 2025 & 2033
- Figure 44: Asia Pacific Spinal Muscular Atrophy Medicine Industry Volume (K Unit), by Route of Administration 2025 & 2033
- Figure 45: Asia Pacific Spinal Muscular Atrophy Medicine Industry Revenue Share (%), by Route of Administration 2025 & 2033
- Figure 46: Asia Pacific Spinal Muscular Atrophy Medicine Industry Volume Share (%), by Route of Administration 2025 & 2033
- Figure 47: Asia Pacific Spinal Muscular Atrophy Medicine Industry Revenue (billion), by Country 2025 & 2033
- Figure 48: Asia Pacific Spinal Muscular Atrophy Medicine Industry Volume (K Unit), by Country 2025 & 2033
- Figure 49: Asia Pacific Spinal Muscular Atrophy Medicine Industry Revenue Share (%), by Country 2025 & 2033
- Figure 50: Asia Pacific Spinal Muscular Atrophy Medicine Industry Volume Share (%), by Country 2025 & 2033
- Figure 51: Middle East and Africa Spinal Muscular Atrophy Medicine Industry Revenue (billion), by Type 2025 & 2033
- Figure 52: Middle East and Africa Spinal Muscular Atrophy Medicine Industry Volume (K Unit), by Type 2025 & 2033
- Figure 53: Middle East and Africa Spinal Muscular Atrophy Medicine Industry Revenue Share (%), by Type 2025 & 2033
- Figure 54: Middle East and Africa Spinal Muscular Atrophy Medicine Industry Volume Share (%), by Type 2025 & 2033
- Figure 55: Middle East and Africa Spinal Muscular Atrophy Medicine Industry Revenue (billion), by Procedure 2025 & 2033
- Figure 56: Middle East and Africa Spinal Muscular Atrophy Medicine Industry Volume (K Unit), by Procedure 2025 & 2033
- Figure 57: Middle East and Africa Spinal Muscular Atrophy Medicine Industry Revenue Share (%), by Procedure 2025 & 2033
- Figure 58: Middle East and Africa Spinal Muscular Atrophy Medicine Industry Volume Share (%), by Procedure 2025 & 2033
- Figure 59: Middle East and Africa Spinal Muscular Atrophy Medicine Industry Revenue (billion), by Route of Administration 2025 & 2033
- Figure 60: Middle East and Africa Spinal Muscular Atrophy Medicine Industry Volume (K Unit), by Route of Administration 2025 & 2033
- Figure 61: Middle East and Africa Spinal Muscular Atrophy Medicine Industry Revenue Share (%), by Route of Administration 2025 & 2033
- Figure 62: Middle East and Africa Spinal Muscular Atrophy Medicine Industry Volume Share (%), by Route of Administration 2025 & 2033
- Figure 63: Middle East and Africa Spinal Muscular Atrophy Medicine Industry Revenue (billion), by Country 2025 & 2033
- Figure 64: Middle East and Africa Spinal Muscular Atrophy Medicine Industry Volume (K Unit), by Country 2025 & 2033
- Figure 65: Middle East and Africa Spinal Muscular Atrophy Medicine Industry Revenue Share (%), by Country 2025 & 2033
- Figure 66: Middle East and Africa Spinal Muscular Atrophy Medicine Industry Volume Share (%), by Country 2025 & 2033
- Figure 67: South America Spinal Muscular Atrophy Medicine Industry Revenue (billion), by Type 2025 & 2033
- Figure 68: South America Spinal Muscular Atrophy Medicine Industry Volume (K Unit), by Type 2025 & 2033
- Figure 69: South America Spinal Muscular Atrophy Medicine Industry Revenue Share (%), by Type 2025 & 2033
- Figure 70: South America Spinal Muscular Atrophy Medicine Industry Volume Share (%), by Type 2025 & 2033
- Figure 71: South America Spinal Muscular Atrophy Medicine Industry Revenue (billion), by Procedure 2025 & 2033
- Figure 72: South America Spinal Muscular Atrophy Medicine Industry Volume (K Unit), by Procedure 2025 & 2033
- Figure 73: South America Spinal Muscular Atrophy Medicine Industry Revenue Share (%), by Procedure 2025 & 2033
- Figure 74: South America Spinal Muscular Atrophy Medicine Industry Volume Share (%), by Procedure 2025 & 2033
- Figure 75: South America Spinal Muscular Atrophy Medicine Industry Revenue (billion), by Route of Administration 2025 & 2033
- Figure 76: South America Spinal Muscular Atrophy Medicine Industry Volume (K Unit), by Route of Administration 2025 & 2033
- Figure 77: South America Spinal Muscular Atrophy Medicine Industry Revenue Share (%), by Route of Administration 2025 & 2033
- Figure 78: South America Spinal Muscular Atrophy Medicine Industry Volume Share (%), by Route of Administration 2025 & 2033
- Figure 79: South America Spinal Muscular Atrophy Medicine Industry Revenue (billion), by Country 2025 & 2033
- Figure 80: South America Spinal Muscular Atrophy Medicine Industry Volume (K Unit), by Country 2025 & 2033
- Figure 81: South America Spinal Muscular Atrophy Medicine Industry Revenue Share (%), by Country 2025 & 2033
- Figure 82: South America Spinal Muscular Atrophy Medicine Industry Volume Share (%), by Country 2025 & 2033
List of Tables
- Table 1: Global Spinal Muscular Atrophy Medicine Industry Revenue billion Forecast, by Type 2020 & 2033
- Table 2: Global Spinal Muscular Atrophy Medicine Industry Volume K Unit Forecast, by Type 2020 & 2033
- Table 3: Global Spinal Muscular Atrophy Medicine Industry Revenue billion Forecast, by Procedure 2020 & 2033
- Table 4: Global Spinal Muscular Atrophy Medicine Industry Volume K Unit Forecast, by Procedure 2020 & 2033
- Table 5: Global Spinal Muscular Atrophy Medicine Industry Revenue billion Forecast, by Route of Administration 2020 & 2033
- Table 6: Global Spinal Muscular Atrophy Medicine Industry Volume K Unit Forecast, by Route of Administration 2020 & 2033
- Table 7: Global Spinal Muscular Atrophy Medicine Industry Revenue billion Forecast, by Region 2020 & 2033
- Table 8: Global Spinal Muscular Atrophy Medicine Industry Volume K Unit Forecast, by Region 2020 & 2033
- Table 9: Global Spinal Muscular Atrophy Medicine Industry Revenue billion Forecast, by Type 2020 & 2033
- Table 10: Global Spinal Muscular Atrophy Medicine Industry Volume K Unit Forecast, by Type 2020 & 2033
- Table 11: Global Spinal Muscular Atrophy Medicine Industry Revenue billion Forecast, by Procedure 2020 & 2033
- Table 12: Global Spinal Muscular Atrophy Medicine Industry Volume K Unit Forecast, by Procedure 2020 & 2033
- Table 13: Global Spinal Muscular Atrophy Medicine Industry Revenue billion Forecast, by Route of Administration 2020 & 2033
- Table 14: Global Spinal Muscular Atrophy Medicine Industry Volume K Unit Forecast, by Route of Administration 2020 & 2033
- Table 15: Global Spinal Muscular Atrophy Medicine Industry Revenue billion Forecast, by Country 2020 & 2033
- Table 16: Global Spinal Muscular Atrophy Medicine Industry Volume K Unit Forecast, by Country 2020 & 2033
- Table 17: United States Spinal Muscular Atrophy Medicine Industry Revenue (billion) Forecast, by Application 2020 & 2033
- Table 18: United States Spinal Muscular Atrophy Medicine Industry Volume (K Unit) Forecast, by Application 2020 & 2033
- Table 19: Canada Spinal Muscular Atrophy Medicine Industry Revenue (billion) Forecast, by Application 2020 & 2033
- Table 20: Canada Spinal Muscular Atrophy Medicine Industry Volume (K Unit) Forecast, by Application 2020 & 2033
- Table 21: Mexico Spinal Muscular Atrophy Medicine Industry Revenue (billion) Forecast, by Application 2020 & 2033
- Table 22: Mexico Spinal Muscular Atrophy Medicine Industry Volume (K Unit) Forecast, by Application 2020 & 2033
- Table 23: Global Spinal Muscular Atrophy Medicine Industry Revenue billion Forecast, by Type 2020 & 2033
- Table 24: Global Spinal Muscular Atrophy Medicine Industry Volume K Unit Forecast, by Type 2020 & 2033
- Table 25: Global Spinal Muscular Atrophy Medicine Industry Revenue billion Forecast, by Procedure 2020 & 2033
- Table 26: Global Spinal Muscular Atrophy Medicine Industry Volume K Unit Forecast, by Procedure 2020 & 2033
- Table 27: Global Spinal Muscular Atrophy Medicine Industry Revenue billion Forecast, by Route of Administration 2020 & 2033
- Table 28: Global Spinal Muscular Atrophy Medicine Industry Volume K Unit Forecast, by Route of Administration 2020 & 2033
- Table 29: Global Spinal Muscular Atrophy Medicine Industry Revenue billion Forecast, by Country 2020 & 2033
- Table 30: Global Spinal Muscular Atrophy Medicine Industry Volume K Unit Forecast, by Country 2020 & 2033
- Table 31: Germany Spinal Muscular Atrophy Medicine Industry Revenue (billion) Forecast, by Application 2020 & 2033
- Table 32: Germany Spinal Muscular Atrophy Medicine Industry Volume (K Unit) Forecast, by Application 2020 & 2033
- Table 33: United Kingdom Spinal Muscular Atrophy Medicine Industry Revenue (billion) Forecast, by Application 2020 & 2033
- Table 34: United Kingdom Spinal Muscular Atrophy Medicine Industry Volume (K Unit) Forecast, by Application 2020 & 2033
- Table 35: France Spinal Muscular Atrophy Medicine Industry Revenue (billion) Forecast, by Application 2020 & 2033
- Table 36: France Spinal Muscular Atrophy Medicine Industry Volume (K Unit) Forecast, by Application 2020 & 2033
- Table 37: Italy Spinal Muscular Atrophy Medicine Industry Revenue (billion) Forecast, by Application 2020 & 2033
- Table 38: Italy Spinal Muscular Atrophy Medicine Industry Volume (K Unit) Forecast, by Application 2020 & 2033
- Table 39: Spain Spinal Muscular Atrophy Medicine Industry Revenue (billion) Forecast, by Application 2020 & 2033
- Table 40: Spain Spinal Muscular Atrophy Medicine Industry Volume (K Unit) Forecast, by Application 2020 & 2033
- Table 41: Rest of Europe Spinal Muscular Atrophy Medicine Industry Revenue (billion) Forecast, by Application 2020 & 2033
- Table 42: Rest of Europe Spinal Muscular Atrophy Medicine Industry Volume (K Unit) Forecast, by Application 2020 & 2033
- Table 43: Global Spinal Muscular Atrophy Medicine Industry Revenue billion Forecast, by Type 2020 & 2033
- Table 44: Global Spinal Muscular Atrophy Medicine Industry Volume K Unit Forecast, by Type 2020 & 2033
- Table 45: Global Spinal Muscular Atrophy Medicine Industry Revenue billion Forecast, by Procedure 2020 & 2033
- Table 46: Global Spinal Muscular Atrophy Medicine Industry Volume K Unit Forecast, by Procedure 2020 & 2033
- Table 47: Global Spinal Muscular Atrophy Medicine Industry Revenue billion Forecast, by Route of Administration 2020 & 2033
- Table 48: Global Spinal Muscular Atrophy Medicine Industry Volume K Unit Forecast, by Route of Administration 2020 & 2033
- Table 49: Global Spinal Muscular Atrophy Medicine Industry Revenue billion Forecast, by Country 2020 & 2033
- Table 50: Global Spinal Muscular Atrophy Medicine Industry Volume K Unit Forecast, by Country 2020 & 2033
- Table 51: China Spinal Muscular Atrophy Medicine Industry Revenue (billion) Forecast, by Application 2020 & 2033
- Table 52: China Spinal Muscular Atrophy Medicine Industry Volume (K Unit) Forecast, by Application 2020 & 2033
- Table 53: Japan Spinal Muscular Atrophy Medicine Industry Revenue (billion) Forecast, by Application 2020 & 2033
- Table 54: Japan Spinal Muscular Atrophy Medicine Industry Volume (K Unit) Forecast, by Application 2020 & 2033
- Table 55: India Spinal Muscular Atrophy Medicine Industry Revenue (billion) Forecast, by Application 2020 & 2033
- Table 56: India Spinal Muscular Atrophy Medicine Industry Volume (K Unit) Forecast, by Application 2020 & 2033
- Table 57: Australia Spinal Muscular Atrophy Medicine Industry Revenue (billion) Forecast, by Application 2020 & 2033
- Table 58: Australia Spinal Muscular Atrophy Medicine Industry Volume (K Unit) Forecast, by Application 2020 & 2033
- Table 59: South Korea Spinal Muscular Atrophy Medicine Industry Revenue (billion) Forecast, by Application 2020 & 2033
- Table 60: South Korea Spinal Muscular Atrophy Medicine Industry Volume (K Unit) Forecast, by Application 2020 & 2033
- Table 61: Rest of Asia Pacific Spinal Muscular Atrophy Medicine Industry Revenue (billion) Forecast, by Application 2020 & 2033
- Table 62: Rest of Asia Pacific Spinal Muscular Atrophy Medicine Industry Volume (K Unit) Forecast, by Application 2020 & 2033
- Table 63: Global Spinal Muscular Atrophy Medicine Industry Revenue billion Forecast, by Type 2020 & 2033
- Table 64: Global Spinal Muscular Atrophy Medicine Industry Volume K Unit Forecast, by Type 2020 & 2033
- Table 65: Global Spinal Muscular Atrophy Medicine Industry Revenue billion Forecast, by Procedure 2020 & 2033
- Table 66: Global Spinal Muscular Atrophy Medicine Industry Volume K Unit Forecast, by Procedure 2020 & 2033
- Table 67: Global Spinal Muscular Atrophy Medicine Industry Revenue billion Forecast, by Route of Administration 2020 & 2033
- Table 68: Global Spinal Muscular Atrophy Medicine Industry Volume K Unit Forecast, by Route of Administration 2020 & 2033
- Table 69: Global Spinal Muscular Atrophy Medicine Industry Revenue billion Forecast, by Country 2020 & 2033
- Table 70: Global Spinal Muscular Atrophy Medicine Industry Volume K Unit Forecast, by Country 2020 & 2033
- Table 71: GCC Spinal Muscular Atrophy Medicine Industry Revenue (billion) Forecast, by Application 2020 & 2033
- Table 72: GCC Spinal Muscular Atrophy Medicine Industry Volume (K Unit) Forecast, by Application 2020 & 2033
- Table 73: South Africa Spinal Muscular Atrophy Medicine Industry Revenue (billion) Forecast, by Application 2020 & 2033
- Table 74: South Africa Spinal Muscular Atrophy Medicine Industry Volume (K Unit) Forecast, by Application 2020 & 2033
- Table 75: Rest of Middle East and Africa Spinal Muscular Atrophy Medicine Industry Revenue (billion) Forecast, by Application 2020 & 2033
- Table 76: Rest of Middle East and Africa Spinal Muscular Atrophy Medicine Industry Volume (K Unit) Forecast, by Application 2020 & 2033
- Table 77: Global Spinal Muscular Atrophy Medicine Industry Revenue billion Forecast, by Type 2020 & 2033
- Table 78: Global Spinal Muscular Atrophy Medicine Industry Volume K Unit Forecast, by Type 2020 & 2033
- Table 79: Global Spinal Muscular Atrophy Medicine Industry Revenue billion Forecast, by Procedure 2020 & 2033
- Table 80: Global Spinal Muscular Atrophy Medicine Industry Volume K Unit Forecast, by Procedure 2020 & 2033
- Table 81: Global Spinal Muscular Atrophy Medicine Industry Revenue billion Forecast, by Route of Administration 2020 & 2033
- Table 82: Global Spinal Muscular Atrophy Medicine Industry Volume K Unit Forecast, by Route of Administration 2020 & 2033
- Table 83: Global Spinal Muscular Atrophy Medicine Industry Revenue billion Forecast, by Country 2020 & 2033
- Table 84: Global Spinal Muscular Atrophy Medicine Industry Volume K Unit Forecast, by Country 2020 & 2033
- Table 85: Brazil Spinal Muscular Atrophy Medicine Industry Revenue (billion) Forecast, by Application 2020 & 2033
- Table 86: Brazil Spinal Muscular Atrophy Medicine Industry Volume (K Unit) Forecast, by Application 2020 & 2033
- Table 87: Argentina Spinal Muscular Atrophy Medicine Industry Revenue (billion) Forecast, by Application 2020 & 2033
- Table 88: Argentina Spinal Muscular Atrophy Medicine Industry Volume (K Unit) Forecast, by Application 2020 & 2033
- Table 89: Rest of South America Spinal Muscular Atrophy Medicine Industry Revenue (billion) Forecast, by Application 2020 & 2033
- Table 90: Rest of South America Spinal Muscular Atrophy Medicine Industry Volume (K Unit) Forecast, by Application 2020 & 2033
Frequently Asked Questions
1. What is the projected Compound Annual Growth Rate (CAGR) of the Spinal Muscular Atrophy Medicine Industry?
The projected CAGR is approximately 17.68%.
2. Which companies are prominent players in the Spinal Muscular Atrophy Medicine Industry?
Key companies in the market include Novartis International AG, Isis Pharmaceuticals Inc, Sanofi Aventis Inc (GenZyme Corporation), Cytokinetics Inc, Avexis Inc, Biogen Inc, Catalyst Pharmaceutical, F Hoffmann - La Roche Ltd, Chugai Pharmaceutical, Pfizer Inc.
3. What are the main segments of the Spinal Muscular Atrophy Medicine Industry?
The market segments include Type, Procedure, Route of Administration.
4. Can you provide details about the market size?
The market size is estimated to be USD 5.17 billion as of 2022.
5. What are some drivers contributing to market growth?
Growing Awareness Regarding Spinal Muscular Atrophy. Its Diagnostics. and Its Treatment; Rise in the Government Initiatives to Improve Healthcare Infrastructure; Increasing R&D Activities to Develop Novel Treatment Regimens for Rare Diseases.
6. What are the notable trends driving market growth?
The Gene Replacement Therapy Segment Dominates the Market. and the Same is Expected Over the Forecast Period.
7. Are there any restraints impacting market growth?
High Cost of Treatment; Lack of Skilled Professionals for Surgical Procedures and Physiotherapy Regimens.
8. Can you provide examples of recent developments in the market?
In August 2021, Novartis announced the lift of a partial clinical trial hold and planned to initiate a new, pivotal Phase 3 study of intrathecal OAV-101 in older patients with spinal muscular atrophy.
9. What pricing options are available for accessing the report?
Pricing options include single-user, multi-user, and enterprise licenses priced at USD 4750, USD 5250, and USD 8750 respectively.
10. Is the market size provided in terms of value or volume?
The market size is provided in terms of value, measured in billion and volume, measured in K Unit.
11. Are there any specific market keywords associated with the report?
Yes, the market keyword associated with the report is "Spinal Muscular Atrophy Medicine Industry," which aids in identifying and referencing the specific market segment covered.
12. How do I determine which pricing option suits my needs best?
The pricing options vary based on user requirements and access needs. Individual users may opt for single-user licenses, while businesses requiring broader access may choose multi-user or enterprise licenses for cost-effective access to the report.
13. Are there any additional resources or data provided in the Spinal Muscular Atrophy Medicine Industry report?
While the report offers comprehensive insights, it's advisable to review the specific contents or supplementary materials provided to ascertain if additional resources or data are available.
14. How can I stay updated on further developments or reports in the Spinal Muscular Atrophy Medicine Industry?
To stay informed about further developments, trends, and reports in the Spinal Muscular Atrophy Medicine Industry, consider subscribing to industry newsletters, following relevant companies and organizations, or regularly checking reputable industry news sources and publications.
Methodology
Step 1 - Identification of Relevant Samples Size from Population Database


Step 2 - Approaches for Defining Global Market Size (Value, Volume* & Price*)

Note*: In applicable scenarios
Step 3 - Data Sources
Primary Research
- Web Analytics
- Survey Reports
- Research Institute
- Latest Research Reports
- Opinion Leaders
Secondary Research
- Annual Reports
- White Paper
- Latest Press Release
- Industry Association
- Paid Database
- Investor Presentations

Step 4 - Data Triangulation
Involves using different sources of information in order to increase the validity of a study
These sources are likely to be stakeholders in a program - participants, other researchers, program staff, other community members, and so on.
Then we put all data in single framework & apply various statistical tools to find out the dynamic on the market.
During the analysis stage, feedback from the stakeholder groups would be compared to determine areas of agreement as well as areas of divergence