

Key Insights
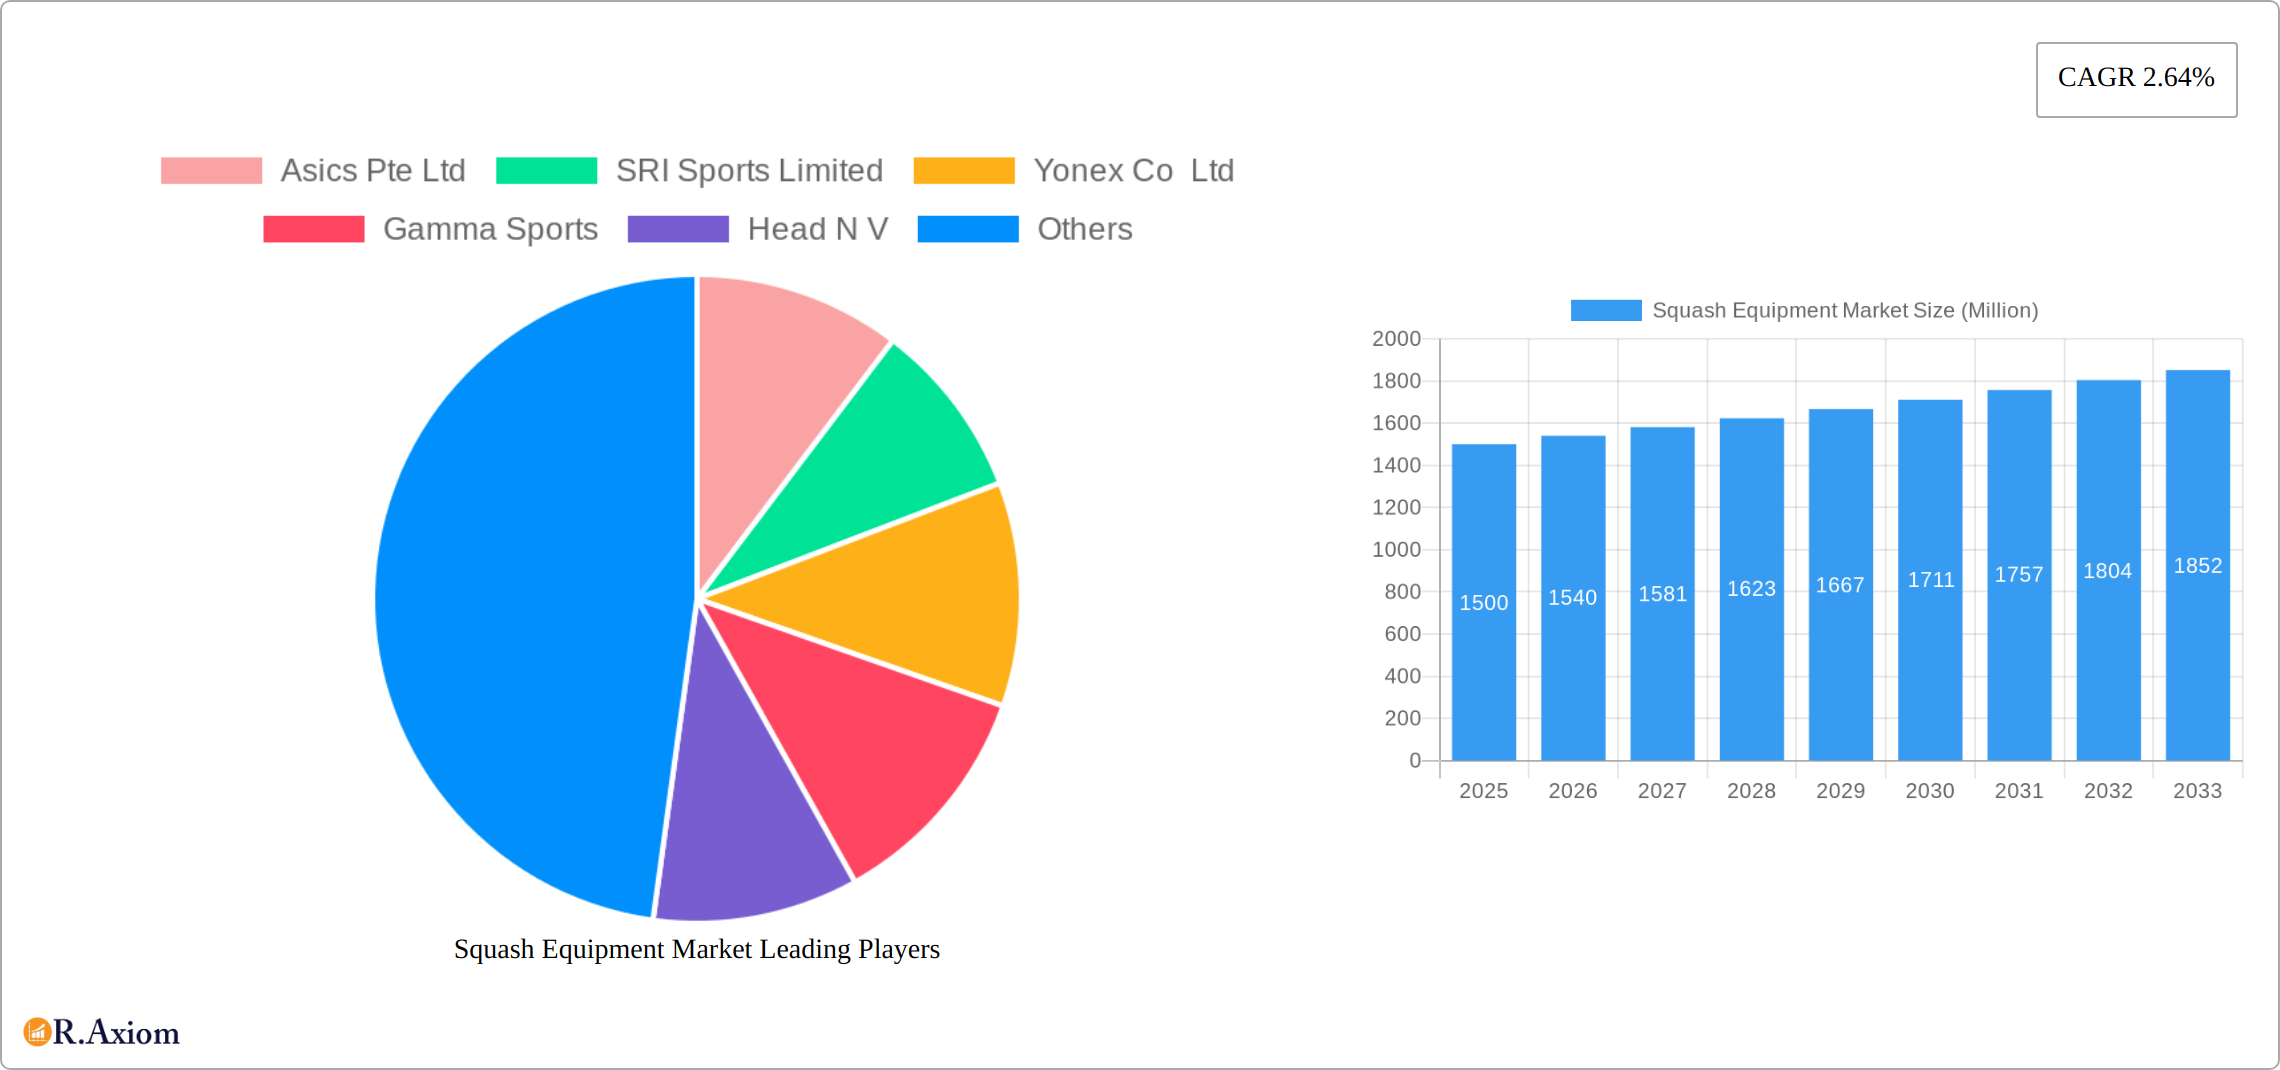
The global squash equipment market is poised for robust expansion, driven by rising participation rates, especially among younger demographics in emerging economies, and the increasing prominence of professional squash leagues. The market is forecasted to grow at a Compound Annual Growth Rate (CAGR) of 14.77%, reaching an estimated size of $10.15 billion by the base year 2025. Key growth catalysts include increasing disposable incomes in developing regions, advancements in racket technology enhancing player performance, and a growing emphasis on health and fitness promoting racquet sport engagement. The market encompasses a variety of products such as rackets, balls, eyewear, bags, shoes, and accessories, catering primarily to squash and potentially overlapping with racquetball. Online distribution channels are anticipated to experience significant growth. While broader participation compared to sports like tennis presents a challenge, strategic marketing highlighting squash's fitness, skill development, and social benefits, coupled with leveraging digital platforms, will be crucial for market penetration. Leading players, including Head N V, Babolat, and Tecnifibre, are focused on innovation and brand development. North America and Europe currently lead the market share, with the Asia-Pacific region offering substantial growth prospects due to increasing participation and economic development.
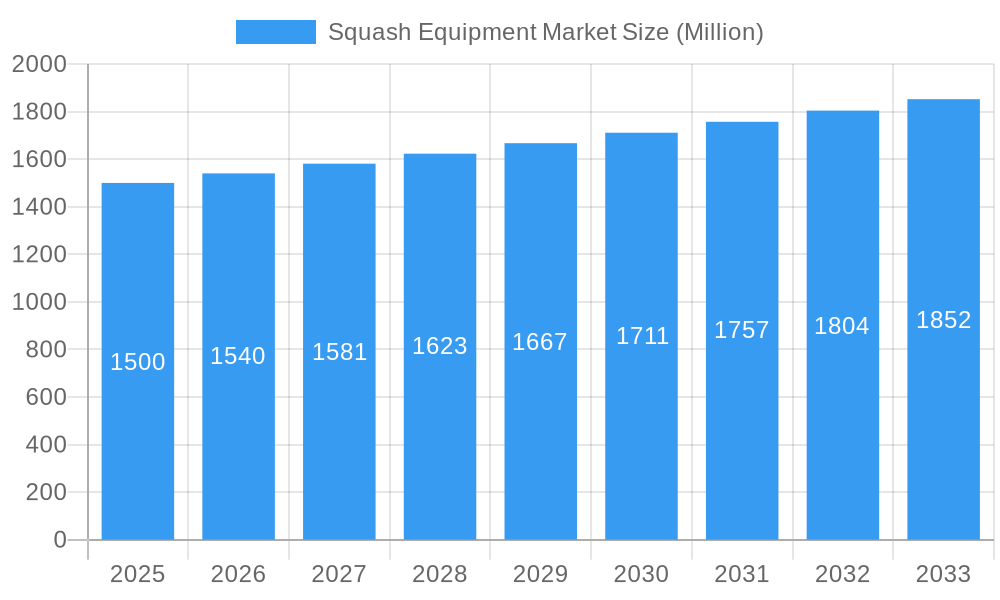
Squash Equipment Market Market Size (In Billion)
The competitive environment features a blend of established global brands and regional specialists. Dominant players rely on brand recognition and extensive distribution, while new entrants focus on product innovation and niche segments. Market growth will be influenced by ongoing efforts to promote squash, attract new players through engaging experiences, and navigate competitive pressures within the broader sporting goods sector. The growing integration of squash in fitness centers and recreational facilities presents additional expansion opportunities, making the market attractive for investment. Furthermore, the incorporation of smart technology in equipment, such as performance-tracking rackets, is expected to drive further market growth and product differentiation.
Squash Equipment Market Company Market Share
Squash Equipment Market: A Comprehensive Report (2019-2033)
This in-depth report provides a comprehensive analysis of the Squash Equipment Market, encompassing historical data (2019-2024), the base year (2025), and a detailed forecast (2025-2033). It delves into market segmentation, competitive dynamics, growth drivers, challenges, and emerging opportunities, offering actionable insights for stakeholders across the industry. The report covers key players such as Asics Pte Ltd, SRI Sports Limited, Yonex Co Ltd, Gamma Sports, Head N V, Li-Ning Company Limited, Tecnifibre, Amer Sports, Goode Sport, The Babolat, and Christopher Cloos, providing a holistic view of the market landscape. The total market size is projected to reach xx Million by 2033.
Squash Equipment Market Market Concentration & Innovation
This section analyzes the level of market concentration within the squash equipment industry, identifying key players and their market share. It examines innovation drivers, including technological advancements in materials and design, and assesses the impact of regulatory frameworks on market growth. The role of product substitutes, evolving end-user trends (e.g., preference for lighter rackets, specialized footwear), and the influence of mergers and acquisitions (M&A) activities, including deal values, on market consolidation are also discussed.
- Market Concentration: The market is moderately concentrated, with the top five players holding approximately xx% of the market share in 2025.
- Innovation Drivers: Advancements in materials science (e.g., lighter, stronger carbon fiber), ergonomic designs, and smart technologies are key innovation drivers.
- Regulatory Landscape: Regulations concerning product safety and environmental impact influence market dynamics.
- M&A Activity: The past five years have seen xx M&A deals in the squash equipment sector, with a total deal value of approximately xx Million. These transactions have primarily focused on expanding product portfolios and geographical reach.
- Product Substitutes: While limited, alternatives such as recycled or sustainable materials pose a potential threat to traditional players.
- End-User Trends: A growing preference for customized equipment and personalized fitting experiences is shaping market demand.
Squash Equipment Market Industry Trends & Insights
This section provides a comprehensive overview of the Squash Equipment Market's growth trajectory, pinpointing key drivers, technological disruptions, evolving consumer preferences, and competitive dynamics. The analysis will include the Compound Annual Growth Rate (CAGR) and market penetration rates for key segments. Market size is projected to reach xx Million by 2033, driven by factors such as increasing participation in squash and the adoption of technologically advanced equipment. Technological advancements like improved racket designs and materials are driving sales. Consumer preferences for customized, durable, and aesthetically pleasing equipment are also influencing market trends. The competitive landscape is characterized by both established players and emerging brands, leading to dynamic pricing and product innovation.
Dominant Markets & Segments in Squash Equipment Market
The Squash Equipment Market is a dynamic landscape shaped by diverse regional preferences, product types, and distribution channels. This section details the key players and trends influencing market segmentation and growth.
- Dominant Regions: While North America currently holds a significant market share (precise figures require further market research and should be inserted here, e.g., "approximately X%"), strong growth is also observed in Asia-Pacific and Europe, driven by increasing participation rates and infrastructure development in these regions. Further analysis is needed to quantify the exact market share for each region in 2025 and beyond.
- Dominant Product Segments: Rackets consistently dominate the market, accounting for a substantial portion of revenue (insert precise figures here, e.g., "approximately X%"). However, other segments like footwear and eyewear are also experiencing notable growth as players prioritize performance and protection. The market is witnessing the introduction of more specialized products catering to different player skill levels and playing styles.
- Dominant Distribution Channels: Online retail continues its rapid expansion (insert projected market share figures, e.g., "projected to reach X% by 2033"), complementing traditional channels such as specialty sporting goods stores and supermarkets. The growth of e-commerce provides greater accessibility to equipment for players worldwide and allows for more targeted marketing efforts.
Key Growth Drivers:
- Rising Participation Rates: Globally, squash is experiencing a surge in popularity, attracting a wider range of demographics and skill levels.
- Technological Advancements: Innovations in materials science and manufacturing techniques lead to lighter, stronger, and more aerodynamic rackets and other equipment, enhancing performance and durability.
- Increased Disposable Income: Rising disposable income in key markets fuels higher spending on sporting goods, including squash equipment.
- Government and Private Investment: Increased investment in sports infrastructure, including squash courts, promotes participation and market expansion.
- Focus on Customization: The growing trend towards personalized equipment allows manufacturers to cater to individual player needs and preferences, increasing customer loyalty and market share.
Squash Equipment Market Product Developments
Recent years have witnessed significant product innovations within the squash equipment market. Manufacturers are focusing on enhancing performance through lighter materials, improved aerodynamics, and advanced technologies. These innovations cater to the diverse needs of players, from beginners to professionals, offering enhanced control, power, and comfort. The market is witnessing a trend towards customization options, allowing players to personalize their equipment. This focus on innovation helps companies gain a competitive edge and drive market growth.
Report Scope & Segmentation Analysis
This report segments the Squash Equipment Market based on Product (Rackets, Balls, Eyewear, Racket Bags, Shoes, Accessories), Sport (Lawn Tennis, Table Tennis, Badminton, Squash), and Distribution Channel (Supermarkets/Hypermarkets, Specialty Stores, Online Stores, Other Distribution Channels). Each segment's growth projections, market size, and competitive landscape are analyzed in detail. The market is projected to witness significant growth across all segments, with online channels showing particularly rapid expansion. Competitive dynamics vary significantly depending on the segment and geographical region.
Key Drivers of Squash Equipment Market Growth
The growth of the Squash Equipment Market is driven by several factors: the rising popularity of squash globally, technological advancements in equipment design and materials leading to improved performance and durability, increased disposable income and spending power in key regions, and governmental support for sports infrastructure development. The growing preference for personalized and customized equipment is another key driver.
Challenges in the Squash Equipment Market Sector
Challenges faced by the Squash Equipment Market include intense competition from established and emerging players, price volatility due to fluctuating raw material costs, and the potential impact of economic downturns on consumer spending. Supply chain disruptions, particularly concerning sourcing of raw materials, can also hinder growth. Regulatory compliance requirements and evolving consumer preferences also present ongoing challenges.
Emerging Opportunities in Squash Equipment Market
Emerging opportunities include expanding into untapped markets in developing countries, leveraging technological advancements like smart sensors and data analytics to enhance player performance, and focusing on sustainable and eco-friendly materials to meet growing environmental concerns. Catering to niche segments like women's and youth squash players also presents a significant opportunity.
Leading Players in the Squash Equipment Market Market
- Asics Pte Ltd
- SRI Sports Limited
- Yonex Co Ltd
- Gamma Sports
- Head N V
- Li-Ning Company Limited
- Tecnifibre
- Amer Sports
- Goode Sport
- The Babolat
- Christopher Cloos
Key Developments in Squash Equipment Market Industry
- December 2022: Yonex Co. Ltd. launched the Astrox Nextage badminton racket series, featuring an impact-absorbing frame for improved control.
- December 2022: Yonex Co. Ltd. launched the 7th generation VCORE tennis racket, offering enhanced spin and trajectory control.
- September 2021: Goode Sports' Ashway brand launched two new badminton rackets (Superlight 11 Hex and Phantom XA Pro Lite) and a new racket bag (AHS09).
Strategic Outlook for Squash Equipment Market Market
The Squash Equipment Market is poised for continued growth, driven by factors like rising participation rates, technological innovation, and expanding distribution channels. Focusing on product differentiation, sustainable practices, and strategic partnerships will be crucial for success in this competitive landscape. Expansion into new markets and leveraging digital marketing strategies will further contribute to market expansion. The global market holds significant potential for growth, particularly in emerging economies.
Squash Equipment Market Segmentation
-
1. Product
- 1.1. Rackets
- 1.2. Balls
- 1.3. Eyewear
- 1.4. Racket bags
- 1.5. Shoes
- 1.6. Accessories
-
2. Sport
- 2.1. Lawn Tennis
- 2.2. Table Tennis
- 2.3. Badminton
- 2.4. Squash
-
3. Distribution Channel
- 3.1. Supermarkets/Hypermarkets
- 3.2. Specialty Stores
- 3.3. Online Stores
- 3.4. Other Distribution Channels
Squash Equipment Market Segmentation By Geography
-
1. North America
- 1.1. United States
- 1.2. Canada
- 1.3. Mexico
- 1.4. Rest of North America
-
2. Europe
- 2.1. United Kingdom
- 2.2. Gremany
- 2.3. France
- 2.4. Spain
- 2.5. Italy
- 2.6. Russia
- 2.7. Rest of Europe
-
3. Asia Pacific
- 3.1. China
- 3.2. Japan
- 3.3. India
- 3.4. Australia
- 3.5. Rest of Asia Pacific
-
4. South America
- 4.1. Brazil
- 4.2. Argentina
- 4.3. Rest of South America
- 5. Middle East
-
6. Saudi Arabia
- 6.1. South Africa
- 6.2. Rest of the Middle East
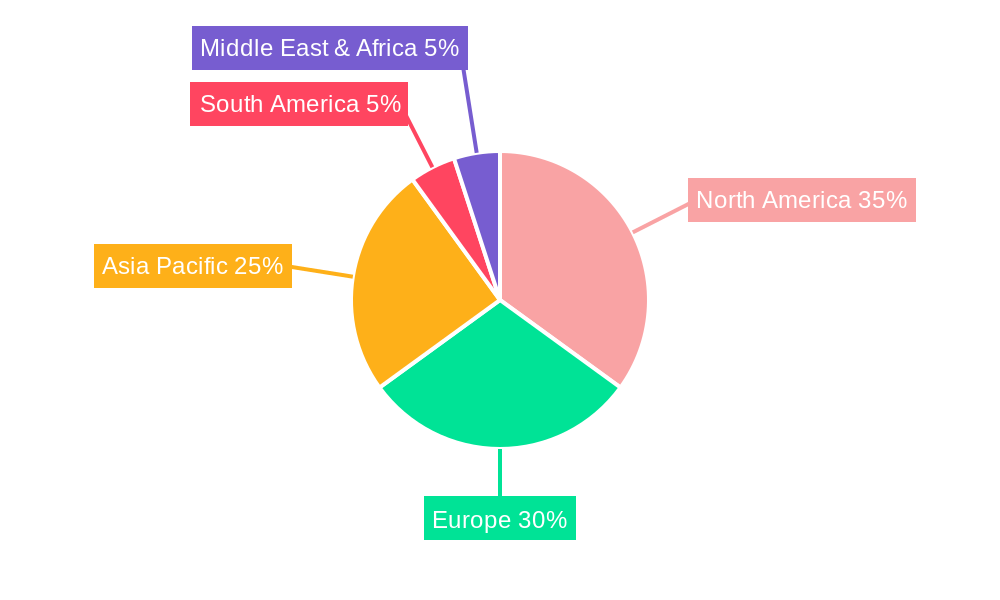
Squash Equipment Market Regional Market Share
Geographic Coverage of Squash Equipment Market
Squash Equipment Market REPORT HIGHLIGHTS
| Aspects | Details |
|---|---|
| Study Period | 2020-2034 |
| Base Year | 2025 |
| Estimated Year | 2026 |
| Forecast Period | 2026-2034 |
| Historical Period | 2020-2025 |
| Growth Rate | CAGR of 14.77% from 2020-2034 |
| Segmentation |
|
Table of Contents
- 1. Introduction
- 1.1. Research Scope
- 1.2. Market Segmentation
- 1.3. Research Objective
- 1.4. Definitions and Assumptions
- 2. Executive Summary
- 2.1. Market Snapshot
- 3. Market Dynamics
- 3.1. Market Drivers
- 3.2. Market Restrains
- 3.3. Market Trends
- 3.4. Market Opportunities
- 4. Market Factor Analysis
- 4.1. Porters Five Forces
- 4.1.1. Bargaining Power of Suppliers
- 4.1.2. Bargaining Power of Buyers
- 4.1.3. Threat of New Entrants
- 4.1.4. Threat of Substitutes
- 4.1.5. Competitive Rivalry
- 4.2. PESTEL analysis
- 4.3. BCG Analysis
- 4.3.1. Stars (High Growth, High Market Share)
- 4.3.2. Cash Cows (Low Growth, High Market Share)
- 4.3.3. Question Mark (High Growth, Low Market Share)
- 4.3.4. Dogs (Low Growth, Low Market Share)
- 4.4. Ansoff Matrix Analysis
- 4.5. Supply Chain Analysis
- 4.6. Regulatory Landscape
- 4.7. Current Market Potential and Opportunity Assessment (TAM–SAM–SOM Framework)
- 4.8. RAX Analyst Note
- 4.1. Porters Five Forces
- 5. Market Analysis, Insights and Forecast 2021-2033
- 5.1. Market Analysis, Insights and Forecast - by Product
- 5.1.1. Rackets
- 5.1.2. Balls
- 5.1.3. Eyewear
- 5.1.4. Racket bags
- 5.1.5. Shoes
- 5.1.6. Accessories
- 5.2. Market Analysis, Insights and Forecast - by Sport
- 5.2.1. Lawn Tennis
- 5.2.2. Table Tennis
- 5.2.3. Badminton
- 5.2.4. Squash
- 5.3. Market Analysis, Insights and Forecast - by Distribution Channel
- 5.3.1. Supermarkets/Hypermarkets
- 5.3.2. Specialty Stores
- 5.3.3. Online Stores
- 5.3.4. Other Distribution Channels
- 5.4. Market Analysis, Insights and Forecast - by Region
- 5.4.1. North America
- 5.4.2. Europe
- 5.4.3. Asia Pacific
- 5.4.4. South America
- 5.4.5. Middle East
- 5.4.6. Saudi Arabia
- 5.1. Market Analysis, Insights and Forecast - by Product
- 6. Global Squash Equipment Market Analysis, Insights and Forecast, 2021-2033
- 6.1. Market Analysis, Insights and Forecast - by Product
- 6.1.1. Rackets
- 6.1.2. Balls
- 6.1.3. Eyewear
- 6.1.4. Racket bags
- 6.1.5. Shoes
- 6.1.6. Accessories
- 6.2. Market Analysis, Insights and Forecast - by Sport
- 6.2.1. Lawn Tennis
- 6.2.2. Table Tennis
- 6.2.3. Badminton
- 6.2.4. Squash
- 6.3. Market Analysis, Insights and Forecast - by Distribution Channel
- 6.3.1. Supermarkets/Hypermarkets
- 6.3.2. Specialty Stores
- 6.3.3. Online Stores
- 6.3.4. Other Distribution Channels
- 6.1. Market Analysis, Insights and Forecast - by Product
- 7. North America Squash Equipment Market Analysis, Insights and Forecast, 2020-2032
- 7.1. Market Analysis, Insights and Forecast - by Product
- 7.1.1. Rackets
- 7.1.2. Balls
- 7.1.3. Eyewear
- 7.1.4. Racket bags
- 7.1.5. Shoes
- 7.1.6. Accessories
- 7.2. Market Analysis, Insights and Forecast - by Sport
- 7.2.1. Lawn Tennis
- 7.2.2. Table Tennis
- 7.2.3. Badminton
- 7.2.4. Squash
- 7.3. Market Analysis, Insights and Forecast - by Distribution Channel
- 7.3.1. Supermarkets/Hypermarkets
- 7.3.2. Specialty Stores
- 7.3.3. Online Stores
- 7.3.4. Other Distribution Channels
- 7.1. Market Analysis, Insights and Forecast - by Product
- 8. Europe Squash Equipment Market Analysis, Insights and Forecast, 2020-2032
- 8.1. Market Analysis, Insights and Forecast - by Product
- 8.1.1. Rackets
- 8.1.2. Balls
- 8.1.3. Eyewear
- 8.1.4. Racket bags
- 8.1.5. Shoes
- 8.1.6. Accessories
- 8.2. Market Analysis, Insights and Forecast - by Sport
- 8.2.1. Lawn Tennis
- 8.2.2. Table Tennis
- 8.2.3. Badminton
- 8.2.4. Squash
- 8.3. Market Analysis, Insights and Forecast - by Distribution Channel
- 8.3.1. Supermarkets/Hypermarkets
- 8.3.2. Specialty Stores
- 8.3.3. Online Stores
- 8.3.4. Other Distribution Channels
- 8.1. Market Analysis, Insights and Forecast - by Product
- 9. Asia Pacific Squash Equipment Market Analysis, Insights and Forecast, 2020-2032
- 9.1. Market Analysis, Insights and Forecast - by Product
- 9.1.1. Rackets
- 9.1.2. Balls
- 9.1.3. Eyewear
- 9.1.4. Racket bags
- 9.1.5. Shoes
- 9.1.6. Accessories
- 9.2. Market Analysis, Insights and Forecast - by Sport
- 9.2.1. Lawn Tennis
- 9.2.2. Table Tennis
- 9.2.3. Badminton
- 9.2.4. Squash
- 9.3. Market Analysis, Insights and Forecast - by Distribution Channel
- 9.3.1. Supermarkets/Hypermarkets
- 9.3.2. Specialty Stores
- 9.3.3. Online Stores
- 9.3.4. Other Distribution Channels
- 9.1. Market Analysis, Insights and Forecast - by Product
- 10. South America Squash Equipment Market Analysis, Insights and Forecast, 2020-2032
- 10.1. Market Analysis, Insights and Forecast - by Product
- 10.1.1. Rackets
- 10.1.2. Balls
- 10.1.3. Eyewear
- 10.1.4. Racket bags
- 10.1.5. Shoes
- 10.1.6. Accessories
- 10.2. Market Analysis, Insights and Forecast - by Sport
- 10.2.1. Lawn Tennis
- 10.2.2. Table Tennis
- 10.2.3. Badminton
- 10.2.4. Squash
- 10.3. Market Analysis, Insights and Forecast - by Distribution Channel
- 10.3.1. Supermarkets/Hypermarkets
- 10.3.2. Specialty Stores
- 10.3.3. Online Stores
- 10.3.4. Other Distribution Channels
- 10.1. Market Analysis, Insights and Forecast - by Product
- 11. Middle East Squash Equipment Market Analysis, Insights and Forecast, 2020-2032
- 11.1. Market Analysis, Insights and Forecast - by Product
- 11.1.1. Rackets
- 11.1.2. Balls
- 11.1.3. Eyewear
- 11.1.4. Racket bags
- 11.1.5. Shoes
- 11.1.6. Accessories
- 11.2. Market Analysis, Insights and Forecast - by Sport
- 11.2.1. Lawn Tennis
- 11.2.2. Table Tennis
- 11.2.3. Badminton
- 11.2.4. Squash
- 11.3. Market Analysis, Insights and Forecast - by Distribution Channel
- 11.3.1. Supermarkets/Hypermarkets
- 11.3.2. Specialty Stores
- 11.3.3. Online Stores
- 11.3.4. Other Distribution Channels
- 11.1. Market Analysis, Insights and Forecast - by Product
- 12. Saudi Arabia Squash Equipment Market Analysis, Insights and Forecast, 2020-2032
- 12.1. Market Analysis, Insights and Forecast - by Product
- 12.1.1. Rackets
- 12.1.2. Balls
- 12.1.3. Eyewear
- 12.1.4. Racket bags
- 12.1.5. Shoes
- 12.1.6. Accessories
- 12.2. Market Analysis, Insights and Forecast - by Sport
- 12.2.1. Lawn Tennis
- 12.2.2. Table Tennis
- 12.2.3. Badminton
- 12.2.4. Squash
- 12.3. Market Analysis, Insights and Forecast - by Distribution Channel
- 12.3.1. Supermarkets/Hypermarkets
- 12.3.2. Specialty Stores
- 12.3.3. Online Stores
- 12.3.4. Other Distribution Channels
- 12.1. Market Analysis, Insights and Forecast - by Product
- 13. Competitive Analysis
- 13.1. Company Profiles
- 13.1.1 Asics Pte Ltd
- 13.1.1.1. Company Overview
- 13.1.1.2. Products
- 13.1.1.3. Company Financials
- 13.1.1.4. SWOT Analysis
- 13.1.2 SRI Sports Limited
- 13.1.2.1. Company Overview
- 13.1.2.2. Products
- 13.1.2.3. Company Financials
- 13.1.2.4. SWOT Analysis
- 13.1.3 Yonex Co Ltd
- 13.1.3.1. Company Overview
- 13.1.3.2. Products
- 13.1.3.3. Company Financials
- 13.1.3.4. SWOT Analysis
- 13.1.4 Gamma Sports
- 13.1.4.1. Company Overview
- 13.1.4.2. Products
- 13.1.4.3. Company Financials
- 13.1.4.4. SWOT Analysis
- 13.1.5 Head N V
- 13.1.5.1. Company Overview
- 13.1.5.2. Products
- 13.1.5.3. Company Financials
- 13.1.5.4. SWOT Analysis
- 13.1.6 Li-Ning Company Limited
- 13.1.6.1. Company Overview
- 13.1.6.2. Products
- 13.1.6.3. Company Financials
- 13.1.6.4. SWOT Analysis
- 13.1.7 Tecnifibre
- 13.1.7.1. Company Overview
- 13.1.7.2. Products
- 13.1.7.3. Company Financials
- 13.1.7.4. SWOT Analysis
- 13.1.8 Amer Sports
- 13.1.8.1. Company Overview
- 13.1.8.2. Products
- 13.1.8.3. Company Financials
- 13.1.8.4. SWOT Analysis
- 13.1.9 Goode Sport
- 13.1.9.1. Company Overview
- 13.1.9.2. Products
- 13.1.9.3. Company Financials
- 13.1.9.4. SWOT Analysis
- 13.1.10 The Babolat
- 13.1.10.1. Company Overview
- 13.1.10.2. Products
- 13.1.10.3. Company Financials
- 13.1.10.4. SWOT Analysis
- 13.1.11 Christopher Cloos*List Not Exhaustive
- 13.1.11.1. Company Overview
- 13.1.11.2. Products
- 13.1.11.3. Company Financials
- 13.1.11.4. SWOT Analysis
- 13.1.1 Asics Pte Ltd
- 13.2. Market Entropy
- 13.2.1 Company's Key Areas Served
- 13.2.2 Recent Developments
- 13.3. Company Market Share Analysis 2025
- 13.3.1 Top 5 Companies Market Share Analysis
- 13.3.2 Top 3 Companies Market Share Analysis
- 13.4. List of Potential Customers
- 14. Research Methodology
List of Figures
- Figure 1: Global Squash Equipment Market Revenue Breakdown (billion, %) by Region 2025 & 2033
- Figure 2: Global Squash Equipment Market Volume Breakdown (K Units , %) by Region 2025 & 2033
- Figure 3: North America Squash Equipment Market Revenue (billion), by Product 2025 & 2033
- Figure 4: North America Squash Equipment Market Volume (K Units ), by Product 2025 & 2033
- Figure 5: North America Squash Equipment Market Revenue Share (%), by Product 2025 & 2033
- Figure 6: North America Squash Equipment Market Volume Share (%), by Product 2025 & 2033
- Figure 7: North America Squash Equipment Market Revenue (billion), by Sport 2025 & 2033
- Figure 8: North America Squash Equipment Market Volume (K Units ), by Sport 2025 & 2033
- Figure 9: North America Squash Equipment Market Revenue Share (%), by Sport 2025 & 2033
- Figure 10: North America Squash Equipment Market Volume Share (%), by Sport 2025 & 2033
- Figure 11: North America Squash Equipment Market Revenue (billion), by Distribution Channel 2025 & 2033
- Figure 12: North America Squash Equipment Market Volume (K Units ), by Distribution Channel 2025 & 2033
- Figure 13: North America Squash Equipment Market Revenue Share (%), by Distribution Channel 2025 & 2033
- Figure 14: North America Squash Equipment Market Volume Share (%), by Distribution Channel 2025 & 2033
- Figure 15: North America Squash Equipment Market Revenue (billion), by Country 2025 & 2033
- Figure 16: North America Squash Equipment Market Volume (K Units ), by Country 2025 & 2033
- Figure 17: North America Squash Equipment Market Revenue Share (%), by Country 2025 & 2033
- Figure 18: North America Squash Equipment Market Volume Share (%), by Country 2025 & 2033
- Figure 19: Europe Squash Equipment Market Revenue (billion), by Product 2025 & 2033
- Figure 20: Europe Squash Equipment Market Volume (K Units ), by Product 2025 & 2033
- Figure 21: Europe Squash Equipment Market Revenue Share (%), by Product 2025 & 2033
- Figure 22: Europe Squash Equipment Market Volume Share (%), by Product 2025 & 2033
- Figure 23: Europe Squash Equipment Market Revenue (billion), by Sport 2025 & 2033
- Figure 24: Europe Squash Equipment Market Volume (K Units ), by Sport 2025 & 2033
- Figure 25: Europe Squash Equipment Market Revenue Share (%), by Sport 2025 & 2033
- Figure 26: Europe Squash Equipment Market Volume Share (%), by Sport 2025 & 2033
- Figure 27: Europe Squash Equipment Market Revenue (billion), by Distribution Channel 2025 & 2033
- Figure 28: Europe Squash Equipment Market Volume (K Units ), by Distribution Channel 2025 & 2033
- Figure 29: Europe Squash Equipment Market Revenue Share (%), by Distribution Channel 2025 & 2033
- Figure 30: Europe Squash Equipment Market Volume Share (%), by Distribution Channel 2025 & 2033
- Figure 31: Europe Squash Equipment Market Revenue (billion), by Country 2025 & 2033
- Figure 32: Europe Squash Equipment Market Volume (K Units ), by Country 2025 & 2033
- Figure 33: Europe Squash Equipment Market Revenue Share (%), by Country 2025 & 2033
- Figure 34: Europe Squash Equipment Market Volume Share (%), by Country 2025 & 2033
- Figure 35: Asia Pacific Squash Equipment Market Revenue (billion), by Product 2025 & 2033
- Figure 36: Asia Pacific Squash Equipment Market Volume (K Units ), by Product 2025 & 2033
- Figure 37: Asia Pacific Squash Equipment Market Revenue Share (%), by Product 2025 & 2033
- Figure 38: Asia Pacific Squash Equipment Market Volume Share (%), by Product 2025 & 2033
- Figure 39: Asia Pacific Squash Equipment Market Revenue (billion), by Sport 2025 & 2033
- Figure 40: Asia Pacific Squash Equipment Market Volume (K Units ), by Sport 2025 & 2033
- Figure 41: Asia Pacific Squash Equipment Market Revenue Share (%), by Sport 2025 & 2033
- Figure 42: Asia Pacific Squash Equipment Market Volume Share (%), by Sport 2025 & 2033
- Figure 43: Asia Pacific Squash Equipment Market Revenue (billion), by Distribution Channel 2025 & 2033
- Figure 44: Asia Pacific Squash Equipment Market Volume (K Units ), by Distribution Channel 2025 & 2033
- Figure 45: Asia Pacific Squash Equipment Market Revenue Share (%), by Distribution Channel 2025 & 2033
- Figure 46: Asia Pacific Squash Equipment Market Volume Share (%), by Distribution Channel 2025 & 2033
- Figure 47: Asia Pacific Squash Equipment Market Revenue (billion), by Country 2025 & 2033
- Figure 48: Asia Pacific Squash Equipment Market Volume (K Units ), by Country 2025 & 2033
- Figure 49: Asia Pacific Squash Equipment Market Revenue Share (%), by Country 2025 & 2033
- Figure 50: Asia Pacific Squash Equipment Market Volume Share (%), by Country 2025 & 2033
- Figure 51: South America Squash Equipment Market Revenue (billion), by Product 2025 & 2033
- Figure 52: South America Squash Equipment Market Volume (K Units ), by Product 2025 & 2033
- Figure 53: South America Squash Equipment Market Revenue Share (%), by Product 2025 & 2033
- Figure 54: South America Squash Equipment Market Volume Share (%), by Product 2025 & 2033
- Figure 55: South America Squash Equipment Market Revenue (billion), by Sport 2025 & 2033
- Figure 56: South America Squash Equipment Market Volume (K Units ), by Sport 2025 & 2033
- Figure 57: South America Squash Equipment Market Revenue Share (%), by Sport 2025 & 2033
- Figure 58: South America Squash Equipment Market Volume Share (%), by Sport 2025 & 2033
- Figure 59: South America Squash Equipment Market Revenue (billion), by Distribution Channel 2025 & 2033
- Figure 60: South America Squash Equipment Market Volume (K Units ), by Distribution Channel 2025 & 2033
- Figure 61: South America Squash Equipment Market Revenue Share (%), by Distribution Channel 2025 & 2033
- Figure 62: South America Squash Equipment Market Volume Share (%), by Distribution Channel 2025 & 2033
- Figure 63: South America Squash Equipment Market Revenue (billion), by Country 2025 & 2033
- Figure 64: South America Squash Equipment Market Volume (K Units ), by Country 2025 & 2033
- Figure 65: South America Squash Equipment Market Revenue Share (%), by Country 2025 & 2033
- Figure 66: South America Squash Equipment Market Volume Share (%), by Country 2025 & 2033
- Figure 67: Middle East Squash Equipment Market Revenue (billion), by Product 2025 & 2033
- Figure 68: Middle East Squash Equipment Market Volume (K Units ), by Product 2025 & 2033
- Figure 69: Middle East Squash Equipment Market Revenue Share (%), by Product 2025 & 2033
- Figure 70: Middle East Squash Equipment Market Volume Share (%), by Product 2025 & 2033
- Figure 71: Middle East Squash Equipment Market Revenue (billion), by Sport 2025 & 2033
- Figure 72: Middle East Squash Equipment Market Volume (K Units ), by Sport 2025 & 2033
- Figure 73: Middle East Squash Equipment Market Revenue Share (%), by Sport 2025 & 2033
- Figure 74: Middle East Squash Equipment Market Volume Share (%), by Sport 2025 & 2033
- Figure 75: Middle East Squash Equipment Market Revenue (billion), by Distribution Channel 2025 & 2033
- Figure 76: Middle East Squash Equipment Market Volume (K Units ), by Distribution Channel 2025 & 2033
- Figure 77: Middle East Squash Equipment Market Revenue Share (%), by Distribution Channel 2025 & 2033
- Figure 78: Middle East Squash Equipment Market Volume Share (%), by Distribution Channel 2025 & 2033
- Figure 79: Middle East Squash Equipment Market Revenue (billion), by Country 2025 & 2033
- Figure 80: Middle East Squash Equipment Market Volume (K Units ), by Country 2025 & 2033
- Figure 81: Middle East Squash Equipment Market Revenue Share (%), by Country 2025 & 2033
- Figure 82: Middle East Squash Equipment Market Volume Share (%), by Country 2025 & 2033
- Figure 83: Saudi Arabia Squash Equipment Market Revenue (billion), by Product 2025 & 2033
- Figure 84: Saudi Arabia Squash Equipment Market Volume (K Units ), by Product 2025 & 2033
- Figure 85: Saudi Arabia Squash Equipment Market Revenue Share (%), by Product 2025 & 2033
- Figure 86: Saudi Arabia Squash Equipment Market Volume Share (%), by Product 2025 & 2033
- Figure 87: Saudi Arabia Squash Equipment Market Revenue (billion), by Sport 2025 & 2033
- Figure 88: Saudi Arabia Squash Equipment Market Volume (K Units ), by Sport 2025 & 2033
- Figure 89: Saudi Arabia Squash Equipment Market Revenue Share (%), by Sport 2025 & 2033
- Figure 90: Saudi Arabia Squash Equipment Market Volume Share (%), by Sport 2025 & 2033
- Figure 91: Saudi Arabia Squash Equipment Market Revenue (billion), by Distribution Channel 2025 & 2033
- Figure 92: Saudi Arabia Squash Equipment Market Volume (K Units ), by Distribution Channel 2025 & 2033
- Figure 93: Saudi Arabia Squash Equipment Market Revenue Share (%), by Distribution Channel 2025 & 2033
- Figure 94: Saudi Arabia Squash Equipment Market Volume Share (%), by Distribution Channel 2025 & 2033
- Figure 95: Saudi Arabia Squash Equipment Market Revenue (billion), by Country 2025 & 2033
- Figure 96: Saudi Arabia Squash Equipment Market Volume (K Units ), by Country 2025 & 2033
- Figure 97: Saudi Arabia Squash Equipment Market Revenue Share (%), by Country 2025 & 2033
- Figure 98: Saudi Arabia Squash Equipment Market Volume Share (%), by Country 2025 & 2033
List of Tables
- Table 1: Global Squash Equipment Market Revenue billion Forecast, by Product 2020 & 2033
- Table 2: Global Squash Equipment Market Volume K Units Forecast, by Product 2020 & 2033
- Table 3: Global Squash Equipment Market Revenue billion Forecast, by Sport 2020 & 2033
- Table 4: Global Squash Equipment Market Volume K Units Forecast, by Sport 2020 & 2033
- Table 5: Global Squash Equipment Market Revenue billion Forecast, by Distribution Channel 2020 & 2033
- Table 6: Global Squash Equipment Market Volume K Units Forecast, by Distribution Channel 2020 & 2033
- Table 7: Global Squash Equipment Market Revenue billion Forecast, by Region 2020 & 2033
- Table 8: Global Squash Equipment Market Volume K Units Forecast, by Region 2020 & 2033
- Table 9: Global Squash Equipment Market Revenue billion Forecast, by Product 2020 & 2033
- Table 10: Global Squash Equipment Market Volume K Units Forecast, by Product 2020 & 2033
- Table 11: Global Squash Equipment Market Revenue billion Forecast, by Sport 2020 & 2033
- Table 12: Global Squash Equipment Market Volume K Units Forecast, by Sport 2020 & 2033
- Table 13: Global Squash Equipment Market Revenue billion Forecast, by Distribution Channel 2020 & 2033
- Table 14: Global Squash Equipment Market Volume K Units Forecast, by Distribution Channel 2020 & 2033
- Table 15: Global Squash Equipment Market Revenue billion Forecast, by Country 2020 & 2033
- Table 16: Global Squash Equipment Market Volume K Units Forecast, by Country 2020 & 2033
- Table 17: United States Squash Equipment Market Revenue (billion) Forecast, by Application 2020 & 2033
- Table 18: United States Squash Equipment Market Volume (K Units ) Forecast, by Application 2020 & 2033
- Table 19: Canada Squash Equipment Market Revenue (billion) Forecast, by Application 2020 & 2033
- Table 20: Canada Squash Equipment Market Volume (K Units ) Forecast, by Application 2020 & 2033
- Table 21: Mexico Squash Equipment Market Revenue (billion) Forecast, by Application 2020 & 2033
- Table 22: Mexico Squash Equipment Market Volume (K Units ) Forecast, by Application 2020 & 2033
- Table 23: Rest of North America Squash Equipment Market Revenue (billion) Forecast, by Application 2020 & 2033
- Table 24: Rest of North America Squash Equipment Market Volume (K Units ) Forecast, by Application 2020 & 2033
- Table 25: Global Squash Equipment Market Revenue billion Forecast, by Product 2020 & 2033
- Table 26: Global Squash Equipment Market Volume K Units Forecast, by Product 2020 & 2033
- Table 27: Global Squash Equipment Market Revenue billion Forecast, by Sport 2020 & 2033
- Table 28: Global Squash Equipment Market Volume K Units Forecast, by Sport 2020 & 2033
- Table 29: Global Squash Equipment Market Revenue billion Forecast, by Distribution Channel 2020 & 2033
- Table 30: Global Squash Equipment Market Volume K Units Forecast, by Distribution Channel 2020 & 2033
- Table 31: Global Squash Equipment Market Revenue billion Forecast, by Country 2020 & 2033
- Table 32: Global Squash Equipment Market Volume K Units Forecast, by Country 2020 & 2033
- Table 33: United Kingdom Squash Equipment Market Revenue (billion) Forecast, by Application 2020 & 2033
- Table 34: United Kingdom Squash Equipment Market Volume (K Units ) Forecast, by Application 2020 & 2033
- Table 35: Gremany Squash Equipment Market Revenue (billion) Forecast, by Application 2020 & 2033
- Table 36: Gremany Squash Equipment Market Volume (K Units ) Forecast, by Application 2020 & 2033
- Table 37: France Squash Equipment Market Revenue (billion) Forecast, by Application 2020 & 2033
- Table 38: France Squash Equipment Market Volume (K Units ) Forecast, by Application 2020 & 2033
- Table 39: Spain Squash Equipment Market Revenue (billion) Forecast, by Application 2020 & 2033
- Table 40: Spain Squash Equipment Market Volume (K Units ) Forecast, by Application 2020 & 2033
- Table 41: Italy Squash Equipment Market Revenue (billion) Forecast, by Application 2020 & 2033
- Table 42: Italy Squash Equipment Market Volume (K Units ) Forecast, by Application 2020 & 2033
- Table 43: Russia Squash Equipment Market Revenue (billion) Forecast, by Application 2020 & 2033
- Table 44: Russia Squash Equipment Market Volume (K Units ) Forecast, by Application 2020 & 2033
- Table 45: Rest of Europe Squash Equipment Market Revenue (billion) Forecast, by Application 2020 & 2033
- Table 46: Rest of Europe Squash Equipment Market Volume (K Units ) Forecast, by Application 2020 & 2033
- Table 47: Global Squash Equipment Market Revenue billion Forecast, by Product 2020 & 2033
- Table 48: Global Squash Equipment Market Volume K Units Forecast, by Product 2020 & 2033
- Table 49: Global Squash Equipment Market Revenue billion Forecast, by Sport 2020 & 2033
- Table 50: Global Squash Equipment Market Volume K Units Forecast, by Sport 2020 & 2033
- Table 51: Global Squash Equipment Market Revenue billion Forecast, by Distribution Channel 2020 & 2033
- Table 52: Global Squash Equipment Market Volume K Units Forecast, by Distribution Channel 2020 & 2033
- Table 53: Global Squash Equipment Market Revenue billion Forecast, by Country 2020 & 2033
- Table 54: Global Squash Equipment Market Volume K Units Forecast, by Country 2020 & 2033
- Table 55: China Squash Equipment Market Revenue (billion) Forecast, by Application 2020 & 2033
- Table 56: China Squash Equipment Market Volume (K Units ) Forecast, by Application 2020 & 2033
- Table 57: Japan Squash Equipment Market Revenue (billion) Forecast, by Application 2020 & 2033
- Table 58: Japan Squash Equipment Market Volume (K Units ) Forecast, by Application 2020 & 2033
- Table 59: India Squash Equipment Market Revenue (billion) Forecast, by Application 2020 & 2033
- Table 60: India Squash Equipment Market Volume (K Units ) Forecast, by Application 2020 & 2033
- Table 61: Australia Squash Equipment Market Revenue (billion) Forecast, by Application 2020 & 2033
- Table 62: Australia Squash Equipment Market Volume (K Units ) Forecast, by Application 2020 & 2033
- Table 63: Rest of Asia Pacific Squash Equipment Market Revenue (billion) Forecast, by Application 2020 & 2033
- Table 64: Rest of Asia Pacific Squash Equipment Market Volume (K Units ) Forecast, by Application 2020 & 2033
- Table 65: Global Squash Equipment Market Revenue billion Forecast, by Product 2020 & 2033
- Table 66: Global Squash Equipment Market Volume K Units Forecast, by Product 2020 & 2033
- Table 67: Global Squash Equipment Market Revenue billion Forecast, by Sport 2020 & 2033
- Table 68: Global Squash Equipment Market Volume K Units Forecast, by Sport 2020 & 2033
- Table 69: Global Squash Equipment Market Revenue billion Forecast, by Distribution Channel 2020 & 2033
- Table 70: Global Squash Equipment Market Volume K Units Forecast, by Distribution Channel 2020 & 2033
- Table 71: Global Squash Equipment Market Revenue billion Forecast, by Country 2020 & 2033
- Table 72: Global Squash Equipment Market Volume K Units Forecast, by Country 2020 & 2033
- Table 73: Brazil Squash Equipment Market Revenue (billion) Forecast, by Application 2020 & 2033
- Table 74: Brazil Squash Equipment Market Volume (K Units ) Forecast, by Application 2020 & 2033
- Table 75: Argentina Squash Equipment Market Revenue (billion) Forecast, by Application 2020 & 2033
- Table 76: Argentina Squash Equipment Market Volume (K Units ) Forecast, by Application 2020 & 2033
- Table 77: Rest of South America Squash Equipment Market Revenue (billion) Forecast, by Application 2020 & 2033
- Table 78: Rest of South America Squash Equipment Market Volume (K Units ) Forecast, by Application 2020 & 2033
- Table 79: Global Squash Equipment Market Revenue billion Forecast, by Product 2020 & 2033
- Table 80: Global Squash Equipment Market Volume K Units Forecast, by Product 2020 & 2033
- Table 81: Global Squash Equipment Market Revenue billion Forecast, by Sport 2020 & 2033
- Table 82: Global Squash Equipment Market Volume K Units Forecast, by Sport 2020 & 2033
- Table 83: Global Squash Equipment Market Revenue billion Forecast, by Distribution Channel 2020 & 2033
- Table 84: Global Squash Equipment Market Volume K Units Forecast, by Distribution Channel 2020 & 2033
- Table 85: Global Squash Equipment Market Revenue billion Forecast, by Country 2020 & 2033
- Table 86: Global Squash Equipment Market Volume K Units Forecast, by Country 2020 & 2033
- Table 87: Global Squash Equipment Market Revenue billion Forecast, by Product 2020 & 2033
- Table 88: Global Squash Equipment Market Volume K Units Forecast, by Product 2020 & 2033
- Table 89: Global Squash Equipment Market Revenue billion Forecast, by Sport 2020 & 2033
- Table 90: Global Squash Equipment Market Volume K Units Forecast, by Sport 2020 & 2033
- Table 91: Global Squash Equipment Market Revenue billion Forecast, by Distribution Channel 2020 & 2033
- Table 92: Global Squash Equipment Market Volume K Units Forecast, by Distribution Channel 2020 & 2033
- Table 93: Global Squash Equipment Market Revenue billion Forecast, by Country 2020 & 2033
- Table 94: Global Squash Equipment Market Volume K Units Forecast, by Country 2020 & 2033
- Table 95: South Africa Squash Equipment Market Revenue (billion) Forecast, by Application 2020 & 2033
- Table 96: South Africa Squash Equipment Market Volume (K Units ) Forecast, by Application 2020 & 2033
- Table 97: Rest of the Middle East Squash Equipment Market Revenue (billion) Forecast, by Application 2020 & 2033
- Table 98: Rest of the Middle East Squash Equipment Market Volume (K Units ) Forecast, by Application 2020 & 2033
Frequently Asked Questions
1. What is the projected Compound Annual Growth Rate (CAGR) of the Squash Equipment Market?
The projected CAGR is approximately 14.77%.
2. Which companies are prominent players in the Squash Equipment Market?
Key companies in the market include Asics Pte Ltd, SRI Sports Limited, Yonex Co Ltd, Gamma Sports, Head N V, Li-Ning Company Limited, Tecnifibre, Amer Sports, Goode Sport, The Babolat, Christopher Cloos*List Not Exhaustive.
3. What are the main segments of the Squash Equipment Market?
The market segments include Product, Sport, Distribution Channel.
4. Can you provide details about the market size?
The market size is estimated to be USD 10.15 billion as of 2022.
5. What are some drivers contributing to market growth?
Aggressive Marketing and Strategic Investments by Key Players; Growing Prevalence of Smokeless Tobacco Supported By Growth in Production of Tobacco.
6. What are the notable trends driving market growth?
Increasing Participation of Tennis Sport.
7. Are there any restraints impacting market growth?
Stringent Government Regulations Leading to Ban on Smokeless Tobacco.
8. Can you provide examples of recent developments in the market?
December 2022: Yonex Co. Ltd. launched a new badminton racket series, Astrox Nextage. The Yonex Astrox Nextage is designed with a newly innovated frame that absorbs impact, providing a revolutionary hitting feel with controlled shots.
9. What pricing options are available for accessing the report?
Pricing options include single-user, multi-user, and enterprise licenses priced at USD 4750, USD 5250, and USD 8750 respectively.
10. Is the market size provided in terms of value or volume?
The market size is provided in terms of value, measured in billion and volume, measured in K Units .
11. Are there any specific market keywords associated with the report?
Yes, the market keyword associated with the report is "Squash Equipment Market," which aids in identifying and referencing the specific market segment covered.
12. How do I determine which pricing option suits my needs best?
The pricing options vary based on user requirements and access needs. Individual users may opt for single-user licenses, while businesses requiring broader access may choose multi-user or enterprise licenses for cost-effective access to the report.
13. Are there any additional resources or data provided in the Squash Equipment Market report?
While the report offers comprehensive insights, it's advisable to review the specific contents or supplementary materials provided to ascertain if additional resources or data are available.
14. How can I stay updated on further developments or reports in the Squash Equipment Market?
To stay informed about further developments, trends, and reports in the Squash Equipment Market, consider subscribing to industry newsletters, following relevant companies and organizations, or regularly checking reputable industry news sources and publications.
Methodology
Step 1 - Identification of Relevant Samples Size from Population Database


Step 2 - Approaches for Defining Global Market Size (Value, Volume* & Price*)

Note*: In applicable scenarios
Step 3 - Data Sources
Primary Research
- Web Analytics
- Survey Reports
- Research Institute
- Latest Research Reports
- Opinion Leaders
Secondary Research
- Annual Reports
- White Paper
- Latest Press Release
- Industry Association
- Paid Database
- Investor Presentations

Step 4 - Data Triangulation
Involves using different sources of information in order to increase the validity of a study
These sources are likely to be stakeholders in a program - participants, other researchers, program staff, other community members, and so on.
Then we put all data in single framework & apply various statistical tools to find out the dynamic on the market.
During the analysis stage, feedback from the stakeholder groups would be compared to determine areas of agreement as well as areas of divergence