
Key Insights
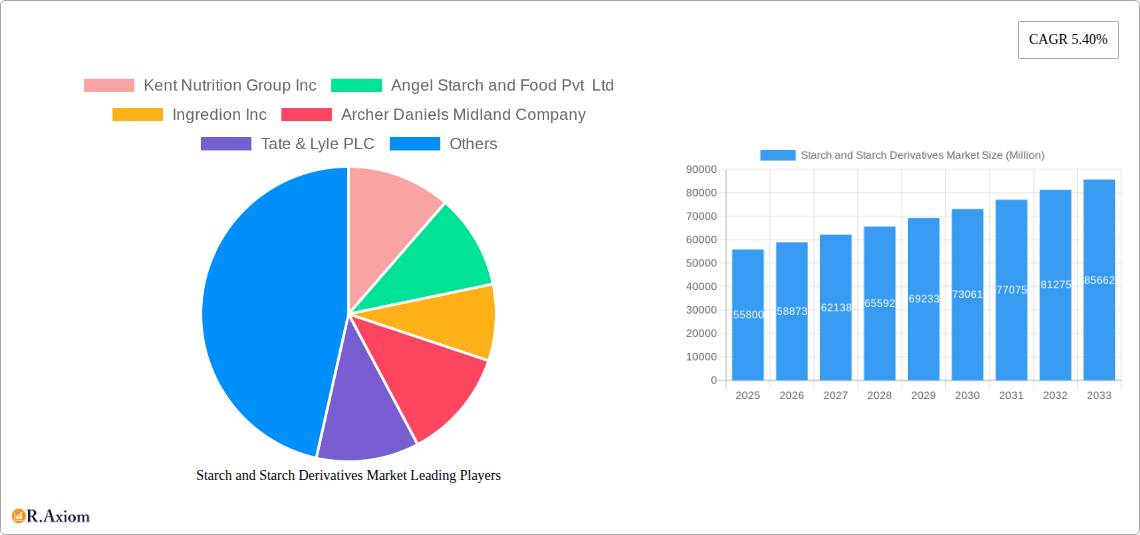
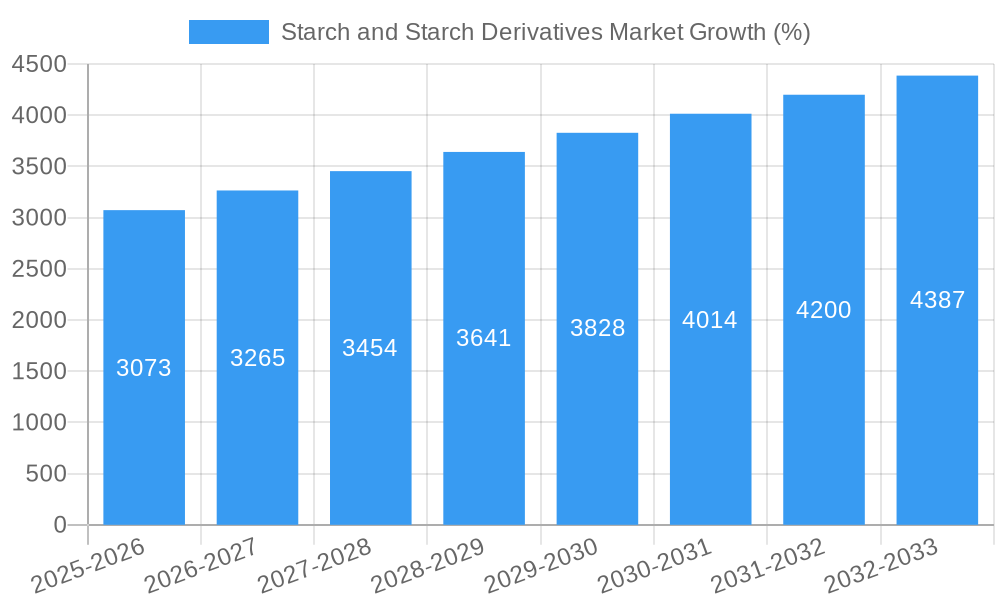
The global starch and starch derivatives market, valued at $55.8 billion in 2025, is projected to experience robust growth, driven by increasing demand across diverse sectors. The market's Compound Annual Growth Rate (CAGR) of 5.40% from 2025 to 2033 reflects the consistent expansion of applications in food and beverages (including sweeteners, thickeners, and stabilizers), pharmaceuticals (as excipients and binders), personal care (in cosmetics and toiletries), animal feed (as a binding agent and nutritional supplement), and paper and corrugating industries (for coatings and adhesives). Growth is further fueled by advancements in starch modification technologies, leading to the development of novel starches with tailored properties for specific applications. The rising global population and increasing disposable incomes in developing economies are key factors boosting consumption of starch-based products in food and beverages. Corn, being the most widely cultivated starch source, dominates the market, followed by wheat and potato. However, the increasing interest in sustainable and healthier alternatives is driving growth in the cassava and other sources segment. Potential challenges include fluctuating raw material prices and the growing awareness of the potential environmental impact of starch production, which may influence market trends in the coming years.
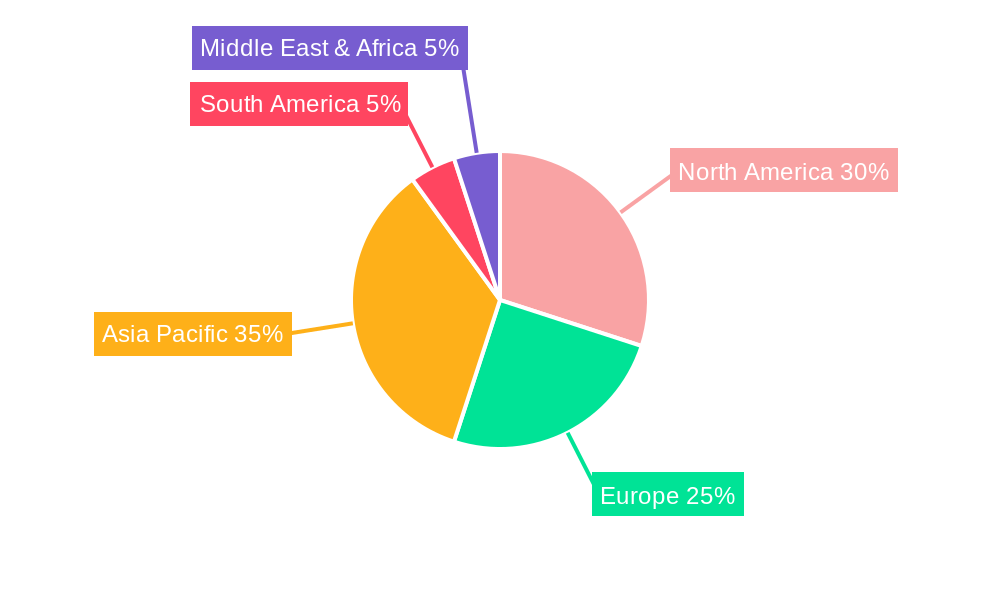
The North American region currently holds a significant market share, driven by the presence of major starch producers and a robust food and beverage industry. However, the Asia-Pacific region, particularly China and India, is poised for rapid growth due to the expanding population, industrialization, and increasing demand for processed foods. Europe continues to be a significant market, with established industries and a strong focus on food quality and safety. Competitive dynamics involve both large multinational corporations and regional players. Key players are focusing on strategic partnerships, acquisitions, and product innovation to gain market share. The continuous innovation in starch modification technologies and expanding applications across various industries will likely shape the future trajectory of this dynamic market, leading to further growth and diversification in the coming decade.
Starch and Starch Derivatives Market: A Comprehensive Report (2019-2033)
This detailed report provides a comprehensive analysis of the global Starch and Starch Derivatives market, offering invaluable insights for industry stakeholders, investors, and strategic decision-makers. The study period spans from 2019 to 2033, with 2025 serving as the base and estimated year. The report meticulously examines market dynamics, competitive landscapes, and future growth trajectories, providing actionable intelligence for informed business strategies.
Starch and Starch Derivatives Market Concentration & Innovation
This section delves into the competitive dynamics of the starch and starch derivatives market, analyzing market concentration, innovation drivers, regulatory frameworks, product substitutes, end-user trends, and mergers & acquisitions (M&A) activities. The market is moderately concentrated, with key players like Ingredion Inc. and Archer Daniels Midland Company holding significant market share. However, the presence of numerous regional and specialized players fosters a dynamic competitive landscape.
- Market Concentration: The top 5 players account for approximately xx% of the global market share in 2025. This indicates a moderately concentrated market with opportunities for both expansion and disruption.
- Innovation Drivers: Continuous R&D efforts focused on developing novel starch derivatives with enhanced functionalities (e.g., improved texture, stability, and digestibility) are driving market innovation. The demand for clean-label ingredients and sustainable sourcing practices also fuels innovation.
- Regulatory Frameworks: Stringent food safety regulations and labeling requirements influence product development and market access across different regions. Compliance costs and evolving regulations present challenges and opportunities for market players.
- Product Substitutes: Alternatives such as cellulose derivatives and synthetic polymers compete in specific applications. However, starch's biodegradability, cost-effectiveness, and versatility provide a competitive edge.
- End-User Trends: The growing demand for convenience foods, functional foods, and healthier alternatives is driving the growth of modified starch applications across food and beverage, pharmaceutical, and personal care sectors.
- M&A Activities: Consolidation through mergers and acquisitions is a recurring trend, with deal values exceeding xx Million in the past five years. These activities reflect the industry’s focus on expanding product portfolios and geographic reach.
Starch and Starch Derivatives Market Industry Trends & Insights
The global starch and starch derivatives market is witnessing robust growth, driven by increasing demand from diverse industries, particularly the food and beverage sector. The market is poised for significant expansion, with a projected CAGR of xx% during the forecast period (2025-2033). This growth is attributed to several factors:
- Rising Global Population: The growing global population and increasing disposable incomes are fueling demand for processed and convenience foods, thereby increasing the demand for starch and its derivatives.
- Technological Advancements: Innovations in starch modification technologies are enabling the development of novel products with customized functionalities, catering to specific application requirements. This includes improved texture, enhanced stability, and controlled digestibility.
- Health and Wellness Trends: The growing awareness regarding health and wellness has led to a surge in the demand for functional foods and dietary supplements. Starch-based ingredients are increasingly utilized in these products for their nutritional and functional properties.
- Sustainable Sourcing: The increasing focus on sustainability is driving the demand for starch derived from renewable and sustainable sources, promoting environmentally friendly production practices.
- Competitive Dynamics: The competitive landscape is dynamic, with both large multinational corporations and smaller specialized companies vying for market share. Strategic alliances, collaborations, and acquisitions play a pivotal role in shaping the market's competitive dynamics. Market penetration in emerging economies also presents significant growth opportunities.
Dominant Markets & Segments in Starch and Starch Derivatives Market
The food and beverage industry dominates the starch and starch derivatives market, followed by the pharmaceutical and personal care sectors. Geographically, Asia-Pacific accounts for the largest market share owing to its rapidly growing population and expanding food processing industry.
By Type: Modified starch holds a larger market share compared to native starch due to its versatile functionalities and increasing applications in various industries.
By Source: Corn starch dominates the market due to its widespread availability, cost-effectiveness, and suitability for various applications.
By Application:
- Food and Beverages: This segment accounts for the largest share, driven by the rising demand for processed foods and beverages. Key drivers include increasing consumption of convenience foods and bakery products.
- Pharmaceuticals: Starch derivatives find use as excipients in pharmaceutical formulations, contributing to the growth of this segment.
- Personal Care: Starch derivatives are used as thickeners, binders, and stabilizers in personal care products, contributing to segment growth.
- Animal Feed: Starch-based ingredients are increasingly used as binders and fillers in animal feed, contributing to moderate segment growth.
- Paper and Corrugating: The use of starch as a binder in paper and corrugating industries contributes to segment growth.
Key Drivers (Regional):
- Asia-Pacific: Rapid economic growth, expanding middle class, increasing urbanization, and favorable government policies support market expansion.
- North America: Established food processing industry, high per capita consumption of processed foods, and strong innovation in starch-based products contribute to market growth.
- Europe: Stringent regulations and high awareness regarding sustainability drive growth in specific niche segments.
Starch and Starch Derivatives Market Product Developments
Recent product innovations focus on developing specialized starches with enhanced properties such as improved texture, stability, digestibility, and functionality in specific applications. For instance, Roquette's pea starch LN 30 caters to the active nutrition market, while Ingredion's ULTRA-TEX 1311 modified potato starch is tailored for dairy desserts. These developments reflect a strong market trend towards functional and health-oriented ingredients.
Report Scope & Segmentation Analysis
This report comprehensively segments the starch and starch derivatives market by type (native starch, modified starch), source (corn, wheat, potato, cassava, other sources), and application (food and beverages, pharmaceuticals, personal care, animal feed, paper and corrugating, other applications). Each segment's market size, growth projections, and competitive dynamics are analyzed in detail. The report projects significant growth across all segments, with modified starch and corn-based starches demonstrating the strongest growth potential.
Key Drivers of Starch and Starch Derivatives Market Growth
Several factors drive the market's growth, including: the rising global population and increasing demand for processed foods; technological advancements leading to innovative starch derivatives; the growing preference for healthier and functional foods; increasing applications in various industries; and the shift towards sustainable sourcing and production.
Challenges in the Starch and Starch Derivatives Market Sector
The market faces challenges such as fluctuating raw material prices, stringent regulatory requirements, competition from substitute materials, and supply chain disruptions. These factors can impact production costs and market profitability.
Emerging Opportunities in Starch and Starch Derivatives Market
Emerging opportunities lie in the development of novel starch derivatives with enhanced functionality, catering to the growing demand for functional foods, bioplastics, and biodegradable materials. Expansion into emerging markets and leveraging sustainable sourcing practices represent further opportunities.
Leading Players in the Starch and Starch Derivatives Market Market
- Kent Nutrition Group Inc
- Angel Starch and Food Pvt Ltd
- Ingredion Inc
- Archer Daniels Midland Company
- Tate & Lyle PLC
- Roquette Frères
- Anora Group PLC
- Koninklijke DSM NV
- Japan Corn Strach Co Ltd
- BASF S
Key Developments in Starch and Starch Derivatives Market Industry
- March 2021: Ingredion EMEA launched ULTRA-TEX 1311 modified potato starch for dairy desserts in the US and Canada.
- November 2021: Roquette developed Roquette pea starch LN 30 for active nutrition applications.
- April 2022: Ingredion Inc. announced plans to build a new modified starch facility in China, doubling its capacity.
Strategic Outlook for Starch and Starch Derivatives Market Market
The starch and starch derivatives market exhibits strong growth potential, driven by consistent demand across diverse applications. Strategic initiatives focused on product innovation, sustainable sourcing, and market expansion will be critical for companies to capitalize on emerging opportunities and maintain a competitive edge. The market's future trajectory hinges on addressing challenges related to supply chain resilience and regulatory compliance while continuing to meet the evolving demands of consumers and various industries.
Starch and Starch Derivatives Market Segmentation
-
1. Type
- 1.1. Native Starch
- 1.2. Modified Starch
-
2. Source
- 2.1. Corn
- 2.2. Wheat
- 2.3. Potato
- 2.4. Cassava
- 2.5. Other Sources
-
3. Application
-
3.1. Food and Beverages
- 3.1.1. Confectionery
- 3.1.2. Bakery
- 3.1.3. Dairy
- 3.1.4. Other Food and Beverage Applications
- 3.2. Pharmaceuticals
- 3.3. Personal Care
- 3.4. Animal Feed
- 3.5. Paper and Corrugating
- 3.6. Other Applications
-
3.1. Food and Beverages
Starch and Starch Derivatives Market Segmentation By Geography
-
1. North America
- 1.1. United States
- 1.2. Canada
- 1.3. Mexico
- 1.4. Rest of North America
-
2. Europe
- 2.1. United Kingdom
- 2.2. Germany
- 2.3. Spain
- 2.4. France
- 2.5. Italy
- 2.6. Russia
- 2.7. Rest of Europe
-
3. Asia Pacific
- 3.1. China
- 3.2. Japan
- 3.3. India
- 3.4. Australia
- 3.5. Rest of Asia Pacific
-
4. South America
- 4.1. Brazil
- 4.2. Argentina
- 4.3. Rest of South America
- 5. Middle East
-
6. Saudi Arabia
- 6.1. South Africa
- 6.2. Rest of Middle East
Starch and Starch Derivatives Market REPORT HIGHLIGHTS
| Aspects | Details |
|---|---|
| Study Period | 2019-2033 |
| Base Year | 2024 |
| Estimated Year | 2025 |
| Forecast Period | 2025-2033 |
| Historical Period | 2019-2024 |
| Growth Rate | CAGR of 5.40% from 2019-2033 |
| Segmentation |
|
Table of Contents
- 1. Introduction
- 1.1. Research Scope
- 1.2. Market Segmentation
- 1.3. Research Methodology
- 1.4. Definitions and Assumptions
- 2. Executive Summary
- 2.1. Introduction
- 3. Market Dynamics
- 3.1. Introduction
- 3.2. Market Drivers
- 3.2.1. Increasing Demand For Convenience & Processed Food
- 3.3. Market Restrains
- 3.3.1. Increased Consumer Awareness On Side-Effects Of Chemical Additives
- 3.4. Market Trends
- 3.4.1. Growing Food Processing Sector Globally
- 4. Market Factor Analysis
- 4.1. Porters Five Forces
- 4.2. Supply/Value Chain
- 4.3. PESTEL analysis
- 4.4. Market Entropy
- 4.5. Patent/Trademark Analysis
- 5. Global Starch and Starch Derivatives Market Analysis, Insights and Forecast, 2019-2031
- 5.1. Market Analysis, Insights and Forecast - by Type
- 5.1.1. Native Starch
- 5.1.2. Modified Starch
- 5.2. Market Analysis, Insights and Forecast - by Source
- 5.2.1. Corn
- 5.2.2. Wheat
- 5.2.3. Potato
- 5.2.4. Cassava
- 5.2.5. Other Sources
- 5.3. Market Analysis, Insights and Forecast - by Application
- 5.3.1. Food and Beverages
- 5.3.1.1. Confectionery
- 5.3.1.2. Bakery
- 5.3.1.3. Dairy
- 5.3.1.4. Other Food and Beverage Applications
- 5.3.2. Pharmaceuticals
- 5.3.3. Personal Care
- 5.3.4. Animal Feed
- 5.3.5. Paper and Corrugating
- 5.3.6. Other Applications
- 5.3.1. Food and Beverages
- 5.4. Market Analysis, Insights and Forecast - by Region
- 5.4.1. North America
- 5.4.2. Europe
- 5.4.3. Asia Pacific
- 5.4.4. South America
- 5.4.5. Middle East
- 5.4.6. Saudi Arabia
- 5.1. Market Analysis, Insights and Forecast - by Type
- 6. North America Starch and Starch Derivatives Market Analysis, Insights and Forecast, 2019-2031
- 6.1. Market Analysis, Insights and Forecast - by Type
- 6.1.1. Native Starch
- 6.1.2. Modified Starch
- 6.2. Market Analysis, Insights and Forecast - by Source
- 6.2.1. Corn
- 6.2.2. Wheat
- 6.2.3. Potato
- 6.2.4. Cassava
- 6.2.5. Other Sources
- 6.3. Market Analysis, Insights and Forecast - by Application
- 6.3.1. Food and Beverages
- 6.3.1.1. Confectionery
- 6.3.1.2. Bakery
- 6.3.1.3. Dairy
- 6.3.1.4. Other Food and Beverage Applications
- 6.3.2. Pharmaceuticals
- 6.3.3. Personal Care
- 6.3.4. Animal Feed
- 6.3.5. Paper and Corrugating
- 6.3.6. Other Applications
- 6.3.1. Food and Beverages
- 6.1. Market Analysis, Insights and Forecast - by Type
- 7. Europe Starch and Starch Derivatives Market Analysis, Insights and Forecast, 2019-2031
- 7.1. Market Analysis, Insights and Forecast - by Type
- 7.1.1. Native Starch
- 7.1.2. Modified Starch
- 7.2. Market Analysis, Insights and Forecast - by Source
- 7.2.1. Corn
- 7.2.2. Wheat
- 7.2.3. Potato
- 7.2.4. Cassava
- 7.2.5. Other Sources
- 7.3. Market Analysis, Insights and Forecast - by Application
- 7.3.1. Food and Beverages
- 7.3.1.1. Confectionery
- 7.3.1.2. Bakery
- 7.3.1.3. Dairy
- 7.3.1.4. Other Food and Beverage Applications
- 7.3.2. Pharmaceuticals
- 7.3.3. Personal Care
- 7.3.4. Animal Feed
- 7.3.5. Paper and Corrugating
- 7.3.6. Other Applications
- 7.3.1. Food and Beverages
- 7.1. Market Analysis, Insights and Forecast - by Type
- 8. Asia Pacific Starch and Starch Derivatives Market Analysis, Insights and Forecast, 2019-2031
- 8.1. Market Analysis, Insights and Forecast - by Type
- 8.1.1. Native Starch
- 8.1.2. Modified Starch
- 8.2. Market Analysis, Insights and Forecast - by Source
- 8.2.1. Corn
- 8.2.2. Wheat
- 8.2.3. Potato
- 8.2.4. Cassava
- 8.2.5. Other Sources
- 8.3. Market Analysis, Insights and Forecast - by Application
- 8.3.1. Food and Beverages
- 8.3.1.1. Confectionery
- 8.3.1.2. Bakery
- 8.3.1.3. Dairy
- 8.3.1.4. Other Food and Beverage Applications
- 8.3.2. Pharmaceuticals
- 8.3.3. Personal Care
- 8.3.4. Animal Feed
- 8.3.5. Paper and Corrugating
- 8.3.6. Other Applications
- 8.3.1. Food and Beverages
- 8.1. Market Analysis, Insights and Forecast - by Type
- 9. South America Starch and Starch Derivatives Market Analysis, Insights and Forecast, 2019-2031
- 9.1. Market Analysis, Insights and Forecast - by Type
- 9.1.1. Native Starch
- 9.1.2. Modified Starch
- 9.2. Market Analysis, Insights and Forecast - by Source
- 9.2.1. Corn
- 9.2.2. Wheat
- 9.2.3. Potato
- 9.2.4. Cassava
- 9.2.5. Other Sources
- 9.3. Market Analysis, Insights and Forecast - by Application
- 9.3.1. Food and Beverages
- 9.3.1.1. Confectionery
- 9.3.1.2. Bakery
- 9.3.1.3. Dairy
- 9.3.1.4. Other Food and Beverage Applications
- 9.3.2. Pharmaceuticals
- 9.3.3. Personal Care
- 9.3.4. Animal Feed
- 9.3.5. Paper and Corrugating
- 9.3.6. Other Applications
- 9.3.1. Food and Beverages
- 9.1. Market Analysis, Insights and Forecast - by Type
- 10. Middle East Starch and Starch Derivatives Market Analysis, Insights and Forecast, 2019-2031
- 10.1. Market Analysis, Insights and Forecast - by Type
- 10.1.1. Native Starch
- 10.1.2. Modified Starch
- 10.2. Market Analysis, Insights and Forecast - by Source
- 10.2.1. Corn
- 10.2.2. Wheat
- 10.2.3. Potato
- 10.2.4. Cassava
- 10.2.5. Other Sources
- 10.3. Market Analysis, Insights and Forecast - by Application
- 10.3.1. Food and Beverages
- 10.3.1.1. Confectionery
- 10.3.1.2. Bakery
- 10.3.1.3. Dairy
- 10.3.1.4. Other Food and Beverage Applications
- 10.3.2. Pharmaceuticals
- 10.3.3. Personal Care
- 10.3.4. Animal Feed
- 10.3.5. Paper and Corrugating
- 10.3.6. Other Applications
- 10.3.1. Food and Beverages
- 10.1. Market Analysis, Insights and Forecast - by Type
- 11. Saudi Arabia Starch and Starch Derivatives Market Analysis, Insights and Forecast, 2019-2031
- 11.1. Market Analysis, Insights and Forecast - by Type
- 11.1.1. Native Starch
- 11.1.2. Modified Starch
- 11.2. Market Analysis, Insights and Forecast - by Source
- 11.2.1. Corn
- 11.2.2. Wheat
- 11.2.3. Potato
- 11.2.4. Cassava
- 11.2.5. Other Sources
- 11.3. Market Analysis, Insights and Forecast - by Application
- 11.3.1. Food and Beverages
- 11.3.1.1. Confectionery
- 11.3.1.2. Bakery
- 11.3.1.3. Dairy
- 11.3.1.4. Other Food and Beverage Applications
- 11.3.2. Pharmaceuticals
- 11.3.3. Personal Care
- 11.3.4. Animal Feed
- 11.3.5. Paper and Corrugating
- 11.3.6. Other Applications
- 11.3.1. Food and Beverages
- 11.1. Market Analysis, Insights and Forecast - by Type
- 12. North America Starch and Starch Derivatives Market Analysis, Insights and Forecast, 2019-2031
- 12.1. Market Analysis, Insights and Forecast - By Country/Sub-region
- 12.1.1 United States
- 12.1.2 Canada
- 12.1.3 Mexico
- 12.1.4 Rest of North America
- 13. Europe Starch and Starch Derivatives Market Analysis, Insights and Forecast, 2019-2031
- 13.1. Market Analysis, Insights and Forecast - By Country/Sub-region
- 13.1.1 United Kingdom
- 13.1.2 Germany
- 13.1.3 Spain
- 13.1.4 France
- 13.1.5 Italy
- 13.1.6 Russia
- 13.1.7 Rest of Europe
- 14. Asia Pacific Starch and Starch Derivatives Market Analysis, Insights and Forecast, 2019-2031
- 14.1. Market Analysis, Insights and Forecast - By Country/Sub-region
- 14.1.1 China
- 14.1.2 Japan
- 14.1.3 India
- 14.1.4 Australia
- 14.1.5 Rest of Asia Pacific
- 15. South America Starch and Starch Derivatives Market Analysis, Insights and Forecast, 2019-2031
- 15.1. Market Analysis, Insights and Forecast - By Country/Sub-region
- 15.1.1 Brazil
- 15.1.2 Argentina
- 15.1.3 Rest of South America
- 16. Middle East Starch and Starch Derivatives Market Analysis, Insights and Forecast, 2019-2031
- 16.1. Market Analysis, Insights and Forecast - By Country/Sub-region
- 16.1.1.
- 17. Saudi Arabia Starch and Starch Derivatives Market Analysis, Insights and Forecast, 2019-2031
- 17.1. Market Analysis, Insights and Forecast - By Country/Sub-region
- 17.1.1 South Africa
- 17.1.2 Rest of Middle East
- 18. Competitive Analysis
- 18.1. Global Market Share Analysis 2024
- 18.2. Company Profiles
- 18.2.1 Kent Nutrition Group Inc
- 18.2.1.1. Overview
- 18.2.1.2. Products
- 18.2.1.3. SWOT Analysis
- 18.2.1.4. Recent Developments
- 18.2.1.5. Financials (Based on Availability)
- 18.2.2 Angel Starch and Food Pvt Ltd
- 18.2.2.1. Overview
- 18.2.2.2. Products
- 18.2.2.3. SWOT Analysis
- 18.2.2.4. Recent Developments
- 18.2.2.5. Financials (Based on Availability)
- 18.2.3 Ingredion Inc
- 18.2.3.1. Overview
- 18.2.3.2. Products
- 18.2.3.3. SWOT Analysis
- 18.2.3.4. Recent Developments
- 18.2.3.5. Financials (Based on Availability)
- 18.2.4 Archer Daniels Midland Company
- 18.2.4.1. Overview
- 18.2.4.2. Products
- 18.2.4.3. SWOT Analysis
- 18.2.4.4. Recent Developments
- 18.2.4.5. Financials (Based on Availability)
- 18.2.5 Tate & Lyle PLC
- 18.2.5.1. Overview
- 18.2.5.2. Products
- 18.2.5.3. SWOT Analysis
- 18.2.5.4. Recent Developments
- 18.2.5.5. Financials (Based on Availability)
- 18.2.6 Roquette Frères
- 18.2.6.1. Overview
- 18.2.6.2. Products
- 18.2.6.3. SWOT Analysis
- 18.2.6.4. Recent Developments
- 18.2.6.5. Financials (Based on Availability)
- 18.2.7 Anora Group PLC
- 18.2.7.1. Overview
- 18.2.7.2. Products
- 18.2.7.3. SWOT Analysis
- 18.2.7.4. Recent Developments
- 18.2.7.5. Financials (Based on Availability)
- 18.2.8 Koninklijke DSM NV
- 18.2.8.1. Overview
- 18.2.8.2. Products
- 18.2.8.3. SWOT Analysis
- 18.2.8.4. Recent Developments
- 18.2.8.5. Financials (Based on Availability)
- 18.2.9 Japan Corn Strach Co Ltd
- 18.2.9.1. Overview
- 18.2.9.2. Products
- 18.2.9.3. SWOT Analysis
- 18.2.9.4. Recent Developments
- 18.2.9.5. Financials (Based on Availability)
- 18.2.10 BASF S
- 18.2.10.1. Overview
- 18.2.10.2. Products
- 18.2.10.3. SWOT Analysis
- 18.2.10.4. Recent Developments
- 18.2.10.5. Financials (Based on Availability)
- 18.2.1 Kent Nutrition Group Inc
List of Figures
- Figure 1: Global Starch and Starch Derivatives Market Revenue Breakdown (Million, %) by Region 2024 & 2032
- Figure 2: Global Starch and Starch Derivatives Market Volume Breakdown (K Tons, %) by Region 2024 & 2032
- Figure 3: North America Starch and Starch Derivatives Market Revenue (Million), by Country 2024 & 2032
- Figure 4: North America Starch and Starch Derivatives Market Volume (K Tons), by Country 2024 & 2032
- Figure 5: North America Starch and Starch Derivatives Market Revenue Share (%), by Country 2024 & 2032
- Figure 6: North America Starch and Starch Derivatives Market Volume Share (%), by Country 2024 & 2032
- Figure 7: Europe Starch and Starch Derivatives Market Revenue (Million), by Country 2024 & 2032
- Figure 8: Europe Starch and Starch Derivatives Market Volume (K Tons), by Country 2024 & 2032
- Figure 9: Europe Starch and Starch Derivatives Market Revenue Share (%), by Country 2024 & 2032
- Figure 10: Europe Starch and Starch Derivatives Market Volume Share (%), by Country 2024 & 2032
- Figure 11: Asia Pacific Starch and Starch Derivatives Market Revenue (Million), by Country 2024 & 2032
- Figure 12: Asia Pacific Starch and Starch Derivatives Market Volume (K Tons), by Country 2024 & 2032
- Figure 13: Asia Pacific Starch and Starch Derivatives Market Revenue Share (%), by Country 2024 & 2032
- Figure 14: Asia Pacific Starch and Starch Derivatives Market Volume Share (%), by Country 2024 & 2032
- Figure 15: South America Starch and Starch Derivatives Market Revenue (Million), by Country 2024 & 2032
- Figure 16: South America Starch and Starch Derivatives Market Volume (K Tons), by Country 2024 & 2032
- Figure 17: South America Starch and Starch Derivatives Market Revenue Share (%), by Country 2024 & 2032
- Figure 18: South America Starch and Starch Derivatives Market Volume Share (%), by Country 2024 & 2032
- Figure 19: Middle East Starch and Starch Derivatives Market Revenue (Million), by Country 2024 & 2032
- Figure 20: Middle East Starch and Starch Derivatives Market Volume (K Tons), by Country 2024 & 2032
- Figure 21: Middle East Starch and Starch Derivatives Market Revenue Share (%), by Country 2024 & 2032
- Figure 22: Middle East Starch and Starch Derivatives Market Volume Share (%), by Country 2024 & 2032
- Figure 23: Saudi Arabia Starch and Starch Derivatives Market Revenue (Million), by Country 2024 & 2032
- Figure 24: Saudi Arabia Starch and Starch Derivatives Market Volume (K Tons), by Country 2024 & 2032
- Figure 25: Saudi Arabia Starch and Starch Derivatives Market Revenue Share (%), by Country 2024 & 2032
- Figure 26: Saudi Arabia Starch and Starch Derivatives Market Volume Share (%), by Country 2024 & 2032
- Figure 27: North America Starch and Starch Derivatives Market Revenue (Million), by Type 2024 & 2032
- Figure 28: North America Starch and Starch Derivatives Market Volume (K Tons), by Type 2024 & 2032
- Figure 29: North America Starch and Starch Derivatives Market Revenue Share (%), by Type 2024 & 2032
- Figure 30: North America Starch and Starch Derivatives Market Volume Share (%), by Type 2024 & 2032
- Figure 31: North America Starch and Starch Derivatives Market Revenue (Million), by Source 2024 & 2032
- Figure 32: North America Starch and Starch Derivatives Market Volume (K Tons), by Source 2024 & 2032
- Figure 33: North America Starch and Starch Derivatives Market Revenue Share (%), by Source 2024 & 2032
- Figure 34: North America Starch and Starch Derivatives Market Volume Share (%), by Source 2024 & 2032
- Figure 35: North America Starch and Starch Derivatives Market Revenue (Million), by Application 2024 & 2032
- Figure 36: North America Starch and Starch Derivatives Market Volume (K Tons), by Application 2024 & 2032
- Figure 37: North America Starch and Starch Derivatives Market Revenue Share (%), by Application 2024 & 2032
- Figure 38: North America Starch and Starch Derivatives Market Volume Share (%), by Application 2024 & 2032
- Figure 39: North America Starch and Starch Derivatives Market Revenue (Million), by Country 2024 & 2032
- Figure 40: North America Starch and Starch Derivatives Market Volume (K Tons), by Country 2024 & 2032
- Figure 41: North America Starch and Starch Derivatives Market Revenue Share (%), by Country 2024 & 2032
- Figure 42: North America Starch and Starch Derivatives Market Volume Share (%), by Country 2024 & 2032
- Figure 43: Europe Starch and Starch Derivatives Market Revenue (Million), by Type 2024 & 2032
- Figure 44: Europe Starch and Starch Derivatives Market Volume (K Tons), by Type 2024 & 2032
- Figure 45: Europe Starch and Starch Derivatives Market Revenue Share (%), by Type 2024 & 2032
- Figure 46: Europe Starch and Starch Derivatives Market Volume Share (%), by Type 2024 & 2032
- Figure 47: Europe Starch and Starch Derivatives Market Revenue (Million), by Source 2024 & 2032
- Figure 48: Europe Starch and Starch Derivatives Market Volume (K Tons), by Source 2024 & 2032
- Figure 49: Europe Starch and Starch Derivatives Market Revenue Share (%), by Source 2024 & 2032
- Figure 50: Europe Starch and Starch Derivatives Market Volume Share (%), by Source 2024 & 2032
- Figure 51: Europe Starch and Starch Derivatives Market Revenue (Million), by Application 2024 & 2032
- Figure 52: Europe Starch and Starch Derivatives Market Volume (K Tons), by Application 2024 & 2032
- Figure 53: Europe Starch and Starch Derivatives Market Revenue Share (%), by Application 2024 & 2032
- Figure 54: Europe Starch and Starch Derivatives Market Volume Share (%), by Application 2024 & 2032
- Figure 55: Europe Starch and Starch Derivatives Market Revenue (Million), by Country 2024 & 2032
- Figure 56: Europe Starch and Starch Derivatives Market Volume (K Tons), by Country 2024 & 2032
- Figure 57: Europe Starch and Starch Derivatives Market Revenue Share (%), by Country 2024 & 2032
- Figure 58: Europe Starch and Starch Derivatives Market Volume Share (%), by Country 2024 & 2032
- Figure 59: Asia Pacific Starch and Starch Derivatives Market Revenue (Million), by Type 2024 & 2032
- Figure 60: Asia Pacific Starch and Starch Derivatives Market Volume (K Tons), by Type 2024 & 2032
- Figure 61: Asia Pacific Starch and Starch Derivatives Market Revenue Share (%), by Type 2024 & 2032
- Figure 62: Asia Pacific Starch and Starch Derivatives Market Volume Share (%), by Type 2024 & 2032
- Figure 63: Asia Pacific Starch and Starch Derivatives Market Revenue (Million), by Source 2024 & 2032
- Figure 64: Asia Pacific Starch and Starch Derivatives Market Volume (K Tons), by Source 2024 & 2032
- Figure 65: Asia Pacific Starch and Starch Derivatives Market Revenue Share (%), by Source 2024 & 2032
- Figure 66: Asia Pacific Starch and Starch Derivatives Market Volume Share (%), by Source 2024 & 2032
- Figure 67: Asia Pacific Starch and Starch Derivatives Market Revenue (Million), by Application 2024 & 2032
- Figure 68: Asia Pacific Starch and Starch Derivatives Market Volume (K Tons), by Application 2024 & 2032
- Figure 69: Asia Pacific Starch and Starch Derivatives Market Revenue Share (%), by Application 2024 & 2032
- Figure 70: Asia Pacific Starch and Starch Derivatives Market Volume Share (%), by Application 2024 & 2032
- Figure 71: Asia Pacific Starch and Starch Derivatives Market Revenue (Million), by Country 2024 & 2032
- Figure 72: Asia Pacific Starch and Starch Derivatives Market Volume (K Tons), by Country 2024 & 2032
- Figure 73: Asia Pacific Starch and Starch Derivatives Market Revenue Share (%), by Country 2024 & 2032
- Figure 74: Asia Pacific Starch and Starch Derivatives Market Volume Share (%), by Country 2024 & 2032
- Figure 75: South America Starch and Starch Derivatives Market Revenue (Million), by Type 2024 & 2032
- Figure 76: South America Starch and Starch Derivatives Market Volume (K Tons), by Type 2024 & 2032
- Figure 77: South America Starch and Starch Derivatives Market Revenue Share (%), by Type 2024 & 2032
- Figure 78: South America Starch and Starch Derivatives Market Volume Share (%), by Type 2024 & 2032
- Figure 79: South America Starch and Starch Derivatives Market Revenue (Million), by Source 2024 & 2032
- Figure 80: South America Starch and Starch Derivatives Market Volume (K Tons), by Source 2024 & 2032
- Figure 81: South America Starch and Starch Derivatives Market Revenue Share (%), by Source 2024 & 2032
- Figure 82: South America Starch and Starch Derivatives Market Volume Share (%), by Source 2024 & 2032
- Figure 83: South America Starch and Starch Derivatives Market Revenue (Million), by Application 2024 & 2032
- Figure 84: South America Starch and Starch Derivatives Market Volume (K Tons), by Application 2024 & 2032
- Figure 85: South America Starch and Starch Derivatives Market Revenue Share (%), by Application 2024 & 2032
- Figure 86: South America Starch and Starch Derivatives Market Volume Share (%), by Application 2024 & 2032
- Figure 87: South America Starch and Starch Derivatives Market Revenue (Million), by Country 2024 & 2032
- Figure 88: South America Starch and Starch Derivatives Market Volume (K Tons), by Country 2024 & 2032
- Figure 89: South America Starch and Starch Derivatives Market Revenue Share (%), by Country 2024 & 2032
- Figure 90: South America Starch and Starch Derivatives Market Volume Share (%), by Country 2024 & 2032
- Figure 91: Middle East Starch and Starch Derivatives Market Revenue (Million), by Type 2024 & 2032
- Figure 92: Middle East Starch and Starch Derivatives Market Volume (K Tons), by Type 2024 & 2032
- Figure 93: Middle East Starch and Starch Derivatives Market Revenue Share (%), by Type 2024 & 2032
- Figure 94: Middle East Starch and Starch Derivatives Market Volume Share (%), by Type 2024 & 2032
- Figure 95: Middle East Starch and Starch Derivatives Market Revenue (Million), by Source 2024 & 2032
- Figure 96: Middle East Starch and Starch Derivatives Market Volume (K Tons), by Source 2024 & 2032
- Figure 97: Middle East Starch and Starch Derivatives Market Revenue Share (%), by Source 2024 & 2032
- Figure 98: Middle East Starch and Starch Derivatives Market Volume Share (%), by Source 2024 & 2032
- Figure 99: Middle East Starch and Starch Derivatives Market Revenue (Million), by Application 2024 & 2032
- Figure 100: Middle East Starch and Starch Derivatives Market Volume (K Tons), by Application 2024 & 2032
- Figure 101: Middle East Starch and Starch Derivatives Market Revenue Share (%), by Application 2024 & 2032
- Figure 102: Middle East Starch and Starch Derivatives Market Volume Share (%), by Application 2024 & 2032
- Figure 103: Middle East Starch and Starch Derivatives Market Revenue (Million), by Country 2024 & 2032
- Figure 104: Middle East Starch and Starch Derivatives Market Volume (K Tons), by Country 2024 & 2032
- Figure 105: Middle East Starch and Starch Derivatives Market Revenue Share (%), by Country 2024 & 2032
- Figure 106: Middle East Starch and Starch Derivatives Market Volume Share (%), by Country 2024 & 2032
- Figure 107: Saudi Arabia Starch and Starch Derivatives Market Revenue (Million), by Type 2024 & 2032
- Figure 108: Saudi Arabia Starch and Starch Derivatives Market Volume (K Tons), by Type 2024 & 2032
- Figure 109: Saudi Arabia Starch and Starch Derivatives Market Revenue Share (%), by Type 2024 & 2032
- Figure 110: Saudi Arabia Starch and Starch Derivatives Market Volume Share (%), by Type 2024 & 2032
- Figure 111: Saudi Arabia Starch and Starch Derivatives Market Revenue (Million), by Source 2024 & 2032
- Figure 112: Saudi Arabia Starch and Starch Derivatives Market Volume (K Tons), by Source 2024 & 2032
- Figure 113: Saudi Arabia Starch and Starch Derivatives Market Revenue Share (%), by Source 2024 & 2032
- Figure 114: Saudi Arabia Starch and Starch Derivatives Market Volume Share (%), by Source 2024 & 2032
- Figure 115: Saudi Arabia Starch and Starch Derivatives Market Revenue (Million), by Application 2024 & 2032
- Figure 116: Saudi Arabia Starch and Starch Derivatives Market Volume (K Tons), by Application 2024 & 2032
- Figure 117: Saudi Arabia Starch and Starch Derivatives Market Revenue Share (%), by Application 2024 & 2032
- Figure 118: Saudi Arabia Starch and Starch Derivatives Market Volume Share (%), by Application 2024 & 2032
- Figure 119: Saudi Arabia Starch and Starch Derivatives Market Revenue (Million), by Country 2024 & 2032
- Figure 120: Saudi Arabia Starch and Starch Derivatives Market Volume (K Tons), by Country 2024 & 2032
- Figure 121: Saudi Arabia Starch and Starch Derivatives Market Revenue Share (%), by Country 2024 & 2032
- Figure 122: Saudi Arabia Starch and Starch Derivatives Market Volume Share (%), by Country 2024 & 2032
List of Tables
- Table 1: Global Starch and Starch Derivatives Market Revenue Million Forecast, by Region 2019 & 2032
- Table 2: Global Starch and Starch Derivatives Market Volume K Tons Forecast, by Region 2019 & 2032
- Table 3: Global Starch and Starch Derivatives Market Revenue Million Forecast, by Type 2019 & 2032
- Table 4: Global Starch and Starch Derivatives Market Volume K Tons Forecast, by Type 2019 & 2032
- Table 5: Global Starch and Starch Derivatives Market Revenue Million Forecast, by Source 2019 & 2032
- Table 6: Global Starch and Starch Derivatives Market Volume K Tons Forecast, by Source 2019 & 2032
- Table 7: Global Starch and Starch Derivatives Market Revenue Million Forecast, by Application 2019 & 2032
- Table 8: Global Starch and Starch Derivatives Market Volume K Tons Forecast, by Application 2019 & 2032
- Table 9: Global Starch and Starch Derivatives Market Revenue Million Forecast, by Region 2019 & 2032
- Table 10: Global Starch and Starch Derivatives Market Volume K Tons Forecast, by Region 2019 & 2032
- Table 11: Global Starch and Starch Derivatives Market Revenue Million Forecast, by Country 2019 & 2032
- Table 12: Global Starch and Starch Derivatives Market Volume K Tons Forecast, by Country 2019 & 2032
- Table 13: United States Starch and Starch Derivatives Market Revenue (Million) Forecast, by Application 2019 & 2032
- Table 14: United States Starch and Starch Derivatives Market Volume (K Tons) Forecast, by Application 2019 & 2032
- Table 15: Canada Starch and Starch Derivatives Market Revenue (Million) Forecast, by Application 2019 & 2032
- Table 16: Canada Starch and Starch Derivatives Market Volume (K Tons) Forecast, by Application 2019 & 2032
- Table 17: Mexico Starch and Starch Derivatives Market Revenue (Million) Forecast, by Application 2019 & 2032
- Table 18: Mexico Starch and Starch Derivatives Market Volume (K Tons) Forecast, by Application 2019 & 2032
- Table 19: Rest of North America Starch and Starch Derivatives Market Revenue (Million) Forecast, by Application 2019 & 2032
- Table 20: Rest of North America Starch and Starch Derivatives Market Volume (K Tons) Forecast, by Application 2019 & 2032
- Table 21: Global Starch and Starch Derivatives Market Revenue Million Forecast, by Country 2019 & 2032
- Table 22: Global Starch and Starch Derivatives Market Volume K Tons Forecast, by Country 2019 & 2032
- Table 23: United Kingdom Starch and Starch Derivatives Market Revenue (Million) Forecast, by Application 2019 & 2032
- Table 24: United Kingdom Starch and Starch Derivatives Market Volume (K Tons) Forecast, by Application 2019 & 2032
- Table 25: Germany Starch and Starch Derivatives Market Revenue (Million) Forecast, by Application 2019 & 2032
- Table 26: Germany Starch and Starch Derivatives Market Volume (K Tons) Forecast, by Application 2019 & 2032
- Table 27: Spain Starch and Starch Derivatives Market Revenue (Million) Forecast, by Application 2019 & 2032
- Table 28: Spain Starch and Starch Derivatives Market Volume (K Tons) Forecast, by Application 2019 & 2032
- Table 29: France Starch and Starch Derivatives Market Revenue (Million) Forecast, by Application 2019 & 2032
- Table 30: France Starch and Starch Derivatives Market Volume (K Tons) Forecast, by Application 2019 & 2032
- Table 31: Italy Starch and Starch Derivatives Market Revenue (Million) Forecast, by Application 2019 & 2032
- Table 32: Italy Starch and Starch Derivatives Market Volume (K Tons) Forecast, by Application 2019 & 2032
- Table 33: Russia Starch and Starch Derivatives Market Revenue (Million) Forecast, by Application 2019 & 2032
- Table 34: Russia Starch and Starch Derivatives Market Volume (K Tons) Forecast, by Application 2019 & 2032
- Table 35: Rest of Europe Starch and Starch Derivatives Market Revenue (Million) Forecast, by Application 2019 & 2032
- Table 36: Rest of Europe Starch and Starch Derivatives Market Volume (K Tons) Forecast, by Application 2019 & 2032
- Table 37: Global Starch and Starch Derivatives Market Revenue Million Forecast, by Country 2019 & 2032
- Table 38: Global Starch and Starch Derivatives Market Volume K Tons Forecast, by Country 2019 & 2032
- Table 39: China Starch and Starch Derivatives Market Revenue (Million) Forecast, by Application 2019 & 2032
- Table 40: China Starch and Starch Derivatives Market Volume (K Tons) Forecast, by Application 2019 & 2032
- Table 41: Japan Starch and Starch Derivatives Market Revenue (Million) Forecast, by Application 2019 & 2032
- Table 42: Japan Starch and Starch Derivatives Market Volume (K Tons) Forecast, by Application 2019 & 2032
- Table 43: India Starch and Starch Derivatives Market Revenue (Million) Forecast, by Application 2019 & 2032
- Table 44: India Starch and Starch Derivatives Market Volume (K Tons) Forecast, by Application 2019 & 2032
- Table 45: Australia Starch and Starch Derivatives Market Revenue (Million) Forecast, by Application 2019 & 2032
- Table 46: Australia Starch and Starch Derivatives Market Volume (K Tons) Forecast, by Application 2019 & 2032
- Table 47: Rest of Asia Pacific Starch and Starch Derivatives Market Revenue (Million) Forecast, by Application 2019 & 2032
- Table 48: Rest of Asia Pacific Starch and Starch Derivatives Market Volume (K Tons) Forecast, by Application 2019 & 2032
- Table 49: Global Starch and Starch Derivatives Market Revenue Million Forecast, by Country 2019 & 2032
- Table 50: Global Starch and Starch Derivatives Market Volume K Tons Forecast, by Country 2019 & 2032
- Table 51: Brazil Starch and Starch Derivatives Market Revenue (Million) Forecast, by Application 2019 & 2032
- Table 52: Brazil Starch and Starch Derivatives Market Volume (K Tons) Forecast, by Application 2019 & 2032
- Table 53: Argentina Starch and Starch Derivatives Market Revenue (Million) Forecast, by Application 2019 & 2032
- Table 54: Argentina Starch and Starch Derivatives Market Volume (K Tons) Forecast, by Application 2019 & 2032
- Table 55: Rest of South America Starch and Starch Derivatives Market Revenue (Million) Forecast, by Application 2019 & 2032
- Table 56: Rest of South America Starch and Starch Derivatives Market Volume (K Tons) Forecast, by Application 2019 & 2032
- Table 57: Global Starch and Starch Derivatives Market Revenue Million Forecast, by Country 2019 & 2032
- Table 58: Global Starch and Starch Derivatives Market Volume K Tons Forecast, by Country 2019 & 2032
- Table 59: Starch and Starch Derivatives Market Revenue (Million) Forecast, by Application 2019 & 2032
- Table 60: Starch and Starch Derivatives Market Volume (K Tons) Forecast, by Application 2019 & 2032
- Table 61: Global Starch and Starch Derivatives Market Revenue Million Forecast, by Country 2019 & 2032
- Table 62: Global Starch and Starch Derivatives Market Volume K Tons Forecast, by Country 2019 & 2032
- Table 63: South Africa Starch and Starch Derivatives Market Revenue (Million) Forecast, by Application 2019 & 2032
- Table 64: South Africa Starch and Starch Derivatives Market Volume (K Tons) Forecast, by Application 2019 & 2032
- Table 65: Rest of Middle East Starch and Starch Derivatives Market Revenue (Million) Forecast, by Application 2019 & 2032
- Table 66: Rest of Middle East Starch and Starch Derivatives Market Volume (K Tons) Forecast, by Application 2019 & 2032
- Table 67: Global Starch and Starch Derivatives Market Revenue Million Forecast, by Type 2019 & 2032
- Table 68: Global Starch and Starch Derivatives Market Volume K Tons Forecast, by Type 2019 & 2032
- Table 69: Global Starch and Starch Derivatives Market Revenue Million Forecast, by Source 2019 & 2032
- Table 70: Global Starch and Starch Derivatives Market Volume K Tons Forecast, by Source 2019 & 2032
- Table 71: Global Starch and Starch Derivatives Market Revenue Million Forecast, by Application 2019 & 2032
- Table 72: Global Starch and Starch Derivatives Market Volume K Tons Forecast, by Application 2019 & 2032
- Table 73: Global Starch and Starch Derivatives Market Revenue Million Forecast, by Country 2019 & 2032
- Table 74: Global Starch and Starch Derivatives Market Volume K Tons Forecast, by Country 2019 & 2032
- Table 75: United States Starch and Starch Derivatives Market Revenue (Million) Forecast, by Application 2019 & 2032
- Table 76: United States Starch and Starch Derivatives Market Volume (K Tons) Forecast, by Application 2019 & 2032
- Table 77: Canada Starch and Starch Derivatives Market Revenue (Million) Forecast, by Application 2019 & 2032
- Table 78: Canada Starch and Starch Derivatives Market Volume (K Tons) Forecast, by Application 2019 & 2032
- Table 79: Mexico Starch and Starch Derivatives Market Revenue (Million) Forecast, by Application 2019 & 2032
- Table 80: Mexico Starch and Starch Derivatives Market Volume (K Tons) Forecast, by Application 2019 & 2032
- Table 81: Rest of North America Starch and Starch Derivatives Market Revenue (Million) Forecast, by Application 2019 & 2032
- Table 82: Rest of North America Starch and Starch Derivatives Market Volume (K Tons) Forecast, by Application 2019 & 2032
- Table 83: Global Starch and Starch Derivatives Market Revenue Million Forecast, by Type 2019 & 2032
- Table 84: Global Starch and Starch Derivatives Market Volume K Tons Forecast, by Type 2019 & 2032
- Table 85: Global Starch and Starch Derivatives Market Revenue Million Forecast, by Source 2019 & 2032
- Table 86: Global Starch and Starch Derivatives Market Volume K Tons Forecast, by Source 2019 & 2032
- Table 87: Global Starch and Starch Derivatives Market Revenue Million Forecast, by Application 2019 & 2032
- Table 88: Global Starch and Starch Derivatives Market Volume K Tons Forecast, by Application 2019 & 2032
- Table 89: Global Starch and Starch Derivatives Market Revenue Million Forecast, by Country 2019 & 2032
- Table 90: Global Starch and Starch Derivatives Market Volume K Tons Forecast, by Country 2019 & 2032
- Table 91: United Kingdom Starch and Starch Derivatives Market Revenue (Million) Forecast, by Application 2019 & 2032
- Table 92: United Kingdom Starch and Starch Derivatives Market Volume (K Tons) Forecast, by Application 2019 & 2032
- Table 93: Germany Starch and Starch Derivatives Market Revenue (Million) Forecast, by Application 2019 & 2032
- Table 94: Germany Starch and Starch Derivatives Market Volume (K Tons) Forecast, by Application 2019 & 2032
- Table 95: Spain Starch and Starch Derivatives Market Revenue (Million) Forecast, by Application 2019 & 2032
- Table 96: Spain Starch and Starch Derivatives Market Volume (K Tons) Forecast, by Application 2019 & 2032
- Table 97: France Starch and Starch Derivatives Market Revenue (Million) Forecast, by Application 2019 & 2032
- Table 98: France Starch and Starch Derivatives Market Volume (K Tons) Forecast, by Application 2019 & 2032
- Table 99: Italy Starch and Starch Derivatives Market Revenue (Million) Forecast, by Application 2019 & 2032
- Table 100: Italy Starch and Starch Derivatives Market Volume (K Tons) Forecast, by Application 2019 & 2032
- Table 101: Russia Starch and Starch Derivatives Market Revenue (Million) Forecast, by Application 2019 & 2032
- Table 102: Russia Starch and Starch Derivatives Market Volume (K Tons) Forecast, by Application 2019 & 2032
- Table 103: Rest of Europe Starch and Starch Derivatives Market Revenue (Million) Forecast, by Application 2019 & 2032
- Table 104: Rest of Europe Starch and Starch Derivatives Market Volume (K Tons) Forecast, by Application 2019 & 2032
- Table 105: Global Starch and Starch Derivatives Market Revenue Million Forecast, by Type 2019 & 2032
- Table 106: Global Starch and Starch Derivatives Market Volume K Tons Forecast, by Type 2019 & 2032
- Table 107: Global Starch and Starch Derivatives Market Revenue Million Forecast, by Source 2019 & 2032
- Table 108: Global Starch and Starch Derivatives Market Volume K Tons Forecast, by Source 2019 & 2032
- Table 109: Global Starch and Starch Derivatives Market Revenue Million Forecast, by Application 2019 & 2032
- Table 110: Global Starch and Starch Derivatives Market Volume K Tons Forecast, by Application 2019 & 2032
- Table 111: Global Starch and Starch Derivatives Market Revenue Million Forecast, by Country 2019 & 2032
- Table 112: Global Starch and Starch Derivatives Market Volume K Tons Forecast, by Country 2019 & 2032
- Table 113: China Starch and Starch Derivatives Market Revenue (Million) Forecast, by Application 2019 & 2032
- Table 114: China Starch and Starch Derivatives Market Volume (K Tons) Forecast, by Application 2019 & 2032
- Table 115: Japan Starch and Starch Derivatives Market Revenue (Million) Forecast, by Application 2019 & 2032
- Table 116: Japan Starch and Starch Derivatives Market Volume (K Tons) Forecast, by Application 2019 & 2032
- Table 117: India Starch and Starch Derivatives Market Revenue (Million) Forecast, by Application 2019 & 2032
- Table 118: India Starch and Starch Derivatives Market Volume (K Tons) Forecast, by Application 2019 & 2032
- Table 119: Australia Starch and Starch Derivatives Market Revenue (Million) Forecast, by Application 2019 & 2032
- Table 120: Australia Starch and Starch Derivatives Market Volume (K Tons) Forecast, by Application 2019 & 2032
- Table 121: Rest of Asia Pacific Starch and Starch Derivatives Market Revenue (Million) Forecast, by Application 2019 & 2032
- Table 122: Rest of Asia Pacific Starch and Starch Derivatives Market Volume (K Tons) Forecast, by Application 2019 & 2032
- Table 123: Global Starch and Starch Derivatives Market Revenue Million Forecast, by Type 2019 & 2032
- Table 124: Global Starch and Starch Derivatives Market Volume K Tons Forecast, by Type 2019 & 2032
- Table 125: Global Starch and Starch Derivatives Market Revenue Million Forecast, by Source 2019 & 2032
- Table 126: Global Starch and Starch Derivatives Market Volume K Tons Forecast, by Source 2019 & 2032
- Table 127: Global Starch and Starch Derivatives Market Revenue Million Forecast, by Application 2019 & 2032
- Table 128: Global Starch and Starch Derivatives Market Volume K Tons Forecast, by Application 2019 & 2032
- Table 129: Global Starch and Starch Derivatives Market Revenue Million Forecast, by Country 2019 & 2032
- Table 130: Global Starch and Starch Derivatives Market Volume K Tons Forecast, by Country 2019 & 2032
- Table 131: Brazil Starch and Starch Derivatives Market Revenue (Million) Forecast, by Application 2019 & 2032
- Table 132: Brazil Starch and Starch Derivatives Market Volume (K Tons) Forecast, by Application 2019 & 2032
- Table 133: Argentina Starch and Starch Derivatives Market Revenue (Million) Forecast, by Application 2019 & 2032
- Table 134: Argentina Starch and Starch Derivatives Market Volume (K Tons) Forecast, by Application 2019 & 2032
- Table 135: Rest of South America Starch and Starch Derivatives Market Revenue (Million) Forecast, by Application 2019 & 2032
- Table 136: Rest of South America Starch and Starch Derivatives Market Volume (K Tons) Forecast, by Application 2019 & 2032
- Table 137: Global Starch and Starch Derivatives Market Revenue Million Forecast, by Type 2019 & 2032
- Table 138: Global Starch and Starch Derivatives Market Volume K Tons Forecast, by Type 2019 & 2032
- Table 139: Global Starch and Starch Derivatives Market Revenue Million Forecast, by Source 2019 & 2032
- Table 140: Global Starch and Starch Derivatives Market Volume K Tons Forecast, by Source 2019 & 2032
- Table 141: Global Starch and Starch Derivatives Market Revenue Million Forecast, by Application 2019 & 2032
- Table 142: Global Starch and Starch Derivatives Market Volume K Tons Forecast, by Application 2019 & 2032
- Table 143: Global Starch and Starch Derivatives Market Revenue Million Forecast, by Country 2019 & 2032
- Table 144: Global Starch and Starch Derivatives Market Volume K Tons Forecast, by Country 2019 & 2032
- Table 145: Global Starch and Starch Derivatives Market Revenue Million Forecast, by Type 2019 & 2032
- Table 146: Global Starch and Starch Derivatives Market Volume K Tons Forecast, by Type 2019 & 2032
- Table 147: Global Starch and Starch Derivatives Market Revenue Million Forecast, by Source 2019 & 2032
- Table 148: Global Starch and Starch Derivatives Market Volume K Tons Forecast, by Source 2019 & 2032
- Table 149: Global Starch and Starch Derivatives Market Revenue Million Forecast, by Application 2019 & 2032
- Table 150: Global Starch and Starch Derivatives Market Volume K Tons Forecast, by Application 2019 & 2032
- Table 151: Global Starch and Starch Derivatives Market Revenue Million Forecast, by Country 2019 & 2032
- Table 152: Global Starch and Starch Derivatives Market Volume K Tons Forecast, by Country 2019 & 2032
- Table 153: South Africa Starch and Starch Derivatives Market Revenue (Million) Forecast, by Application 2019 & 2032
- Table 154: South Africa Starch and Starch Derivatives Market Volume (K Tons) Forecast, by Application 2019 & 2032
- Table 155: Rest of Middle East Starch and Starch Derivatives Market Revenue (Million) Forecast, by Application 2019 & 2032
- Table 156: Rest of Middle East Starch and Starch Derivatives Market Volume (K Tons) Forecast, by Application 2019 & 2032
Frequently Asked Questions
1. What is the projected Compound Annual Growth Rate (CAGR) of the Starch and Starch Derivatives Market?
The projected CAGR is approximately 5.40%.
2. Which companies are prominent players in the Starch and Starch Derivatives Market?
Key companies in the market include Kent Nutrition Group Inc, Angel Starch and Food Pvt Ltd, Ingredion Inc, Archer Daniels Midland Company, Tate & Lyle PLC, Roquette Frères, Anora Group PLC, Koninklijke DSM NV, Japan Corn Strach Co Ltd, BASF S.
3. What are the main segments of the Starch and Starch Derivatives Market?
The market segments include Type, Source, Application.
4. Can you provide details about the market size?
The market size is estimated to be USD 55.8 Million as of 2022.
5. What are some drivers contributing to market growth?
Increasing Demand For Convenience & Processed Food.
6. What are the notable trends driving market growth?
Growing Food Processing Sector Globally.
7. Are there any restraints impacting market growth?
Increased Consumer Awareness On Side-Effects Of Chemical Additives.
8. Can you provide examples of recent developments in the market?
In April 2022, Ingredion Inc. announced its plan to build an integrated modified starch facility in China designed to more than double its current capacity, significantly expanding production capabilities adjacent to its Shandong site.
9. What pricing options are available for accessing the report?
Pricing options include single-user, multi-user, and enterprise licenses priced at USD 4750, USD 5250, and USD 8750 respectively.
10. Is the market size provided in terms of value or volume?
The market size is provided in terms of value, measured in Million and volume, measured in K Tons.
11. Are there any specific market keywords associated with the report?
Yes, the market keyword associated with the report is "Starch and Starch Derivatives Market," which aids in identifying and referencing the specific market segment covered.
12. How do I determine which pricing option suits my needs best?
The pricing options vary based on user requirements and access needs. Individual users may opt for single-user licenses, while businesses requiring broader access may choose multi-user or enterprise licenses for cost-effective access to the report.
13. Are there any additional resources or data provided in the Starch and Starch Derivatives Market report?
While the report offers comprehensive insights, it's advisable to review the specific contents or supplementary materials provided to ascertain if additional resources or data are available.
14. How can I stay updated on further developments or reports in the Starch and Starch Derivatives Market?
To stay informed about further developments, trends, and reports in the Starch and Starch Derivatives Market, consider subscribing to industry newsletters, following relevant companies and organizations, or regularly checking reputable industry news sources and publications.
Methodology
Step 1 - Identification of Relevant Samples Size from Population Database


Step 2 - Approaches for Defining Global Market Size (Value, Volume* & Price*)

Note*: In applicable scenarios
Step 3 - Data Sources
Primary Research
- Web Analytics
- Survey Reports
- Research Institute
- Latest Research Reports
- Opinion Leaders
Secondary Research
- Annual Reports
- White Paper
- Latest Press Release
- Industry Association
- Paid Database
- Investor Presentations

Step 4 - Data Triangulation
Involves using different sources of information in order to increase the validity of a study
These sources are likely to be stakeholders in a program - participants, other researchers, program staff, other community members, and so on.
Then we put all data in single framework & apply various statistical tools to find out the dynamic on the market.
During the analysis stage, feedback from the stakeholder groups would be compared to determine areas of agreement as well as areas of divergence


