Key Insights
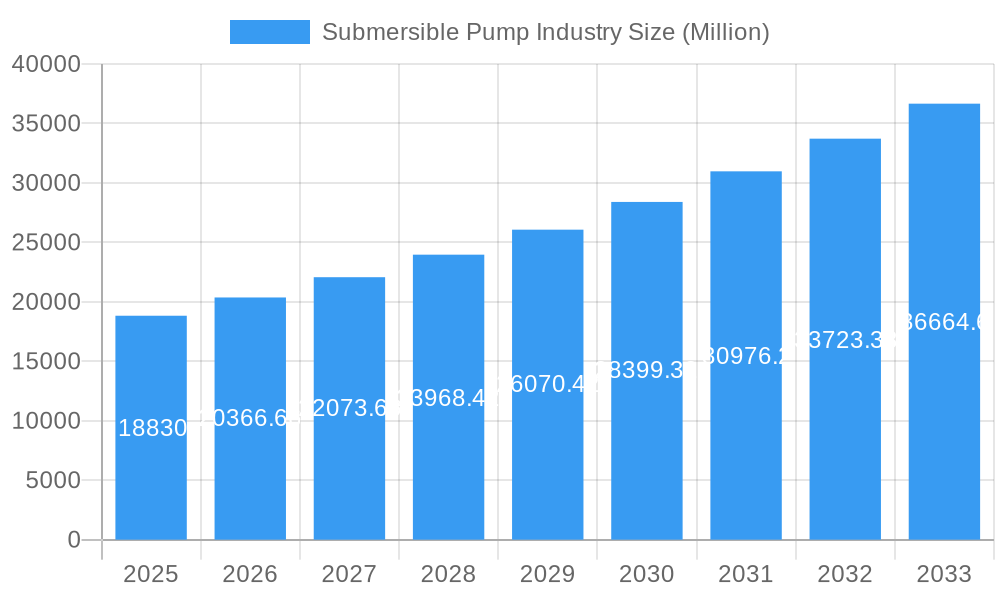
The global submersible pump market is experiencing robust growth, projected to reach \$18.83 billion in 2025 and maintain a Compound Annual Growth Rate (CAGR) of 8.20% from 2025 to 2033. This expansion is fueled by several key drivers. Increasing urbanization and industrialization necessitate efficient water management solutions, driving demand for submersible pumps across various sectors like water and wastewater treatment, oil and gas extraction, and mining. Furthermore, the rising adoption of advanced technologies, such as variable frequency drives (VFDs) for energy efficiency and smart monitoring systems for predictive maintenance, is contributing to market growth. The market is segmented by type (borewell, openwell, non-clog), drive type (electric, hydraulic, others), head (depth of water extraction), and end-user industry. The electric drive segment holds the largest market share due to its cost-effectiveness and widespread availability. Geographically, the Asia-Pacific region, particularly India and China, are expected to demonstrate significant growth potential due to rapid industrialization and infrastructure development. However, factors such as high initial investment costs and stringent environmental regulations pose challenges to market expansion. Competition is intense, with major players like Grundfos, Ebara, and ITT Goulds Pumps vying for market share through technological innovation and strategic partnerships.
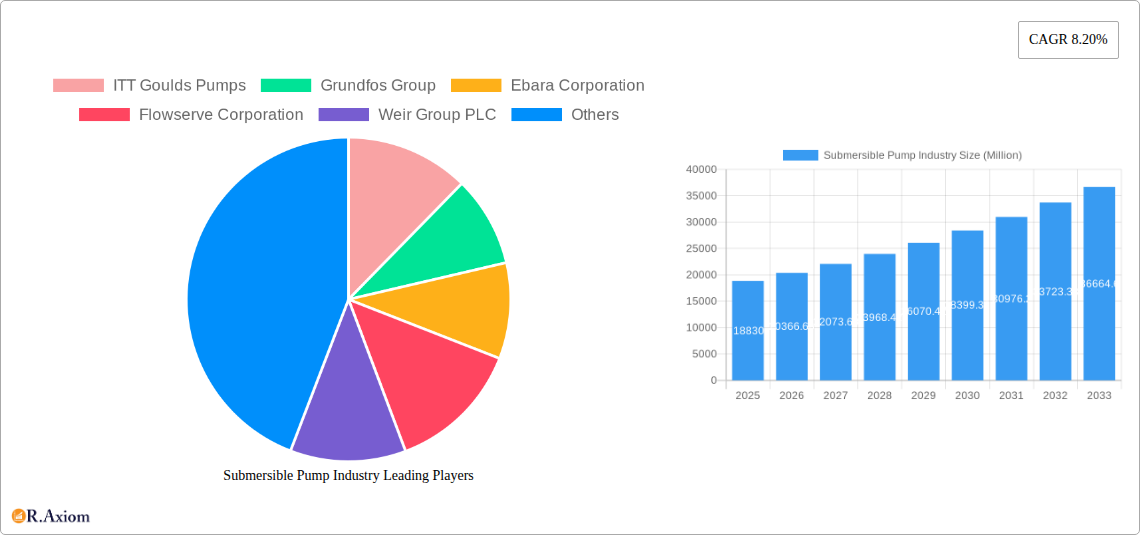
Submersible Pump Industry Market Size (In Billion)
The forecast period (2025-2033) anticipates continued strong growth, driven by ongoing investments in water infrastructure, particularly in developing economies. The increasing focus on sustainable water management practices and the adoption of energy-efficient submersible pumps will further propel market expansion. Technological advancements, such as the development of more robust and durable pumps capable of handling challenging operating conditions, will also contribute to market growth. However, fluctuations in raw material prices and potential disruptions in global supply chains could impact market dynamics. A deeper regional analysis reveals that while North America and Europe maintain substantial market shares, the fastest growth will likely originate from emerging economies in Asia-Pacific and the Middle East & Africa, driven by substantial infrastructure development projects. The competitive landscape remains dynamic, with companies focusing on product diversification, acquisitions, and strategic alliances to enhance their market position.
Submersible Pump Industry Company Market Share
This comprehensive report provides an in-depth analysis of the global submersible pump industry, offering valuable insights for stakeholders, investors, and industry professionals. The report covers the period 2019-2033, with a base year of 2025 and a forecast period of 2025-2033. The study encompasses market sizing, segmentation, competitive analysis, and future growth projections, leveraging extensive primary and secondary research. Market values are expressed in millions (USD).
Submersible Pump Industry Market Concentration & Innovation
The global submersible pump market is moderately concentrated, with several key players holding significant market share. The top 15 companies, including ITT Goulds Pumps, Grundfos Group, Ebara Corporation, Flowserve Corporation, Weir Group PLC, Atlas Copco AB, Baker Hughes Co, Franklin Electric Co Inc, Borets International Ltd, Halliburton Co, KSB AG, The Gorman-Rupp Company, Sulzer AG, Schlumberger Limited, and others, account for approximately xx% of the global market share in 2025. Market concentration is influenced by factors such as economies of scale, technological advancements, and strategic mergers and acquisitions (M&A).
Innovation is a key driver in this industry, with companies continuously developing more energy-efficient, reliable, and durable pumps. Key innovation areas include the development of advanced materials, improved motor designs (e.g., canned motor technology), and smart pump technologies for enhanced monitoring and control. Stringent environmental regulations, particularly regarding water usage and wastewater treatment, further propel innovation. The prevalence of substitute technologies, such as centrifugal pumps, creates competitive pressure. End-user trends, such as increasing demand for water-efficient solutions and automation, are also significant factors.
Recent M&A activities, like the February 2022 acquisition of Dreno Pompe by Industrial Flow Solutions, demonstrate the industry's consolidation and strategic growth ambitions. The total value of M&A deals in the submersible pump industry during the historical period (2019-2024) is estimated at $xx Million, with an average deal value of approximately $xx Million.
Submersible Pump Industry Industry Trends & Insights
The global submersible pump market is projected to witness robust growth during the forecast period (2025-2033), driven by several key factors. The rising global population and increasing urbanization are leading to greater demand for water and wastewater management solutions, which in turn fuels the demand for submersible pumps. Similarly, the growth of the oil and gas, mining, and construction industries contributes significantly to the market expansion. The compound annual growth rate (CAGR) for the submersible pump market is estimated at xx% from 2025 to 2033.
Technological advancements, such as the adoption of smart pumps with integrated sensors and remote monitoring capabilities, are transforming the industry. These advancements enhance operational efficiency, reduce downtime, and improve overall system reliability. Consumer preference is shifting towards energy-efficient and environmentally friendly pumps, leading to increased adoption of variable speed drives and other energy-saving technologies. The market penetration of smart pumps is projected to reach xx% by 2033. Competitive dynamics are characterized by ongoing innovation, strategic partnerships, and M&A activities. This dynamic landscape compels companies to continuously improve their product offerings and expand their market reach.
Dominant Markets & Segments in Submersible Pump Industry
The Asia-Pacific region is anticipated to dominate the submersible pump market during the forecast period, driven by rapid infrastructure development, rising industrial activity, and increasing investments in water and wastewater management. China and India are expected to be the key contributors to regional growth.
Key Drivers for Regional Dominance:
- Rapid economic growth and industrialization
- Significant investments in infrastructure projects, particularly in water management and irrigation
- Favorable government policies and regulations supporting water resource management
- Expanding mining and oil & gas sectors
Segment Dominance Analysis:
Electric drive submersible pumps are expected to hold the largest share in the drive type segment, primarily because of cost-effectiveness and widespread availability of electricity. The Borewell submersible pump segment is projected to witness significant growth driven by high demand in agricultural and rural areas. The Water and Wastewater end-user segment will continue to dominate owing to significant investments in upgrading water and wastewater infrastructure globally. The "Below 50m" head segment is anticipated to hold a substantial market share, primarily because of its extensive use in various applications, including domestic water supply and irrigation.
Submersible Pump Industry Product Developments
Recent product innovations focus on enhancing pump efficiency, reliability, and durability. The development of canned motor pumps, as exemplified by Curtiss-Wright's collaboration with Shell Plc, is a notable example of technological advancements. These pumps offer improved performance and reliability, especially in demanding applications like offshore oil and gas extraction. Manufacturers are also incorporating advanced materials and designs to extend the lifespan of pumps, reduce maintenance requirements, and improve energy efficiency, thus catering to the growing demand for sustainable and cost-effective solutions.
Report Scope & Segmentation Analysis
This report provides a detailed segmentation of the submersible pump market across various parameters:
Type: Borewell Submersible Pumps (market size: $xx Million in 2025, projected CAGR: xx%), Openwell Submersible Pumps ($xx Million in 2025, projected CAGR: xx%), Non-clog Submersible Pumps ($xx Million in 2025, projected CAGR: xx%). Competition is intense in each segment, with established players and new entrants vying for market share.
Drive Type: Electric ($xx Million in 2025, projected CAGR: xx%), Hydraulic ($xx Million in 2025, projected CAGR: xx%), Other Drive Types ($xx Million in 2025, projected CAGR: xx%). Electric drive pumps dominate due to lower cost and ease of installation.
Head: Below 50 m ($xx Million in 2025, projected CAGR: xx%), Between 50 m to 100 m ($xx Million in 2025, projected CAGR: xx%), Above 100 m ($xx Million in 2025, projected CAGR: xx%). Higher head pumps are used in specialized applications and tend to have higher price points.
End User: Water and Wastewater ($xx Million in 2025, projected CAGR: xx%), Oil and Gas Industry ($xx Million in 2025, projected CAGR: xx%), Mining and Construction Industry ($xx Million in 2025, projected CAGR: xx%), Other End Users ($xx Million in 2025, projected CAGR: xx%). The water and wastewater sector is the largest end-user segment.
Key Drivers of Submersible Pump Industry Growth
Several factors contribute to the growth of the submersible pump market. Firstly, the increasing demand for clean water and efficient wastewater management systems globally is a primary driver. Secondly, rapid urbanization and industrialization in developing economies fuel demand for reliable pumping solutions. Thirdly, advancements in pump technology, particularly the development of energy-efficient and smart pumps, enhance market attractiveness. Lastly, supportive government policies and regulations related to water conservation and environmental protection create favorable market conditions.
Challenges in the Submersible Pump Industry Sector
The submersible pump industry faces several challenges. Stringent environmental regulations can increase manufacturing costs and complexity. Supply chain disruptions, particularly those affecting raw materials like metals and electronics, can impact production and delivery. Intense competition among established players and the emergence of new entrants pose a continuous challenge for market share. Furthermore, fluctuating energy prices can influence operational costs and affect consumer purchasing decisions.
Emerging Opportunities in Submersible Pump Industry
Emerging opportunities lie in the development and adoption of energy-efficient pumps, smart pump technologies, and sustainable materials. Expanding into new and underserved markets, particularly in developing economies with growing infrastructure needs, presents significant potential. The integration of IoT (Internet of Things) capabilities in pumps allows for remote monitoring and predictive maintenance, further enhancing efficiency and reducing downtime. The focus on sustainability is opening avenues for pumps utilizing recycled or bio-based materials.
Leading Players in the Submersible Pump Industry Market
- ITT Goulds Pumps
- Grundfos Group
- Ebara Corporation
- Flowserve Corporation
- Weir Group PLC
- Atlas Copco AB
- Baker Hughes Co
- Franklin Electric Co Inc
- Borets International Ltd
- Halliburton Co
- KSB AG
- The Gorman-Rupp Company
- Sulzer AG
- Schlumberger Limited
Key Developments in Submersible Pump Industry Industry
- May 2023: Curtiss-Wright Corporation signs an agreement with Shell Plc to develop and deploy electro-submersible pumps for offshore platforms, showcasing advancements in canned motor technology.
- February 2022: Industrial Flow Solutions acquires Dreno Pompe, expanding its presence in the wastewater pump market.
Strategic Outlook for Submersible Pump Industry Market
The submersible pump market is poised for continued growth, driven by the expanding global population, accelerating urbanization, and increasing industrial activity. Technological advancements, particularly in energy efficiency and smart pump technologies, will shape the competitive landscape. Companies that focus on innovation, sustainability, and strategic partnerships are expected to gain a competitive advantage. The market presents significant opportunities for growth in both developed and developing economies.
Submersible Pump Industry Segmentation
-
1. Type
- 1.1. Borewell Submersible Pump
- 1.2. Openwell Submersible Pump
- 1.3. Non-clog Submersible Pump
-
2. Drive Type
- 2.1. Electric
- 2.2. Hydraulic
- 2.3. Other Drive Types
-
3. Head
- 3.1. Below 50 m
- 3.2. Between 50 m to 100 m
- 3.3. Above 100 m
-
4. End User
- 4.1. Water and Wastewater
- 4.2. Oil and Gas Industry
- 4.3. Mining and Construction Industry
- 4.4. Other End Users
Submersible Pump Industry Segmentation By Geography
-
1. North America
- 1.1. United States
- 1.2. Canada
- 1.3. Rest of North America
-
2. Europe
- 2.1. Germany
- 2.2. France
- 2.3. United Kingdom
- 2.4. Spain
- 2.5. Nordic Countries
- 2.6. Turkey
- 2.7. Russia
- 2.8. Rest of Europe
-
3. Asia Pacific
- 3.1. China
- 3.2. India
- 3.3. Japan
- 3.4. South Korea
- 3.5. Malaysia
- 3.6. Thailand
- 3.7. Indonesia
- 3.8. Vietnam
- 3.9. Rest of Asia Pacific
-
4. South America
- 4.1. Brazil
- 4.2. Argentina
- 4.3. Colombia
- 4.4. Rest of South America
-
5. Middle East and Africa
- 5.1. Saudi Arabia
- 5.2. United Arab Emirates
- 5.3. South Africa
- 5.4. Nigeria
- 5.5. Qatar
- 5.6. Egypt
- 5.7. Rest of Middle East and Africa
Submersible Pump Industry Regional Market Share
Geographic Coverage of Submersible Pump Industry
Submersible Pump Industry REPORT HIGHLIGHTS
| Aspects | Details |
|---|---|
| Study Period | 2020-2034 |
| Base Year | 2025 |
| Estimated Year | 2026 |
| Forecast Period | 2026-2034 |
| Historical Period | 2020-2025 |
| Growth Rate | CAGR of 8.20% from 2020-2034 |
| Segmentation |
|
Table of Contents
- 1. Introduction
- 1.1. Research Scope
- 1.2. Market Segmentation
- 1.3. Research Objective
- 1.4. Definitions and Assumptions
- 2. Executive Summary
- 2.1. Market Snapshot
- 3. Market Dynamics
- 3.1. Market Drivers
- 3.2. Market Restrains
- 3.3. Market Trends
- 3.4. Market Opportunities
- 4. Market Factor Analysis
- 4.1. Porters Five Forces
- 4.1.1. Bargaining Power of Suppliers
- 4.1.2. Bargaining Power of Buyers
- 4.1.3. Threat of New Entrants
- 4.1.4. Threat of Substitutes
- 4.1.5. Competitive Rivalry
- 4.2. PESTEL analysis
- 4.3. BCG Analysis
- 4.3.1. Stars (High Growth, High Market Share)
- 4.3.2. Cash Cows (Low Growth, High Market Share)
- 4.3.3. Question Mark (High Growth, Low Market Share)
- 4.3.4. Dogs (Low Growth, Low Market Share)
- 4.4. Ansoff Matrix Analysis
- 4.5. Supply Chain Analysis
- 4.6. Regulatory Landscape
- 4.7. Current Market Potential and Opportunity Assessment (TAM–SAM–SOM Framework)
- 4.8. RAX Analyst Note
- 4.1. Porters Five Forces
- 5. Market Analysis, Insights and Forecast 2021-2033
- 5.1. Market Analysis, Insights and Forecast - by Type
- 5.1.1. Borewell Submersible Pump
- 5.1.2. Openwell Submersible Pump
- 5.1.3. Non-clog Submersible Pump
- 5.2. Market Analysis, Insights and Forecast - by Drive Type
- 5.2.1. Electric
- 5.2.2. Hydraulic
- 5.2.3. Other Drive Types
- 5.3. Market Analysis, Insights and Forecast - by Head
- 5.3.1. Below 50 m
- 5.3.2. Between 50 m to 100 m
- 5.3.3. Above 100 m
- 5.4. Market Analysis, Insights and Forecast - by End User
- 5.4.1. Water and Wastewater
- 5.4.2. Oil and Gas Industry
- 5.4.3. Mining and Construction Industry
- 5.4.4. Other End Users
- 5.5. Market Analysis, Insights and Forecast - by Region
- 5.5.1. North America
- 5.5.2. Europe
- 5.5.3. Asia Pacific
- 5.5.4. South America
- 5.5.5. Middle East and Africa
- 5.1. Market Analysis, Insights and Forecast - by Type
- 6. Global Submersible Pump Industry Analysis, Insights and Forecast, 2021-2033
- 6.1. Market Analysis, Insights and Forecast - by Type
- 6.1.1. Borewell Submersible Pump
- 6.1.2. Openwell Submersible Pump
- 6.1.3. Non-clog Submersible Pump
- 6.2. Market Analysis, Insights and Forecast - by Drive Type
- 6.2.1. Electric
- 6.2.2. Hydraulic
- 6.2.3. Other Drive Types
- 6.3. Market Analysis, Insights and Forecast - by Head
- 6.3.1. Below 50 m
- 6.3.2. Between 50 m to 100 m
- 6.3.3. Above 100 m
- 6.4. Market Analysis, Insights and Forecast - by End User
- 6.4.1. Water and Wastewater
- 6.4.2. Oil and Gas Industry
- 6.4.3. Mining and Construction Industry
- 6.4.4. Other End Users
- 6.1. Market Analysis, Insights and Forecast - by Type
- 7. North America Submersible Pump Industry Analysis, Insights and Forecast, 2020-2032
- 7.1. Market Analysis, Insights and Forecast - by Type
- 7.1.1. Borewell Submersible Pump
- 7.1.2. Openwell Submersible Pump
- 7.1.3. Non-clog Submersible Pump
- 7.2. Market Analysis, Insights and Forecast - by Drive Type
- 7.2.1. Electric
- 7.2.2. Hydraulic
- 7.2.3. Other Drive Types
- 7.3. Market Analysis, Insights and Forecast - by Head
- 7.3.1. Below 50 m
- 7.3.2. Between 50 m to 100 m
- 7.3.3. Above 100 m
- 7.4. Market Analysis, Insights and Forecast - by End User
- 7.4.1. Water and Wastewater
- 7.4.2. Oil and Gas Industry
- 7.4.3. Mining and Construction Industry
- 7.4.4. Other End Users
- 7.1. Market Analysis, Insights and Forecast - by Type
- 8. Europe Submersible Pump Industry Analysis, Insights and Forecast, 2020-2032
- 8.1. Market Analysis, Insights and Forecast - by Type
- 8.1.1. Borewell Submersible Pump
- 8.1.2. Openwell Submersible Pump
- 8.1.3. Non-clog Submersible Pump
- 8.2. Market Analysis, Insights and Forecast - by Drive Type
- 8.2.1. Electric
- 8.2.2. Hydraulic
- 8.2.3. Other Drive Types
- 8.3. Market Analysis, Insights and Forecast - by Head
- 8.3.1. Below 50 m
- 8.3.2. Between 50 m to 100 m
- 8.3.3. Above 100 m
- 8.4. Market Analysis, Insights and Forecast - by End User
- 8.4.1. Water and Wastewater
- 8.4.2. Oil and Gas Industry
- 8.4.3. Mining and Construction Industry
- 8.4.4. Other End Users
- 8.1. Market Analysis, Insights and Forecast - by Type
- 9. Asia Pacific Submersible Pump Industry Analysis, Insights and Forecast, 2020-2032
- 9.1. Market Analysis, Insights and Forecast - by Type
- 9.1.1. Borewell Submersible Pump
- 9.1.2. Openwell Submersible Pump
- 9.1.3. Non-clog Submersible Pump
- 9.2. Market Analysis, Insights and Forecast - by Drive Type
- 9.2.1. Electric
- 9.2.2. Hydraulic
- 9.2.3. Other Drive Types
- 9.3. Market Analysis, Insights and Forecast - by Head
- 9.3.1. Below 50 m
- 9.3.2. Between 50 m to 100 m
- 9.3.3. Above 100 m
- 9.4. Market Analysis, Insights and Forecast - by End User
- 9.4.1. Water and Wastewater
- 9.4.2. Oil and Gas Industry
- 9.4.3. Mining and Construction Industry
- 9.4.4. Other End Users
- 9.1. Market Analysis, Insights and Forecast - by Type
- 10. South America Submersible Pump Industry Analysis, Insights and Forecast, 2020-2032
- 10.1. Market Analysis, Insights and Forecast - by Type
- 10.1.1. Borewell Submersible Pump
- 10.1.2. Openwell Submersible Pump
- 10.1.3. Non-clog Submersible Pump
- 10.2. Market Analysis, Insights and Forecast - by Drive Type
- 10.2.1. Electric
- 10.2.2. Hydraulic
- 10.2.3. Other Drive Types
- 10.3. Market Analysis, Insights and Forecast - by Head
- 10.3.1. Below 50 m
- 10.3.2. Between 50 m to 100 m
- 10.3.3. Above 100 m
- 10.4. Market Analysis, Insights and Forecast - by End User
- 10.4.1. Water and Wastewater
- 10.4.2. Oil and Gas Industry
- 10.4.3. Mining and Construction Industry
- 10.4.4. Other End Users
- 10.1. Market Analysis, Insights and Forecast - by Type
- 11. Middle East and Africa Submersible Pump Industry Analysis, Insights and Forecast, 2020-2032
- 11.1. Market Analysis, Insights and Forecast - by Type
- 11.1.1. Borewell Submersible Pump
- 11.1.2. Openwell Submersible Pump
- 11.1.3. Non-clog Submersible Pump
- 11.2. Market Analysis, Insights and Forecast - by Drive Type
- 11.2.1. Electric
- 11.2.2. Hydraulic
- 11.2.3. Other Drive Types
- 11.3. Market Analysis, Insights and Forecast - by Head
- 11.3.1. Below 50 m
- 11.3.2. Between 50 m to 100 m
- 11.3.3. Above 100 m
- 11.4. Market Analysis, Insights and Forecast - by End User
- 11.4.1. Water and Wastewater
- 11.4.2. Oil and Gas Industry
- 11.4.3. Mining and Construction Industry
- 11.4.4. Other End Users
- 11.1. Market Analysis, Insights and Forecast - by Type
- 12. Competitive Analysis
- 12.1. Company Profiles
- 12.1.1 ITT Goulds Pumps
- 12.1.1.1. Company Overview
- 12.1.1.2. Products
- 12.1.1.3. Company Financials
- 12.1.1.4. SWOT Analysis
- 12.1.2 Grundfos Group
- 12.1.2.1. Company Overview
- 12.1.2.2. Products
- 12.1.2.3. Company Financials
- 12.1.2.4. SWOT Analysis
- 12.1.3 Ebara Corporation
- 12.1.3.1. Company Overview
- 12.1.3.2. Products
- 12.1.3.3. Company Financials
- 12.1.3.4. SWOT Analysis
- 12.1.4 Flowserve Corporation
- 12.1.4.1. Company Overview
- 12.1.4.2. Products
- 12.1.4.3. Company Financials
- 12.1.4.4. SWOT Analysis
- 12.1.5 Weir Group PLC
- 12.1.5.1. Company Overview
- 12.1.5.2. Products
- 12.1.5.3. Company Financials
- 12.1.5.4. SWOT Analysis
- 12.1.6 Atlas Copco AB
- 12.1.6.1. Company Overview
- 12.1.6.2. Products
- 12.1.6.3. Company Financials
- 12.1.6.4. SWOT Analysis
- 12.1.7 Baker Hughes Co
- 12.1.7.1. Company Overview
- 12.1.7.2. Products
- 12.1.7.3. Company Financials
- 12.1.7.4. SWOT Analysis
- 12.1.8 Franklin Electric Co Inc
- 12.1.8.1. Company Overview
- 12.1.8.2. Products
- 12.1.8.3. Company Financials
- 12.1.8.4. SWOT Analysis
- 12.1.9 Borets International Ltd
- 12.1.9.1. Company Overview
- 12.1.9.2. Products
- 12.1.9.3. Company Financials
- 12.1.9.4. SWOT Analysis
- 12.1.10 Halliburton Co
- 12.1.10.1. Company Overview
- 12.1.10.2. Products
- 12.1.10.3. Company Financials
- 12.1.10.4. SWOT Analysis
- 12.1.11 KSB AG*List Not Exhaustive 6 4 Market Ranking/Share Analysi
- 12.1.11.1. Company Overview
- 12.1.11.2. Products
- 12.1.11.3. Company Financials
- 12.1.11.4. SWOT Analysis
- 12.1.12 The Gorman-Rupp Company
- 12.1.12.1. Company Overview
- 12.1.12.2. Products
- 12.1.12.3. Company Financials
- 12.1.12.4. SWOT Analysis
- 12.1.13 Sulzer AG
- 12.1.13.1. Company Overview
- 12.1.13.2. Products
- 12.1.13.3. Company Financials
- 12.1.13.4. SWOT Analysis
- 12.1.14 Schlumberger Limited
- 12.1.14.1. Company Overview
- 12.1.14.2. Products
- 12.1.14.3. Company Financials
- 12.1.14.4. SWOT Analysis
- 12.1.1 ITT Goulds Pumps
- 12.2. Market Entropy
- 12.2.1 Company's Key Areas Served
- 12.2.2 Recent Developments
- 12.3. Company Market Share Analysis 2025
- 12.3.1 Top 5 Companies Market Share Analysis
- 12.3.2 Top 3 Companies Market Share Analysis
- 12.4. List of Potential Customers
- 13. Research Methodology
List of Figures
- Figure 1: Global Submersible Pump Industry Revenue Breakdown (Million, %) by Region 2025 & 2033
- Figure 2: North America Submersible Pump Industry Revenue (Million), by Type 2025 & 2033
- Figure 3: North America Submersible Pump Industry Revenue Share (%), by Type 2025 & 2033
- Figure 4: North America Submersible Pump Industry Revenue (Million), by Drive Type 2025 & 2033
- Figure 5: North America Submersible Pump Industry Revenue Share (%), by Drive Type 2025 & 2033
- Figure 6: North America Submersible Pump Industry Revenue (Million), by Head 2025 & 2033
- Figure 7: North America Submersible Pump Industry Revenue Share (%), by Head 2025 & 2033
- Figure 8: North America Submersible Pump Industry Revenue (Million), by End User 2025 & 2033
- Figure 9: North America Submersible Pump Industry Revenue Share (%), by End User 2025 & 2033
- Figure 10: North America Submersible Pump Industry Revenue (Million), by Country 2025 & 2033
- Figure 11: North America Submersible Pump Industry Revenue Share (%), by Country 2025 & 2033
- Figure 12: Europe Submersible Pump Industry Revenue (Million), by Type 2025 & 2033
- Figure 13: Europe Submersible Pump Industry Revenue Share (%), by Type 2025 & 2033
- Figure 14: Europe Submersible Pump Industry Revenue (Million), by Drive Type 2025 & 2033
- Figure 15: Europe Submersible Pump Industry Revenue Share (%), by Drive Type 2025 & 2033
- Figure 16: Europe Submersible Pump Industry Revenue (Million), by Head 2025 & 2033
- Figure 17: Europe Submersible Pump Industry Revenue Share (%), by Head 2025 & 2033
- Figure 18: Europe Submersible Pump Industry Revenue (Million), by End User 2025 & 2033
- Figure 19: Europe Submersible Pump Industry Revenue Share (%), by End User 2025 & 2033
- Figure 20: Europe Submersible Pump Industry Revenue (Million), by Country 2025 & 2033
- Figure 21: Europe Submersible Pump Industry Revenue Share (%), by Country 2025 & 2033
- Figure 22: Asia Pacific Submersible Pump Industry Revenue (Million), by Type 2025 & 2033
- Figure 23: Asia Pacific Submersible Pump Industry Revenue Share (%), by Type 2025 & 2033
- Figure 24: Asia Pacific Submersible Pump Industry Revenue (Million), by Drive Type 2025 & 2033
- Figure 25: Asia Pacific Submersible Pump Industry Revenue Share (%), by Drive Type 2025 & 2033
- Figure 26: Asia Pacific Submersible Pump Industry Revenue (Million), by Head 2025 & 2033
- Figure 27: Asia Pacific Submersible Pump Industry Revenue Share (%), by Head 2025 & 2033
- Figure 28: Asia Pacific Submersible Pump Industry Revenue (Million), by End User 2025 & 2033
- Figure 29: Asia Pacific Submersible Pump Industry Revenue Share (%), by End User 2025 & 2033
- Figure 30: Asia Pacific Submersible Pump Industry Revenue (Million), by Country 2025 & 2033
- Figure 31: Asia Pacific Submersible Pump Industry Revenue Share (%), by Country 2025 & 2033
- Figure 32: South America Submersible Pump Industry Revenue (Million), by Type 2025 & 2033
- Figure 33: South America Submersible Pump Industry Revenue Share (%), by Type 2025 & 2033
- Figure 34: South America Submersible Pump Industry Revenue (Million), by Drive Type 2025 & 2033
- Figure 35: South America Submersible Pump Industry Revenue Share (%), by Drive Type 2025 & 2033
- Figure 36: South America Submersible Pump Industry Revenue (Million), by Head 2025 & 2033
- Figure 37: South America Submersible Pump Industry Revenue Share (%), by Head 2025 & 2033
- Figure 38: South America Submersible Pump Industry Revenue (Million), by End User 2025 & 2033
- Figure 39: South America Submersible Pump Industry Revenue Share (%), by End User 2025 & 2033
- Figure 40: South America Submersible Pump Industry Revenue (Million), by Country 2025 & 2033
- Figure 41: South America Submersible Pump Industry Revenue Share (%), by Country 2025 & 2033
- Figure 42: Middle East and Africa Submersible Pump Industry Revenue (Million), by Type 2025 & 2033
- Figure 43: Middle East and Africa Submersible Pump Industry Revenue Share (%), by Type 2025 & 2033
- Figure 44: Middle East and Africa Submersible Pump Industry Revenue (Million), by Drive Type 2025 & 2033
- Figure 45: Middle East and Africa Submersible Pump Industry Revenue Share (%), by Drive Type 2025 & 2033
- Figure 46: Middle East and Africa Submersible Pump Industry Revenue (Million), by Head 2025 & 2033
- Figure 47: Middle East and Africa Submersible Pump Industry Revenue Share (%), by Head 2025 & 2033
- Figure 48: Middle East and Africa Submersible Pump Industry Revenue (Million), by End User 2025 & 2033
- Figure 49: Middle East and Africa Submersible Pump Industry Revenue Share (%), by End User 2025 & 2033
- Figure 50: Middle East and Africa Submersible Pump Industry Revenue (Million), by Country 2025 & 2033
- Figure 51: Middle East and Africa Submersible Pump Industry Revenue Share (%), by Country 2025 & 2033
List of Tables
- Table 1: Global Submersible Pump Industry Revenue Million Forecast, by Type 2020 & 2033
- Table 2: Global Submersible Pump Industry Revenue Million Forecast, by Drive Type 2020 & 2033
- Table 3: Global Submersible Pump Industry Revenue Million Forecast, by Head 2020 & 2033
- Table 4: Global Submersible Pump Industry Revenue Million Forecast, by End User 2020 & 2033
- Table 5: Global Submersible Pump Industry Revenue Million Forecast, by Region 2020 & 2033
- Table 6: Global Submersible Pump Industry Revenue Million Forecast, by Type 2020 & 2033
- Table 7: Global Submersible Pump Industry Revenue Million Forecast, by Drive Type 2020 & 2033
- Table 8: Global Submersible Pump Industry Revenue Million Forecast, by Head 2020 & 2033
- Table 9: Global Submersible Pump Industry Revenue Million Forecast, by End User 2020 & 2033
- Table 10: Global Submersible Pump Industry Revenue Million Forecast, by Country 2020 & 2033
- Table 11: United States Submersible Pump Industry Revenue (Million) Forecast, by Application 2020 & 2033
- Table 12: Canada Submersible Pump Industry Revenue (Million) Forecast, by Application 2020 & 2033
- Table 13: Rest of North America Submersible Pump Industry Revenue (Million) Forecast, by Application 2020 & 2033
- Table 14: Global Submersible Pump Industry Revenue Million Forecast, by Type 2020 & 2033
- Table 15: Global Submersible Pump Industry Revenue Million Forecast, by Drive Type 2020 & 2033
- Table 16: Global Submersible Pump Industry Revenue Million Forecast, by Head 2020 & 2033
- Table 17: Global Submersible Pump Industry Revenue Million Forecast, by End User 2020 & 2033
- Table 18: Global Submersible Pump Industry Revenue Million Forecast, by Country 2020 & 2033
- Table 19: Germany Submersible Pump Industry Revenue (Million) Forecast, by Application 2020 & 2033
- Table 20: France Submersible Pump Industry Revenue (Million) Forecast, by Application 2020 & 2033
- Table 21: United Kingdom Submersible Pump Industry Revenue (Million) Forecast, by Application 2020 & 2033
- Table 22: Spain Submersible Pump Industry Revenue (Million) Forecast, by Application 2020 & 2033
- Table 23: Nordic Countries Submersible Pump Industry Revenue (Million) Forecast, by Application 2020 & 2033
- Table 24: Turkey Submersible Pump Industry Revenue (Million) Forecast, by Application 2020 & 2033
- Table 25: Russia Submersible Pump Industry Revenue (Million) Forecast, by Application 2020 & 2033
- Table 26: Rest of Europe Submersible Pump Industry Revenue (Million) Forecast, by Application 2020 & 2033
- Table 27: Global Submersible Pump Industry Revenue Million Forecast, by Type 2020 & 2033
- Table 28: Global Submersible Pump Industry Revenue Million Forecast, by Drive Type 2020 & 2033
- Table 29: Global Submersible Pump Industry Revenue Million Forecast, by Head 2020 & 2033
- Table 30: Global Submersible Pump Industry Revenue Million Forecast, by End User 2020 & 2033
- Table 31: Global Submersible Pump Industry Revenue Million Forecast, by Country 2020 & 2033
- Table 32: China Submersible Pump Industry Revenue (Million) Forecast, by Application 2020 & 2033
- Table 33: India Submersible Pump Industry Revenue (Million) Forecast, by Application 2020 & 2033
- Table 34: Japan Submersible Pump Industry Revenue (Million) Forecast, by Application 2020 & 2033
- Table 35: South Korea Submersible Pump Industry Revenue (Million) Forecast, by Application 2020 & 2033
- Table 36: Malaysia Submersible Pump Industry Revenue (Million) Forecast, by Application 2020 & 2033
- Table 37: Thailand Submersible Pump Industry Revenue (Million) Forecast, by Application 2020 & 2033
- Table 38: Indonesia Submersible Pump Industry Revenue (Million) Forecast, by Application 2020 & 2033
- Table 39: Vietnam Submersible Pump Industry Revenue (Million) Forecast, by Application 2020 & 2033
- Table 40: Rest of Asia Pacific Submersible Pump Industry Revenue (Million) Forecast, by Application 2020 & 2033
- Table 41: Global Submersible Pump Industry Revenue Million Forecast, by Type 2020 & 2033
- Table 42: Global Submersible Pump Industry Revenue Million Forecast, by Drive Type 2020 & 2033
- Table 43: Global Submersible Pump Industry Revenue Million Forecast, by Head 2020 & 2033
- Table 44: Global Submersible Pump Industry Revenue Million Forecast, by End User 2020 & 2033
- Table 45: Global Submersible Pump Industry Revenue Million Forecast, by Country 2020 & 2033
- Table 46: Brazil Submersible Pump Industry Revenue (Million) Forecast, by Application 2020 & 2033
- Table 47: Argentina Submersible Pump Industry Revenue (Million) Forecast, by Application 2020 & 2033
- Table 48: Colombia Submersible Pump Industry Revenue (Million) Forecast, by Application 2020 & 2033
- Table 49: Rest of South America Submersible Pump Industry Revenue (Million) Forecast, by Application 2020 & 2033
- Table 50: Global Submersible Pump Industry Revenue Million Forecast, by Type 2020 & 2033
- Table 51: Global Submersible Pump Industry Revenue Million Forecast, by Drive Type 2020 & 2033
- Table 52: Global Submersible Pump Industry Revenue Million Forecast, by Head 2020 & 2033
- Table 53: Global Submersible Pump Industry Revenue Million Forecast, by End User 2020 & 2033
- Table 54: Global Submersible Pump Industry Revenue Million Forecast, by Country 2020 & 2033
- Table 55: Saudi Arabia Submersible Pump Industry Revenue (Million) Forecast, by Application 2020 & 2033
- Table 56: United Arab Emirates Submersible Pump Industry Revenue (Million) Forecast, by Application 2020 & 2033
- Table 57: South Africa Submersible Pump Industry Revenue (Million) Forecast, by Application 2020 & 2033
- Table 58: Nigeria Submersible Pump Industry Revenue (Million) Forecast, by Application 2020 & 2033
- Table 59: Qatar Submersible Pump Industry Revenue (Million) Forecast, by Application 2020 & 2033
- Table 60: Egypt Submersible Pump Industry Revenue (Million) Forecast, by Application 2020 & 2033
- Table 61: Rest of Middle East and Africa Submersible Pump Industry Revenue (Million) Forecast, by Application 2020 & 2033
Frequently Asked Questions
1. What is the projected Compound Annual Growth Rate (CAGR) of the Submersible Pump Industry?
The projected CAGR is approximately 8.20%.
2. Which companies are prominent players in the Submersible Pump Industry?
Key companies in the market include ITT Goulds Pumps, Grundfos Group, Ebara Corporation, Flowserve Corporation, Weir Group PLC, Atlas Copco AB, Baker Hughes Co, Franklin Electric Co Inc, Borets International Ltd, Halliburton Co, KSB AG*List Not Exhaustive 6 4 Market Ranking/Share Analysi, The Gorman-Rupp Company, Sulzer AG, Schlumberger Limited.
3. What are the main segments of the Submersible Pump Industry?
The market segments include Type, Drive Type, Head, End User.
4. Can you provide details about the market size?
The market size is estimated to be USD 18.83 Million as of 2022.
5. What are some drivers contributing to market growth?
4.; Rapid Recovery in the Oil and Gas and Mining Industries4.; Surge in the Construction Industry.
6. What are the notable trends driving market growth?
The Oil and Gas Industry is Expected to Dominate the Market.
7. Are there any restraints impacting market growth?
4.; High Maintenance and Operation Costs of Submersible Pump Restrain the Market.
8. Can you provide examples of recent developments in the market?
In May 2023, Curtiss-Wright Corporation announced to sign an agreement with Shell Plc to test, manufacture, and provide operational support for an electro-submersible pump for a for a Shell offshore platform in the Gulf of Mexico. The goal of this initiative is to Curtiss-Wright's canned motor technology as an effective and reliable alternative to current subsea pump technologies.
9. What pricing options are available for accessing the report?
Pricing options include single-user, multi-user, and enterprise licenses priced at USD 4750, USD 5250, and USD 8750 respectively.
10. Is the market size provided in terms of value or volume?
The market size is provided in terms of value, measured in Million.
11. Are there any specific market keywords associated with the report?
Yes, the market keyword associated with the report is "Submersible Pump Industry," which aids in identifying and referencing the specific market segment covered.
12. How do I determine which pricing option suits my needs best?
The pricing options vary based on user requirements and access needs. Individual users may opt for single-user licenses, while businesses requiring broader access may choose multi-user or enterprise licenses for cost-effective access to the report.
13. Are there any additional resources or data provided in the Submersible Pump Industry report?
While the report offers comprehensive insights, it's advisable to review the specific contents or supplementary materials provided to ascertain if additional resources or data are available.
14. How can I stay updated on further developments or reports in the Submersible Pump Industry?
To stay informed about further developments, trends, and reports in the Submersible Pump Industry, consider subscribing to industry newsletters, following relevant companies and organizations, or regularly checking reputable industry news sources and publications.
Methodology
Step 1 - Identification of Relevant Samples Size from Population Database


Step 2 - Approaches for Defining Global Market Size (Value, Volume* & Price*)

Note*: In applicable scenarios
Step 3 - Data Sources
Primary Research
- Web Analytics
- Survey Reports
- Research Institute
- Latest Research Reports
- Opinion Leaders
Secondary Research
- Annual Reports
- White Paper
- Latest Press Release
- Industry Association
- Paid Database
- Investor Presentations

Step 4 - Data Triangulation
Involves using different sources of information in order to increase the validity of a study
These sources are likely to be stakeholders in a program - participants, other researchers, program staff, other community members, and so on.
Then we put all data in single framework & apply various statistical tools to find out the dynamic on the market.
During the analysis stage, feedback from the stakeholder groups would be compared to determine areas of agreement as well as areas of divergence

