
Key Insights
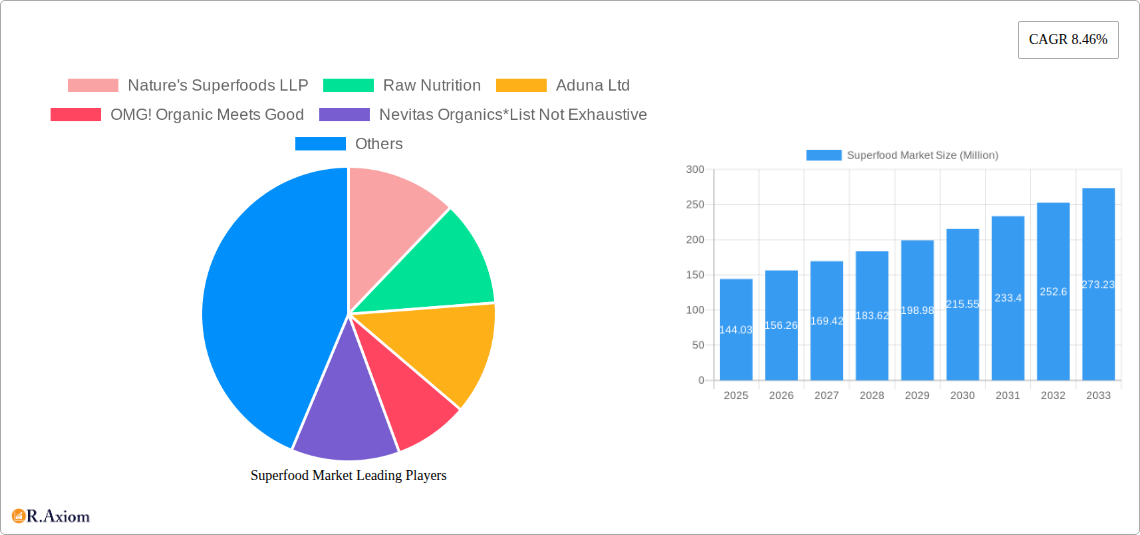
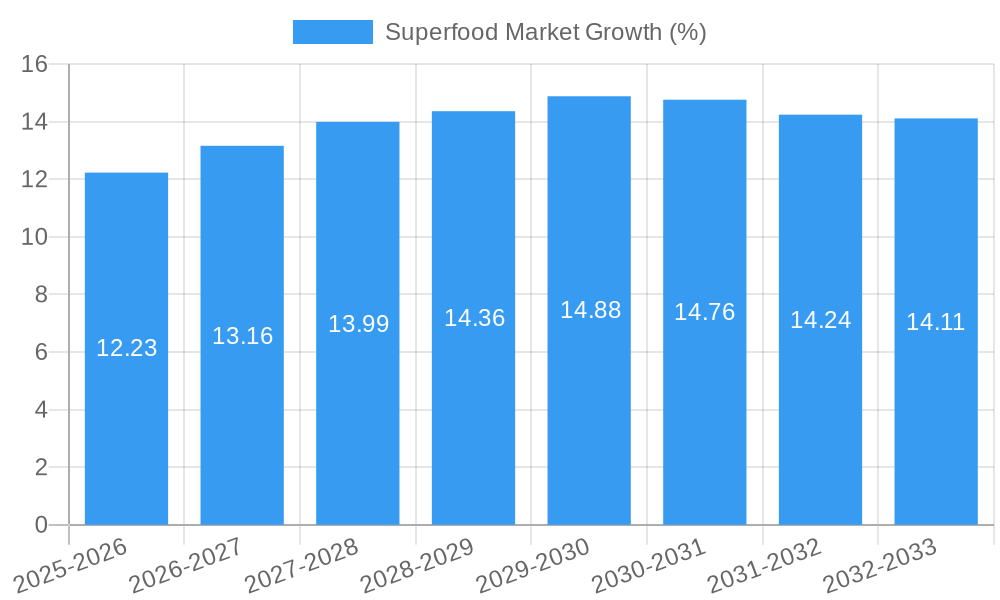
The global superfood market, valued at $144.03 million in 2025, is projected to experience robust growth, driven by a Compound Annual Growth Rate (CAGR) of 8.46% from 2025 to 2033. This expansion is fueled by several key factors. Increasing consumer awareness of health and wellness, coupled with a rising preference for natural and organic products, is significantly boosting demand for superfoods. The growing prevalence of chronic diseases and the desire for preventative healthcare measures further contribute to market growth. Furthermore, the convenience offered by online channels and the expanding retail presence of superfoods in supermarkets and specialty stores are widening accessibility and driving market penetration. The diverse range of superfoods, encompassing fruits, vegetables, grains, seeds, herbs, and roots, caters to a broad spectrum of consumer needs and preferences, adding to market dynamism. While specific challenges like price fluctuations in raw materials and potential supply chain disruptions could act as restraints, the overall market trajectory indicates a promising future for the industry.
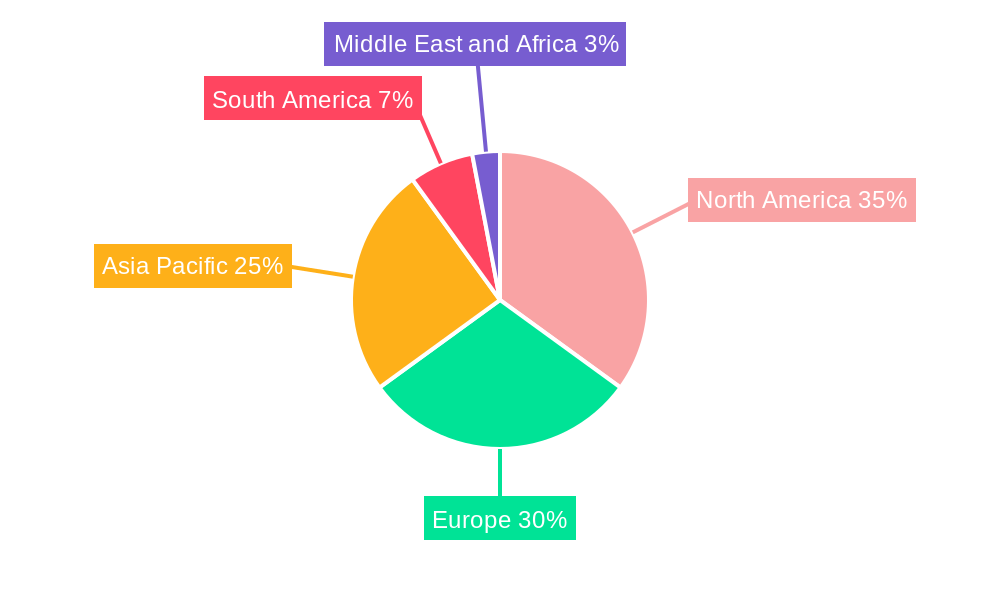
The market segmentation reveals key opportunities. The "Fruits" and "Vegetables" segments are likely to dominate due to their widespread appeal and established consumption patterns. However, segments like "Herbs and Roots," and "Grains and Seeds" also hold considerable potential, driven by increasing consumer exploration of unique nutritional profiles and functional benefits. Regarding distribution channels, while supermarkets and hypermarkets currently hold the largest share, online channels are poised for significant growth, leveraging the convenience of e-commerce and targeted marketing strategies. North America and Europe are anticipated to retain substantial market shares due to established consumer bases and high disposable incomes; however, regions like Asia Pacific and South America are emerging as dynamic markets with significant growth potential fueled by rising health consciousness and expanding middle classes. Key players in the superfood market are investing heavily in research and development, product innovation, and strategic partnerships to maintain their competitive edge and tap into the emerging opportunities within this rapidly growing sector.
Superfood Market: A Comprehensive Report (2019-2033)
This detailed report provides a comprehensive analysis of the global superfood market, projecting a market value exceeding $XX Million by 2033. The study covers the period from 2019 to 2033, with 2025 as the base and estimated year. It offers actionable insights for industry stakeholders, including manufacturers, distributors, and investors. Key players analyzed include Nature's Superfoods LLP, Raw Nutrition, Aduna Ltd, OMG! Organic Meets Good, Nevitas Organics, Barleans, Mannatech Incorporated, Impact Foods International Ltd, Sunfood, and Naturya Bath. This is not an exhaustive list. The report segments the market by type (Fruits, Vegetables, Grains and Seeds, Herbs and Roots, Other Types) and distribution channel (Supermarkets/Hypermarkets, Online Channels, Convenience Stores/Traditional Grocery Stores, Other Distribution Channels).
Superfood Market Market Concentration & Innovation
The superfood market exhibits a moderately fragmented landscape, with a handful of large players and numerous smaller niche brands. Market share is dynamic, influenced by innovation and consumer preferences. Major players like Barleans and Mannatech Incorporated hold significant shares, but smaller companies are rapidly gaining traction through specialized product offerings. M&A activity has been steadily increasing, with deal values exceeding $XX Million in the last five years. These transactions often involve larger companies acquiring smaller, innovative players to expand their product portfolios and market reach.
- Market Concentration: The Herfindahl-Hirschman Index (HHI) for the superfood market is estimated at XX, indicating a moderately fragmented market.
- Innovation Drivers: Consumer demand for functional foods, technological advancements in processing and packaging, and increasing awareness of health benefits are key innovation drivers.
- Regulatory Frameworks: Stringent regulations regarding labeling, food safety, and organic certification influence market dynamics.
- Product Substitutes: Competition comes from conventional food products and other health supplements.
- End-User Trends: Growing health consciousness, rising disposable incomes, and increased demand for natural and organic products are major end-user trends.
- M&A Activities: XX M&A deals were recorded between 2019 and 2024, with a total deal value exceeding $XX Million.
Superfood Market Industry Trends & Insights
The global superfood market is experiencing robust growth, driven by several key factors. The compound annual growth rate (CAGR) is projected at XX% during the forecast period (2025-2033). Increased consumer awareness of the health benefits of superfoods, the rising prevalence of chronic diseases, and a shift towards preventive healthcare are significant contributors to this growth. Technological advancements in cultivation, processing, and packaging have improved product quality and shelf life. E-commerce platforms have expanded market access, enabling direct-to-consumer sales and reaching broader demographics. However, competitive intensity and fluctuations in raw material prices pose challenges. Market penetration of superfoods in developing economies remains relatively low, offering significant future potential. The rise of personalized nutrition and functional food trends further fuels growth. The report also analyzes shifts in consumer preferences towards convenience, sustainability, and ethically sourced superfoods.
Dominant Markets & Segments in Superfood Market
The North American region dominates the superfood market, driven by high consumer disposable incomes, strong health consciousness, and wide distribution networks. Within this region, the United States holds the largest market share. Among types, fruits and vegetables currently lead the market, followed by grains and seeds. Online channels have experienced exponential growth, becoming a major distribution channel.
- Key Drivers for North American Dominance:
- High disposable incomes
- Strong health awareness
- Well-established distribution networks
- Favorable regulatory environment
- Type Segment Analysis: Fruits and vegetables are favored due to their versatility and perceived health benefits. Grains and seeds are increasingly popular due to their nutritional value and use in various products.
- Distribution Channel Analysis: Online channels show highest growth due to convenience and wider market reach. Supermarkets/Hypermarkets maintain significant share due to established infrastructure.
Superfood Market Product Developments
Recent product developments focus on enhancing product efficacy, convenience, and sustainability. Innovations include the development of novel superfood blends, fortified products, and ready-to-consume options. Companies are leveraging technological advancements in extraction and processing to improve the bioavailability of nutrients. Emphasis is placed on creating products that cater to specific dietary needs and health goals, such as gut health, immune function, and energy boost. The market is witnessing the emergence of sustainable and ethically sourced superfoods, reflecting changing consumer preferences.
Report Scope & Segmentation Analysis
This report segments the superfood market by type: fruits, vegetables, grains and seeds, herbs and roots, and other types. Each segment showcases unique growth projections, market sizes, and competitive dynamics. The market is further segmented by distribution channels: supermarkets/hypermarkets, online channels, convenience stores/traditional grocery stores, and other channels. Each channel segment displays varying growth rates and competitive landscapes, reflecting consumer behavior and market access. The report comprehensively examines each segment, providing detailed insights into market trends, challenges, and opportunities.
Key Drivers of Superfood Market Growth
Several factors propel superfood market expansion: the growing awareness of health and wellness, the increasing prevalence of chronic diseases, the rise of personalized nutrition, and the demand for convenient and functional food products. Technological advancements in cultivation, processing, and packaging have improved product quality and shelf life. Government initiatives promoting healthy eating habits and supportive regulatory frameworks further contribute to market growth. The expansion of e-commerce also plays a significant role.
Challenges in the Superfood Market Sector
The superfood market faces challenges, including fluctuating raw material prices, stringent regulatory requirements for labeling and certification, and maintaining consistent product quality and supply chain integrity. The market's competitive intensity, with many players vying for market share, further creates challenges. Counterfeit products and a lack of standardization also impact the market. The industry also faces challenges related to sustainability and ethical sourcing of superfoods.
Emerging Opportunities in Superfood Market
The superfood market presents promising opportunities, including expanding into emerging markets with rising health consciousness, developing innovative product formats tailored to specific consumer needs, and leveraging technological advancements in cultivation and processing for improved sustainability and efficiency. Opportunities exist for creating products specifically catering to various health goals and lifestyle preferences. Focus on personalized nutrition and subscription models offers considerable potential for future growth.
Leading Players in the Superfood Market Market
- Nature's Superfoods LLP
- Raw Nutrition
- Aduna Ltd
- OMG! Organic Meets Good
- Nevitas Organics
- Barleans
- Mannatech Incorporated
- Impact Foods International Ltd
- Sunfood
- Naturya Bath
Key Developments in Superfood Market Industry
- February 2024: Inka's Berries launched two new blueberry varieties with extended shelf life. This signifies innovation in extending the availability of perishable superfoods.
- March 2024: Spirulina Mater expanded its presence in the US through Walmart.com, highlighting the growing importance of online retail channels.
- March 2024: Gaia Herbs launched a new line of postbiotics, expanding the superfood market into the growing probiotics and gut health sector.
Strategic Outlook for Superfood Market Market
The superfood market is poised for continued growth, fueled by health-conscious consumers and technological advancements. Expansion into new geographical markets, strategic partnerships, and product diversification will play a key role in shaping future market dynamics. Companies focusing on sustainable and ethical sourcing will gain a competitive edge. The growing demand for personalized nutrition and functional foods presents significant opportunities for innovation and market expansion. The market is expected to reach $XX Million by 2033, showcasing substantial future growth potential.
Superfood Market Segmentation
-
1. Type
- 1.1. Fruits
- 1.2. Vegetables
- 1.3. Grains and Seeds
- 1.4. Herbs and Roots
- 1.5. Other Types
-
2. Distribution Channel
- 2.1. Supermarkets/Hypermarkets
- 2.2. Online Channels
- 2.3. Convenience Stores/Traditional Grocery Stores
- 2.4. Other Distribution Channels
Superfood Market Segmentation By Geography
-
1. North America
- 1.1. United States
- 1.2. Canada
- 1.3. Mexico
- 1.4. Rest of North America
-
2. Europe
- 2.1. Germany
- 2.2. United Kingdom
- 2.3. France
- 2.4. Spain
- 2.5. Italy
- 2.6. Russia
- 2.7. Rest of Europe
-
3. Asia Pacific
- 3.1. China
- 3.2. Japan
- 3.3. India
- 3.4. Australia
- 3.5. Rest of Asia Pacific
-
4. South America
- 4.1. Brazil
- 4.2. Argentina
- 4.3. Rest of South America
-
5. Middle East and Africa
- 5.1. South Africa
- 5.2. Saudi Arabia
- 5.3. Rest of Middle East and Africa
Superfood Market REPORT HIGHLIGHTS
| Aspects | Details |
|---|---|
| Study Period | 2019-2033 |
| Base Year | 2024 |
| Estimated Year | 2025 |
| Forecast Period | 2025-2033 |
| Historical Period | 2019-2024 |
| Growth Rate | CAGR of 8.46% from 2019-2033 |
| Segmentation |
|
Table of Contents
- 1. Introduction
- 1.1. Research Scope
- 1.2. Market Segmentation
- 1.3. Research Methodology
- 1.4. Definitions and Assumptions
- 2. Executive Summary
- 2.1. Introduction
- 3. Market Dynamics
- 3.1. Introduction
- 3.2. Market Drivers
- 3.2.1. Rising Health & Wellness Trends with Strategic Initiatives
- 3.3. Market Restrains
- 3.3.1. Cost Considerations Coupled With Availability Of Alternatives
- 3.4. Market Trends
- 3.4.1. Increasing Health and Wellness Trend
- 4. Market Factor Analysis
- 4.1. Porters Five Forces
- 4.2. Supply/Value Chain
- 4.3. PESTEL analysis
- 4.4. Market Entropy
- 4.5. Patent/Trademark Analysis
- 5. Global Superfood Market Analysis, Insights and Forecast, 2019-2031
- 5.1. Market Analysis, Insights and Forecast - by Type
- 5.1.1. Fruits
- 5.1.2. Vegetables
- 5.1.3. Grains and Seeds
- 5.1.4. Herbs and Roots
- 5.1.5. Other Types
- 5.2. Market Analysis, Insights and Forecast - by Distribution Channel
- 5.2.1. Supermarkets/Hypermarkets
- 5.2.2. Online Channels
- 5.2.3. Convenience Stores/Traditional Grocery Stores
- 5.2.4. Other Distribution Channels
- 5.3. Market Analysis, Insights and Forecast - by Region
- 5.3.1. North America
- 5.3.2. Europe
- 5.3.3. Asia Pacific
- 5.3.4. South America
- 5.3.5. Middle East and Africa
- 5.1. Market Analysis, Insights and Forecast - by Type
- 6. North America Superfood Market Analysis, Insights and Forecast, 2019-2031
- 6.1. Market Analysis, Insights and Forecast - by Type
- 6.1.1. Fruits
- 6.1.2. Vegetables
- 6.1.3. Grains and Seeds
- 6.1.4. Herbs and Roots
- 6.1.5. Other Types
- 6.2. Market Analysis, Insights and Forecast - by Distribution Channel
- 6.2.1. Supermarkets/Hypermarkets
- 6.2.2. Online Channels
- 6.2.3. Convenience Stores/Traditional Grocery Stores
- 6.2.4. Other Distribution Channels
- 6.1. Market Analysis, Insights and Forecast - by Type
- 7. Europe Superfood Market Analysis, Insights and Forecast, 2019-2031
- 7.1. Market Analysis, Insights and Forecast - by Type
- 7.1.1. Fruits
- 7.1.2. Vegetables
- 7.1.3. Grains and Seeds
- 7.1.4. Herbs and Roots
- 7.1.5. Other Types
- 7.2. Market Analysis, Insights and Forecast - by Distribution Channel
- 7.2.1. Supermarkets/Hypermarkets
- 7.2.2. Online Channels
- 7.2.3. Convenience Stores/Traditional Grocery Stores
- 7.2.4. Other Distribution Channels
- 7.1. Market Analysis, Insights and Forecast - by Type
- 8. Asia Pacific Superfood Market Analysis, Insights and Forecast, 2019-2031
- 8.1. Market Analysis, Insights and Forecast - by Type
- 8.1.1. Fruits
- 8.1.2. Vegetables
- 8.1.3. Grains and Seeds
- 8.1.4. Herbs and Roots
- 8.1.5. Other Types
- 8.2. Market Analysis, Insights and Forecast - by Distribution Channel
- 8.2.1. Supermarkets/Hypermarkets
- 8.2.2. Online Channels
- 8.2.3. Convenience Stores/Traditional Grocery Stores
- 8.2.4. Other Distribution Channels
- 8.1. Market Analysis, Insights and Forecast - by Type
- 9. South America Superfood Market Analysis, Insights and Forecast, 2019-2031
- 9.1. Market Analysis, Insights and Forecast - by Type
- 9.1.1. Fruits
- 9.1.2. Vegetables
- 9.1.3. Grains and Seeds
- 9.1.4. Herbs and Roots
- 9.1.5. Other Types
- 9.2. Market Analysis, Insights and Forecast - by Distribution Channel
- 9.2.1. Supermarkets/Hypermarkets
- 9.2.2. Online Channels
- 9.2.3. Convenience Stores/Traditional Grocery Stores
- 9.2.4. Other Distribution Channels
- 9.1. Market Analysis, Insights and Forecast - by Type
- 10. Middle East and Africa Superfood Market Analysis, Insights and Forecast, 2019-2031
- 10.1. Market Analysis, Insights and Forecast - by Type
- 10.1.1. Fruits
- 10.1.2. Vegetables
- 10.1.3. Grains and Seeds
- 10.1.4. Herbs and Roots
- 10.1.5. Other Types
- 10.2. Market Analysis, Insights and Forecast - by Distribution Channel
- 10.2.1. Supermarkets/Hypermarkets
- 10.2.2. Online Channels
- 10.2.3. Convenience Stores/Traditional Grocery Stores
- 10.2.4. Other Distribution Channels
- 10.1. Market Analysis, Insights and Forecast - by Type
- 11. North America Superfood Market Analysis, Insights and Forecast, 2019-2031
- 11.1. Market Analysis, Insights and Forecast - By Country/Sub-region
- 11.1.1 United States
- 11.1.2 Canada
- 11.1.3 Mexico
- 11.1.4 Rest of North America
- 12. Europe Superfood Market Analysis, Insights and Forecast, 2019-2031
- 12.1. Market Analysis, Insights and Forecast - By Country/Sub-region
- 12.1.1 Germany
- 12.1.2 United Kingdom
- 12.1.3 France
- 12.1.4 Spain
- 12.1.5 Italy
- 12.1.6 Russia
- 12.1.7 Rest of Europe
- 13. Asia Pacific Superfood Market Analysis, Insights and Forecast, 2019-2031
- 13.1. Market Analysis, Insights and Forecast - By Country/Sub-region
- 13.1.1 China
- 13.1.2 Japan
- 13.1.3 India
- 13.1.4 Australia
- 13.1.5 Rest of Asia Pacific
- 14. South America Superfood Market Analysis, Insights and Forecast, 2019-2031
- 14.1. Market Analysis, Insights and Forecast - By Country/Sub-region
- 14.1.1 Brazil
- 14.1.2 Argentina
- 14.1.3 Rest of South America
- 15. Middle East and Africa Superfood Market Analysis, Insights and Forecast, 2019-2031
- 15.1. Market Analysis, Insights and Forecast - By Country/Sub-region
- 15.1.1 South Africa
- 15.1.2 Saudi Arabia
- 15.1.3 Rest of Middle East and Africa
- 16. Competitive Analysis
- 16.1. Global Market Share Analysis 2024
- 16.2. Company Profiles
- 16.2.1 Nature's Superfoods LLP
- 16.2.1.1. Overview
- 16.2.1.2. Products
- 16.2.1.3. SWOT Analysis
- 16.2.1.4. Recent Developments
- 16.2.1.5. Financials (Based on Availability)
- 16.2.2 Raw Nutrition
- 16.2.2.1. Overview
- 16.2.2.2. Products
- 16.2.2.3. SWOT Analysis
- 16.2.2.4. Recent Developments
- 16.2.2.5. Financials (Based on Availability)
- 16.2.3 Aduna Ltd
- 16.2.3.1. Overview
- 16.2.3.2. Products
- 16.2.3.3. SWOT Analysis
- 16.2.3.4. Recent Developments
- 16.2.3.5. Financials (Based on Availability)
- 16.2.4 OMG! Organic Meets Good
- 16.2.4.1. Overview
- 16.2.4.2. Products
- 16.2.4.3. SWOT Analysis
- 16.2.4.4. Recent Developments
- 16.2.4.5. Financials (Based on Availability)
- 16.2.5 Nevitas Organics*List Not Exhaustive
- 16.2.5.1. Overview
- 16.2.5.2. Products
- 16.2.5.3. SWOT Analysis
- 16.2.5.4. Recent Developments
- 16.2.5.5. Financials (Based on Availability)
- 16.2.6 Barleans
- 16.2.6.1. Overview
- 16.2.6.2. Products
- 16.2.6.3. SWOT Analysis
- 16.2.6.4. Recent Developments
- 16.2.6.5. Financials (Based on Availability)
- 16.2.7 Mannatech Incorporated
- 16.2.7.1. Overview
- 16.2.7.2. Products
- 16.2.7.3. SWOT Analysis
- 16.2.7.4. Recent Developments
- 16.2.7.5. Financials (Based on Availability)
- 16.2.8 Impact Foods International Ltd
- 16.2.8.1. Overview
- 16.2.8.2. Products
- 16.2.8.3. SWOT Analysis
- 16.2.8.4. Recent Developments
- 16.2.8.5. Financials (Based on Availability)
- 16.2.9 Sunfood
- 16.2.9.1. Overview
- 16.2.9.2. Products
- 16.2.9.3. SWOT Analysis
- 16.2.9.4. Recent Developments
- 16.2.9.5. Financials (Based on Availability)
- 16.2.10 Naturya Bath
- 16.2.10.1. Overview
- 16.2.10.2. Products
- 16.2.10.3. SWOT Analysis
- 16.2.10.4. Recent Developments
- 16.2.10.5. Financials (Based on Availability)
- 16.2.1 Nature's Superfoods LLP
List of Figures
- Figure 1: Global Superfood Market Revenue Breakdown (Million, %) by Region 2024 & 2032
- Figure 2: Global Superfood Market Volume Breakdown (K Tons, %) by Region 2024 & 2032
- Figure 3: North America Superfood Market Revenue (Million), by Country 2024 & 2032
- Figure 4: North America Superfood Market Volume (K Tons), by Country 2024 & 2032
- Figure 5: North America Superfood Market Revenue Share (%), by Country 2024 & 2032
- Figure 6: North America Superfood Market Volume Share (%), by Country 2024 & 2032
- Figure 7: Europe Superfood Market Revenue (Million), by Country 2024 & 2032
- Figure 8: Europe Superfood Market Volume (K Tons), by Country 2024 & 2032
- Figure 9: Europe Superfood Market Revenue Share (%), by Country 2024 & 2032
- Figure 10: Europe Superfood Market Volume Share (%), by Country 2024 & 2032
- Figure 11: Asia Pacific Superfood Market Revenue (Million), by Country 2024 & 2032
- Figure 12: Asia Pacific Superfood Market Volume (K Tons), by Country 2024 & 2032
- Figure 13: Asia Pacific Superfood Market Revenue Share (%), by Country 2024 & 2032
- Figure 14: Asia Pacific Superfood Market Volume Share (%), by Country 2024 & 2032
- Figure 15: South America Superfood Market Revenue (Million), by Country 2024 & 2032
- Figure 16: South America Superfood Market Volume (K Tons), by Country 2024 & 2032
- Figure 17: South America Superfood Market Revenue Share (%), by Country 2024 & 2032
- Figure 18: South America Superfood Market Volume Share (%), by Country 2024 & 2032
- Figure 19: Middle East and Africa Superfood Market Revenue (Million), by Country 2024 & 2032
- Figure 20: Middle East and Africa Superfood Market Volume (K Tons), by Country 2024 & 2032
- Figure 21: Middle East and Africa Superfood Market Revenue Share (%), by Country 2024 & 2032
- Figure 22: Middle East and Africa Superfood Market Volume Share (%), by Country 2024 & 2032
- Figure 23: North America Superfood Market Revenue (Million), by Type 2024 & 2032
- Figure 24: North America Superfood Market Volume (K Tons), by Type 2024 & 2032
- Figure 25: North America Superfood Market Revenue Share (%), by Type 2024 & 2032
- Figure 26: North America Superfood Market Volume Share (%), by Type 2024 & 2032
- Figure 27: North America Superfood Market Revenue (Million), by Distribution Channel 2024 & 2032
- Figure 28: North America Superfood Market Volume (K Tons), by Distribution Channel 2024 & 2032
- Figure 29: North America Superfood Market Revenue Share (%), by Distribution Channel 2024 & 2032
- Figure 30: North America Superfood Market Volume Share (%), by Distribution Channel 2024 & 2032
- Figure 31: North America Superfood Market Revenue (Million), by Country 2024 & 2032
- Figure 32: North America Superfood Market Volume (K Tons), by Country 2024 & 2032
- Figure 33: North America Superfood Market Revenue Share (%), by Country 2024 & 2032
- Figure 34: North America Superfood Market Volume Share (%), by Country 2024 & 2032
- Figure 35: Europe Superfood Market Revenue (Million), by Type 2024 & 2032
- Figure 36: Europe Superfood Market Volume (K Tons), by Type 2024 & 2032
- Figure 37: Europe Superfood Market Revenue Share (%), by Type 2024 & 2032
- Figure 38: Europe Superfood Market Volume Share (%), by Type 2024 & 2032
- Figure 39: Europe Superfood Market Revenue (Million), by Distribution Channel 2024 & 2032
- Figure 40: Europe Superfood Market Volume (K Tons), by Distribution Channel 2024 & 2032
- Figure 41: Europe Superfood Market Revenue Share (%), by Distribution Channel 2024 & 2032
- Figure 42: Europe Superfood Market Volume Share (%), by Distribution Channel 2024 & 2032
- Figure 43: Europe Superfood Market Revenue (Million), by Country 2024 & 2032
- Figure 44: Europe Superfood Market Volume (K Tons), by Country 2024 & 2032
- Figure 45: Europe Superfood Market Revenue Share (%), by Country 2024 & 2032
- Figure 46: Europe Superfood Market Volume Share (%), by Country 2024 & 2032
- Figure 47: Asia Pacific Superfood Market Revenue (Million), by Type 2024 & 2032
- Figure 48: Asia Pacific Superfood Market Volume (K Tons), by Type 2024 & 2032
- Figure 49: Asia Pacific Superfood Market Revenue Share (%), by Type 2024 & 2032
- Figure 50: Asia Pacific Superfood Market Volume Share (%), by Type 2024 & 2032
- Figure 51: Asia Pacific Superfood Market Revenue (Million), by Distribution Channel 2024 & 2032
- Figure 52: Asia Pacific Superfood Market Volume (K Tons), by Distribution Channel 2024 & 2032
- Figure 53: Asia Pacific Superfood Market Revenue Share (%), by Distribution Channel 2024 & 2032
- Figure 54: Asia Pacific Superfood Market Volume Share (%), by Distribution Channel 2024 & 2032
- Figure 55: Asia Pacific Superfood Market Revenue (Million), by Country 2024 & 2032
- Figure 56: Asia Pacific Superfood Market Volume (K Tons), by Country 2024 & 2032
- Figure 57: Asia Pacific Superfood Market Revenue Share (%), by Country 2024 & 2032
- Figure 58: Asia Pacific Superfood Market Volume Share (%), by Country 2024 & 2032
- Figure 59: South America Superfood Market Revenue (Million), by Type 2024 & 2032
- Figure 60: South America Superfood Market Volume (K Tons), by Type 2024 & 2032
- Figure 61: South America Superfood Market Revenue Share (%), by Type 2024 & 2032
- Figure 62: South America Superfood Market Volume Share (%), by Type 2024 & 2032
- Figure 63: South America Superfood Market Revenue (Million), by Distribution Channel 2024 & 2032
- Figure 64: South America Superfood Market Volume (K Tons), by Distribution Channel 2024 & 2032
- Figure 65: South America Superfood Market Revenue Share (%), by Distribution Channel 2024 & 2032
- Figure 66: South America Superfood Market Volume Share (%), by Distribution Channel 2024 & 2032
- Figure 67: South America Superfood Market Revenue (Million), by Country 2024 & 2032
- Figure 68: South America Superfood Market Volume (K Tons), by Country 2024 & 2032
- Figure 69: South America Superfood Market Revenue Share (%), by Country 2024 & 2032
- Figure 70: South America Superfood Market Volume Share (%), by Country 2024 & 2032
- Figure 71: Middle East and Africa Superfood Market Revenue (Million), by Type 2024 & 2032
- Figure 72: Middle East and Africa Superfood Market Volume (K Tons), by Type 2024 & 2032
- Figure 73: Middle East and Africa Superfood Market Revenue Share (%), by Type 2024 & 2032
- Figure 74: Middle East and Africa Superfood Market Volume Share (%), by Type 2024 & 2032
- Figure 75: Middle East and Africa Superfood Market Revenue (Million), by Distribution Channel 2024 & 2032
- Figure 76: Middle East and Africa Superfood Market Volume (K Tons), by Distribution Channel 2024 & 2032
- Figure 77: Middle East and Africa Superfood Market Revenue Share (%), by Distribution Channel 2024 & 2032
- Figure 78: Middle East and Africa Superfood Market Volume Share (%), by Distribution Channel 2024 & 2032
- Figure 79: Middle East and Africa Superfood Market Revenue (Million), by Country 2024 & 2032
- Figure 80: Middle East and Africa Superfood Market Volume (K Tons), by Country 2024 & 2032
- Figure 81: Middle East and Africa Superfood Market Revenue Share (%), by Country 2024 & 2032
- Figure 82: Middle East and Africa Superfood Market Volume Share (%), by Country 2024 & 2032
List of Tables
- Table 1: Global Superfood Market Revenue Million Forecast, by Region 2019 & 2032
- Table 2: Global Superfood Market Volume K Tons Forecast, by Region 2019 & 2032
- Table 3: Global Superfood Market Revenue Million Forecast, by Type 2019 & 2032
- Table 4: Global Superfood Market Volume K Tons Forecast, by Type 2019 & 2032
- Table 5: Global Superfood Market Revenue Million Forecast, by Distribution Channel 2019 & 2032
- Table 6: Global Superfood Market Volume K Tons Forecast, by Distribution Channel 2019 & 2032
- Table 7: Global Superfood Market Revenue Million Forecast, by Region 2019 & 2032
- Table 8: Global Superfood Market Volume K Tons Forecast, by Region 2019 & 2032
- Table 9: Global Superfood Market Revenue Million Forecast, by Country 2019 & 2032
- Table 10: Global Superfood Market Volume K Tons Forecast, by Country 2019 & 2032
- Table 11: United States Superfood Market Revenue (Million) Forecast, by Application 2019 & 2032
- Table 12: United States Superfood Market Volume (K Tons) Forecast, by Application 2019 & 2032
- Table 13: Canada Superfood Market Revenue (Million) Forecast, by Application 2019 & 2032
- Table 14: Canada Superfood Market Volume (K Tons) Forecast, by Application 2019 & 2032
- Table 15: Mexico Superfood Market Revenue (Million) Forecast, by Application 2019 & 2032
- Table 16: Mexico Superfood Market Volume (K Tons) Forecast, by Application 2019 & 2032
- Table 17: Rest of North America Superfood Market Revenue (Million) Forecast, by Application 2019 & 2032
- Table 18: Rest of North America Superfood Market Volume (K Tons) Forecast, by Application 2019 & 2032
- Table 19: Global Superfood Market Revenue Million Forecast, by Country 2019 & 2032
- Table 20: Global Superfood Market Volume K Tons Forecast, by Country 2019 & 2032
- Table 21: Germany Superfood Market Revenue (Million) Forecast, by Application 2019 & 2032
- Table 22: Germany Superfood Market Volume (K Tons) Forecast, by Application 2019 & 2032
- Table 23: United Kingdom Superfood Market Revenue (Million) Forecast, by Application 2019 & 2032
- Table 24: United Kingdom Superfood Market Volume (K Tons) Forecast, by Application 2019 & 2032
- Table 25: France Superfood Market Revenue (Million) Forecast, by Application 2019 & 2032
- Table 26: France Superfood Market Volume (K Tons) Forecast, by Application 2019 & 2032
- Table 27: Spain Superfood Market Revenue (Million) Forecast, by Application 2019 & 2032
- Table 28: Spain Superfood Market Volume (K Tons) Forecast, by Application 2019 & 2032
- Table 29: Italy Superfood Market Revenue (Million) Forecast, by Application 2019 & 2032
- Table 30: Italy Superfood Market Volume (K Tons) Forecast, by Application 2019 & 2032
- Table 31: Russia Superfood Market Revenue (Million) Forecast, by Application 2019 & 2032
- Table 32: Russia Superfood Market Volume (K Tons) Forecast, by Application 2019 & 2032
- Table 33: Rest of Europe Superfood Market Revenue (Million) Forecast, by Application 2019 & 2032
- Table 34: Rest of Europe Superfood Market Volume (K Tons) Forecast, by Application 2019 & 2032
- Table 35: Global Superfood Market Revenue Million Forecast, by Country 2019 & 2032
- Table 36: Global Superfood Market Volume K Tons Forecast, by Country 2019 & 2032
- Table 37: China Superfood Market Revenue (Million) Forecast, by Application 2019 & 2032
- Table 38: China Superfood Market Volume (K Tons) Forecast, by Application 2019 & 2032
- Table 39: Japan Superfood Market Revenue (Million) Forecast, by Application 2019 & 2032
- Table 40: Japan Superfood Market Volume (K Tons) Forecast, by Application 2019 & 2032
- Table 41: India Superfood Market Revenue (Million) Forecast, by Application 2019 & 2032
- Table 42: India Superfood Market Volume (K Tons) Forecast, by Application 2019 & 2032
- Table 43: Australia Superfood Market Revenue (Million) Forecast, by Application 2019 & 2032
- Table 44: Australia Superfood Market Volume (K Tons) Forecast, by Application 2019 & 2032
- Table 45: Rest of Asia Pacific Superfood Market Revenue (Million) Forecast, by Application 2019 & 2032
- Table 46: Rest of Asia Pacific Superfood Market Volume (K Tons) Forecast, by Application 2019 & 2032
- Table 47: Global Superfood Market Revenue Million Forecast, by Country 2019 & 2032
- Table 48: Global Superfood Market Volume K Tons Forecast, by Country 2019 & 2032
- Table 49: Brazil Superfood Market Revenue (Million) Forecast, by Application 2019 & 2032
- Table 50: Brazil Superfood Market Volume (K Tons) Forecast, by Application 2019 & 2032
- Table 51: Argentina Superfood Market Revenue (Million) Forecast, by Application 2019 & 2032
- Table 52: Argentina Superfood Market Volume (K Tons) Forecast, by Application 2019 & 2032
- Table 53: Rest of South America Superfood Market Revenue (Million) Forecast, by Application 2019 & 2032
- Table 54: Rest of South America Superfood Market Volume (K Tons) Forecast, by Application 2019 & 2032
- Table 55: Global Superfood Market Revenue Million Forecast, by Country 2019 & 2032
- Table 56: Global Superfood Market Volume K Tons Forecast, by Country 2019 & 2032
- Table 57: South Africa Superfood Market Revenue (Million) Forecast, by Application 2019 & 2032
- Table 58: South Africa Superfood Market Volume (K Tons) Forecast, by Application 2019 & 2032
- Table 59: Saudi Arabia Superfood Market Revenue (Million) Forecast, by Application 2019 & 2032
- Table 60: Saudi Arabia Superfood Market Volume (K Tons) Forecast, by Application 2019 & 2032
- Table 61: Rest of Middle East and Africa Superfood Market Revenue (Million) Forecast, by Application 2019 & 2032
- Table 62: Rest of Middle East and Africa Superfood Market Volume (K Tons) Forecast, by Application 2019 & 2032
- Table 63: Global Superfood Market Revenue Million Forecast, by Type 2019 & 2032
- Table 64: Global Superfood Market Volume K Tons Forecast, by Type 2019 & 2032
- Table 65: Global Superfood Market Revenue Million Forecast, by Distribution Channel 2019 & 2032
- Table 66: Global Superfood Market Volume K Tons Forecast, by Distribution Channel 2019 & 2032
- Table 67: Global Superfood Market Revenue Million Forecast, by Country 2019 & 2032
- Table 68: Global Superfood Market Volume K Tons Forecast, by Country 2019 & 2032
- Table 69: United States Superfood Market Revenue (Million) Forecast, by Application 2019 & 2032
- Table 70: United States Superfood Market Volume (K Tons) Forecast, by Application 2019 & 2032
- Table 71: Canada Superfood Market Revenue (Million) Forecast, by Application 2019 & 2032
- Table 72: Canada Superfood Market Volume (K Tons) Forecast, by Application 2019 & 2032
- Table 73: Mexico Superfood Market Revenue (Million) Forecast, by Application 2019 & 2032
- Table 74: Mexico Superfood Market Volume (K Tons) Forecast, by Application 2019 & 2032
- Table 75: Rest of North America Superfood Market Revenue (Million) Forecast, by Application 2019 & 2032
- Table 76: Rest of North America Superfood Market Volume (K Tons) Forecast, by Application 2019 & 2032
- Table 77: Global Superfood Market Revenue Million Forecast, by Type 2019 & 2032
- Table 78: Global Superfood Market Volume K Tons Forecast, by Type 2019 & 2032
- Table 79: Global Superfood Market Revenue Million Forecast, by Distribution Channel 2019 & 2032
- Table 80: Global Superfood Market Volume K Tons Forecast, by Distribution Channel 2019 & 2032
- Table 81: Global Superfood Market Revenue Million Forecast, by Country 2019 & 2032
- Table 82: Global Superfood Market Volume K Tons Forecast, by Country 2019 & 2032
- Table 83: Germany Superfood Market Revenue (Million) Forecast, by Application 2019 & 2032
- Table 84: Germany Superfood Market Volume (K Tons) Forecast, by Application 2019 & 2032
- Table 85: United Kingdom Superfood Market Revenue (Million) Forecast, by Application 2019 & 2032
- Table 86: United Kingdom Superfood Market Volume (K Tons) Forecast, by Application 2019 & 2032
- Table 87: France Superfood Market Revenue (Million) Forecast, by Application 2019 & 2032
- Table 88: France Superfood Market Volume (K Tons) Forecast, by Application 2019 & 2032
- Table 89: Spain Superfood Market Revenue (Million) Forecast, by Application 2019 & 2032
- Table 90: Spain Superfood Market Volume (K Tons) Forecast, by Application 2019 & 2032
- Table 91: Italy Superfood Market Revenue (Million) Forecast, by Application 2019 & 2032
- Table 92: Italy Superfood Market Volume (K Tons) Forecast, by Application 2019 & 2032
- Table 93: Russia Superfood Market Revenue (Million) Forecast, by Application 2019 & 2032
- Table 94: Russia Superfood Market Volume (K Tons) Forecast, by Application 2019 & 2032
- Table 95: Rest of Europe Superfood Market Revenue (Million) Forecast, by Application 2019 & 2032
- Table 96: Rest of Europe Superfood Market Volume (K Tons) Forecast, by Application 2019 & 2032
- Table 97: Global Superfood Market Revenue Million Forecast, by Type 2019 & 2032
- Table 98: Global Superfood Market Volume K Tons Forecast, by Type 2019 & 2032
- Table 99: Global Superfood Market Revenue Million Forecast, by Distribution Channel 2019 & 2032
- Table 100: Global Superfood Market Volume K Tons Forecast, by Distribution Channel 2019 & 2032
- Table 101: Global Superfood Market Revenue Million Forecast, by Country 2019 & 2032
- Table 102: Global Superfood Market Volume K Tons Forecast, by Country 2019 & 2032
- Table 103: China Superfood Market Revenue (Million) Forecast, by Application 2019 & 2032
- Table 104: China Superfood Market Volume (K Tons) Forecast, by Application 2019 & 2032
- Table 105: Japan Superfood Market Revenue (Million) Forecast, by Application 2019 & 2032
- Table 106: Japan Superfood Market Volume (K Tons) Forecast, by Application 2019 & 2032
- Table 107: India Superfood Market Revenue (Million) Forecast, by Application 2019 & 2032
- Table 108: India Superfood Market Volume (K Tons) Forecast, by Application 2019 & 2032
- Table 109: Australia Superfood Market Revenue (Million) Forecast, by Application 2019 & 2032
- Table 110: Australia Superfood Market Volume (K Tons) Forecast, by Application 2019 & 2032
- Table 111: Rest of Asia Pacific Superfood Market Revenue (Million) Forecast, by Application 2019 & 2032
- Table 112: Rest of Asia Pacific Superfood Market Volume (K Tons) Forecast, by Application 2019 & 2032
- Table 113: Global Superfood Market Revenue Million Forecast, by Type 2019 & 2032
- Table 114: Global Superfood Market Volume K Tons Forecast, by Type 2019 & 2032
- Table 115: Global Superfood Market Revenue Million Forecast, by Distribution Channel 2019 & 2032
- Table 116: Global Superfood Market Volume K Tons Forecast, by Distribution Channel 2019 & 2032
- Table 117: Global Superfood Market Revenue Million Forecast, by Country 2019 & 2032
- Table 118: Global Superfood Market Volume K Tons Forecast, by Country 2019 & 2032
- Table 119: Brazil Superfood Market Revenue (Million) Forecast, by Application 2019 & 2032
- Table 120: Brazil Superfood Market Volume (K Tons) Forecast, by Application 2019 & 2032
- Table 121: Argentina Superfood Market Revenue (Million) Forecast, by Application 2019 & 2032
- Table 122: Argentina Superfood Market Volume (K Tons) Forecast, by Application 2019 & 2032
- Table 123: Rest of South America Superfood Market Revenue (Million) Forecast, by Application 2019 & 2032
- Table 124: Rest of South America Superfood Market Volume (K Tons) Forecast, by Application 2019 & 2032
- Table 125: Global Superfood Market Revenue Million Forecast, by Type 2019 & 2032
- Table 126: Global Superfood Market Volume K Tons Forecast, by Type 2019 & 2032
- Table 127: Global Superfood Market Revenue Million Forecast, by Distribution Channel 2019 & 2032
- Table 128: Global Superfood Market Volume K Tons Forecast, by Distribution Channel 2019 & 2032
- Table 129: Global Superfood Market Revenue Million Forecast, by Country 2019 & 2032
- Table 130: Global Superfood Market Volume K Tons Forecast, by Country 2019 & 2032
- Table 131: South Africa Superfood Market Revenue (Million) Forecast, by Application 2019 & 2032
- Table 132: South Africa Superfood Market Volume (K Tons) Forecast, by Application 2019 & 2032
- Table 133: Saudi Arabia Superfood Market Revenue (Million) Forecast, by Application 2019 & 2032
- Table 134: Saudi Arabia Superfood Market Volume (K Tons) Forecast, by Application 2019 & 2032
- Table 135: Rest of Middle East and Africa Superfood Market Revenue (Million) Forecast, by Application 2019 & 2032
- Table 136: Rest of Middle East and Africa Superfood Market Volume (K Tons) Forecast, by Application 2019 & 2032
Frequently Asked Questions
1. What is the projected Compound Annual Growth Rate (CAGR) of the Superfood Market?
The projected CAGR is approximately 8.46%.
2. Which companies are prominent players in the Superfood Market?
Key companies in the market include Nature's Superfoods LLP, Raw Nutrition, Aduna Ltd, OMG! Organic Meets Good, Nevitas Organics*List Not Exhaustive, Barleans, Mannatech Incorporated, Impact Foods International Ltd, Sunfood, Naturya Bath.
3. What are the main segments of the Superfood Market?
The market segments include Type, Distribution Channel.
4. Can you provide details about the market size?
The market size is estimated to be USD 144.03 Million as of 2022.
5. What are some drivers contributing to market growth?
Rising Health & Wellness Trends with Strategic Initiatives.
6. What are the notable trends driving market growth?
Increasing Health and Wellness Trend.
7. Are there any restraints impacting market growth?
Cost Considerations Coupled With Availability Of Alternatives.
8. Can you provide examples of recent developments in the market?
March 2024: Gaia Herbs launched a new line of postbiotics fermented from traditional superfoods such as turmeric, ginger, and kimchi. The company targets the gut health market with these products, designed to provide beneficial bacteria and prebiotics for improved digestion and immune system function.
9. What pricing options are available for accessing the report?
Pricing options include single-user, multi-user, and enterprise licenses priced at USD 4750, USD 5250, and USD 8750 respectively.
10. Is the market size provided in terms of value or volume?
The market size is provided in terms of value, measured in Million and volume, measured in K Tons.
11. Are there any specific market keywords associated with the report?
Yes, the market keyword associated with the report is "Superfood Market," which aids in identifying and referencing the specific market segment covered.
12. How do I determine which pricing option suits my needs best?
The pricing options vary based on user requirements and access needs. Individual users may opt for single-user licenses, while businesses requiring broader access may choose multi-user or enterprise licenses for cost-effective access to the report.
13. Are there any additional resources or data provided in the Superfood Market report?
While the report offers comprehensive insights, it's advisable to review the specific contents or supplementary materials provided to ascertain if additional resources or data are available.
14. How can I stay updated on further developments or reports in the Superfood Market?
To stay informed about further developments, trends, and reports in the Superfood Market, consider subscribing to industry newsletters, following relevant companies and organizations, or regularly checking reputable industry news sources and publications.
Methodology
Step 1 - Identification of Relevant Samples Size from Population Database


Step 2 - Approaches for Defining Global Market Size (Value, Volume* & Price*)

Note*: In applicable scenarios
Step 3 - Data Sources
Primary Research
- Web Analytics
- Survey Reports
- Research Institute
- Latest Research Reports
- Opinion Leaders
Secondary Research
- Annual Reports
- White Paper
- Latest Press Release
- Industry Association
- Paid Database
- Investor Presentations

Step 4 - Data Triangulation
Involves using different sources of information in order to increase the validity of a study
These sources are likely to be stakeholders in a program - participants, other researchers, program staff, other community members, and so on.
Then we put all data in single framework & apply various statistical tools to find out the dynamic on the market.
During the analysis stage, feedback from the stakeholder groups would be compared to determine areas of agreement as well as areas of divergence


