
Key Insights
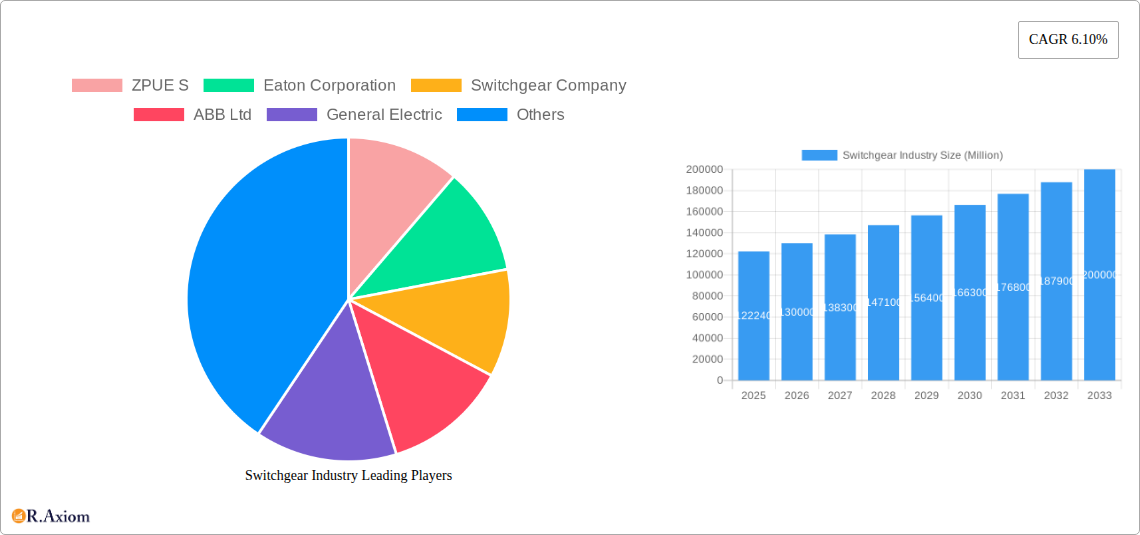
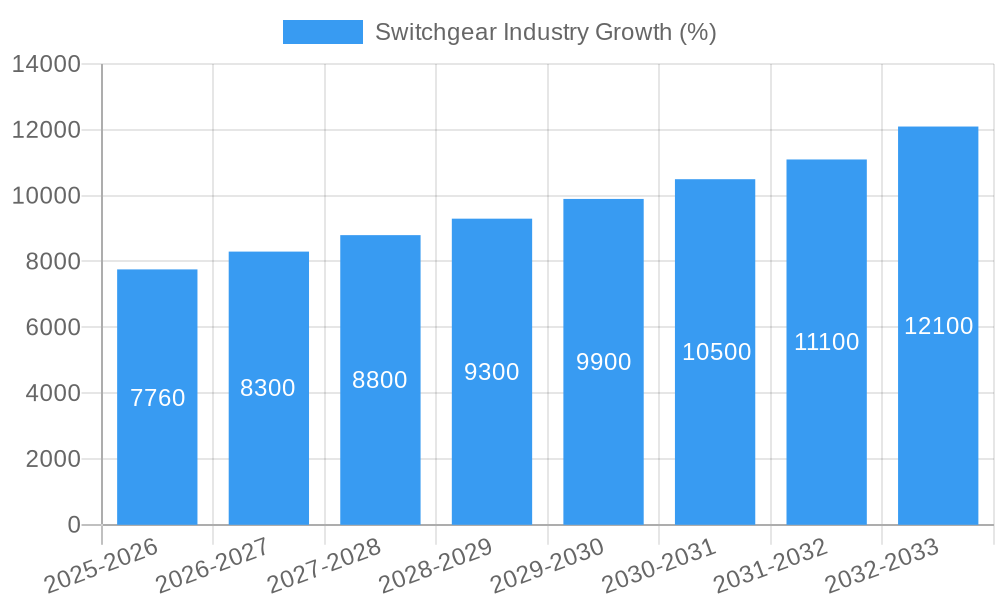
The global switchgear market, valued at $122.24 billion in 2025, is projected to experience robust growth, driven by the increasing demand for reliable power distribution across residential, commercial, and industrial sectors. A Compound Annual Growth Rate (CAGR) of 6.10% from 2025 to 2033 indicates a significant expansion of the market, reaching an estimated value exceeding $200 billion by 2033. Key drivers include the rising urbanization and industrialization globally, necessitating advanced and reliable power infrastructure. The growing adoption of renewable energy sources, coupled with smart grid initiatives, is further fueling market expansion. Technological advancements in switchgear, such as the development of gas-insulated switchgear (GIS) and solid-state circuit breakers, are enhancing efficiency and reliability, thereby contributing to market growth. However, high initial investment costs associated with advanced switchgear technologies and stringent regulatory compliance requirements pose certain challenges to market expansion. The market is segmented by type (high-voltage insulation, other insulation types, installation) and end-user industry (commercial, residential, industrial), with the industrial segment expected to dominate due to the substantial power requirements of manufacturing facilities. Leading companies such as ABB Ltd, Siemens AG, Schneider Electric SE, and Eaton Corporation are at the forefront of innovation and market share, driving competition and technological advancements within the industry. Geographical expansion is also a significant factor, with growth expected across regions such as Asia-Pacific, fueled by rapid economic development and infrastructure projects.
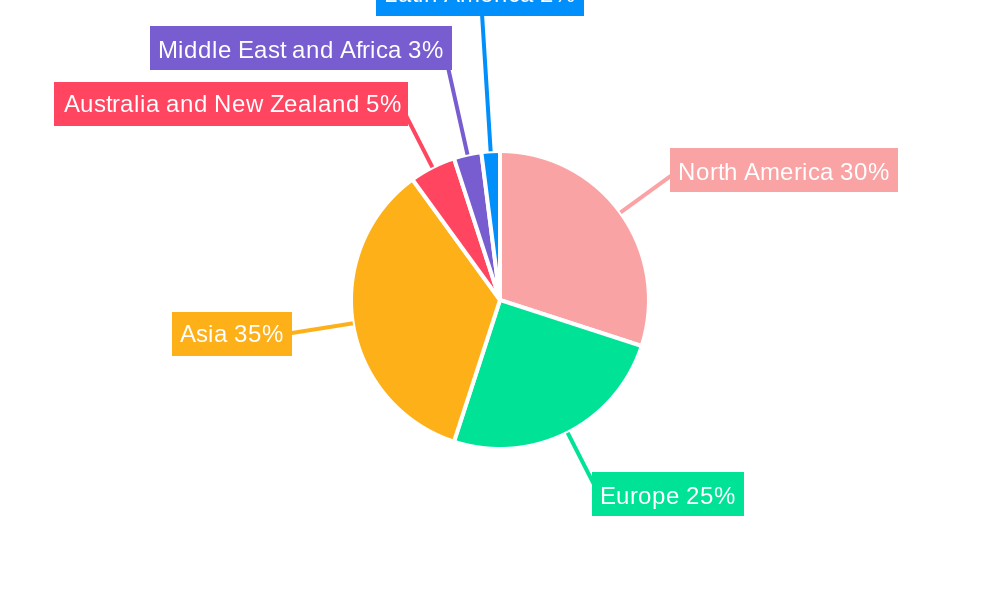
The market segmentation offers strategic insights for businesses seeking to gain a competitive edge. High-voltage insulation and installation services command a significant share of the market, primarily driven by large-scale industrial and utility projects. The residential sector, while experiencing steady growth, demonstrates a lower per-unit expenditure compared to commercial and industrial segments. However, growing concerns about power reliability and safety are leading to increased adoption of advanced switchgear solutions in residential settings, representing a lucrative opportunity for market players. The regional analysis reveals a dynamic landscape with North America and Europe retaining significant market shares due to established infrastructure and technological advancements. However, the Asia-Pacific region is exhibiting the fastest growth rate, driven by burgeoning industrialization and significant infrastructure development initiatives. Understanding these regional dynamics and segment-specific trends is crucial for businesses to tailor their strategies and optimize market penetration.
Switchgear Industry Market Report: 2019-2033
This comprehensive report provides a detailed analysis of the global switchgear industry, offering valuable insights for stakeholders, investors, and industry professionals. With a study period spanning 2019-2033, a base year of 2025, and a forecast period of 2025-2033, this report covers market size, segmentation, key players, technological advancements, and future growth projections. The market is valued at $xx Million in 2025 and is projected to reach $xx Million by 2033.
Switchgear Industry Market Concentration & Innovation
The global switchgear market is moderately concentrated, with several major players holding significant market share. Key companies such as ABB Ltd, Siemens AG, Schneider Electric SE, General Electric, and Eaton Corporation dominate the landscape. However, regional players and specialized manufacturers also contribute significantly to the market's overall dynamism. Market share data for 2025 indicates that ABB Ltd holds approximately xx% of the market share, followed by Siemens AG with xx%, and Schneider Electric SE with xx%. The remaining share is distributed among other major and regional players.
Innovation is driven by increasing demand for energy-efficient, reliable, and smart grid solutions. Stringent regulatory frameworks focused on safety and environmental compliance further fuel innovation. The industry faces competition from alternative technologies, although these are limited in scope. Mergers and acquisitions (M&A) activity remains relatively frequent, with deal values in the range of $xx Million to $xx Million annually over the past five years, reflecting industry consolidation and strategic expansion efforts. Recent M&A activity has focused on expanding product portfolios and geographical reach, and on incorporating digital technologies to improve efficiency.
Switchgear Industry Industry Trends & Insights
The switchgear market is experiencing significant growth, driven by factors such as the global rise in energy consumption, rapid urbanization, and the expansion of renewable energy sources. The market is witnessing a Compound Annual Growth Rate (CAGR) of xx% during the forecast period (2025-2033), indicating robust expansion. Technological disruptions, particularly the integration of digital technologies like IoT and AI, are transforming the switchgear landscape, leading to smarter, more efficient, and predictive maintenance solutions. This digitalization is enhancing grid stability and reliability while reducing operational costs. Consumer preferences are increasingly shifting toward sustainable and environmentally friendly solutions, boosting demand for eco-friendly switchgear incorporating recyclable materials and reducing greenhouse gas emissions. Competitive dynamics are characterized by ongoing innovation, product differentiation, and strategic partnerships to expand market reach and enhance service offerings. Market penetration of digital switchgear solutions is projected to reach xx% by 2033.
Dominant Markets & Segments in Switchgear Industry
The industrial sector is the dominant end-user segment in the global switchgear market, accounting for the largest share of revenue, driven by the increasing electrification of industrial processes and manufacturing facilities. High-voltage switchgear dominates the market by type due to its application in large-scale power transmission and distribution networks. The Asia-Pacific region exhibits the strongest growth trajectory, fueled by rapid industrialization, infrastructure development, and increasing power demand.
Key Drivers for Industrial Sector Dominance:
- Increased industrial automation and electrification
- Expansion of manufacturing facilities across emerging economies
- Rising demand for reliable and efficient power distribution in industries.
Key Drivers for High-Voltage Segment Dominance:
- Growing power transmission and distribution networks
- Increasing electricity demand from industrial and commercial sectors
- Investments in smart grid infrastructure.
Key Drivers for Asia-Pacific Regional Dominance:
- Rapid industrialization and economic growth
- Significant investments in infrastructure projects
- Growing demand for electricity from burgeoning populations.
Switchgear Industry Product Developments
Recent product innovations center on digitalization, smart grid integration, and enhanced safety features. Manufacturers are focusing on developing environmentally friendly solutions and improving the efficiency and reliability of switchgear systems. For example, the introduction of gas-insulated switchgear (GIS) with eco-friendly insulation materials represents a significant step towards sustainability. The integration of sensors and data analytics is enabling predictive maintenance and remote monitoring, minimizing downtime and operational costs. These advancements enhance the competitive advantage by offering improved efficiency, safety, and environmental performance, tailored to the needs of a modern power grid.
Report Scope & Segmentation Analysis
This report segments the switchgear market by type (voltage – low voltage, medium voltage, high voltage; insulation – air, SF6 gas, vacuum; installation – indoor, outdoor) and end-user industry (commercial, residential, industrial).
By Voltage: The high-voltage segment commands the largest share and exhibits strong growth due to large-scale grid infrastructure projects. Medium-voltage is experiencing significant growth due to industrial and commercial building expansions. Low-voltage remains a substantial segment due to its widespread use in residential and commercial installations.
By Insulation: SF6 gas is currently the most widely used insulation material, but its environmental impact is driving innovation towards alternative insulation materials like vacuum and air.
By Installation: Indoor installation is expected to dominate, followed by outdoor installations, driven by the need for reliable power distribution across diverse geographical locations.
By End-User Industry: The industrial sector continues to drive market growth, although commercial and residential segments are also seeing increasing demand.
Key Drivers of Switchgear Industry Growth
Several factors are propelling the growth of the switchgear industry. These include increasing electricity demand driven by population growth and industrialization, the expansion of renewable energy sources necessitating efficient integration into the grid, and increasing investments in smart grid infrastructure for better power management and reduced energy losses. Stringent government regulations mandating improved power grid safety and reliability, coupled with significant investments in infrastructure projects, also contribute to market growth. Furthermore, the growing adoption of digital technologies for improved grid monitoring and remote operations further drives market expansion.
Challenges in the Switchgear Industry Sector
The switchgear industry faces challenges such as fluctuating raw material prices impacting production costs, stringent regulatory compliance requirements demanding substantial investments, and intense competition among major manufacturers putting pressure on profit margins. Supply chain disruptions can lead to production delays, impacting market availability and potentially affecting customer satisfaction. Furthermore, the need for skilled labor to handle and install sophisticated switchgear systems presents a persistent challenge. These challenges, if not properly addressed, could hamper the growth of the industry in the coming years.
Emerging Opportunities in Switchgear Industry
The switchgear industry is poised for substantial growth fueled by the adoption of innovative technologies, such as the integration of AI and machine learning for predictive maintenance and real-time grid monitoring. The increasing deployment of renewable energy sources presents a massive opportunity, demanding robust and efficient grid integration solutions. Emerging markets in developing economies present significant growth potential. Furthermore, the growing emphasis on smart city initiatives and the adoption of sustainable energy solutions are further creating numerous opportunities for the growth of the switchgear industry.
Leading Players in the Switchgear Industry Market
- ZPUE S
- Eaton Corporation
- Switchgear Company
- ABB Ltd
- General Electric
- Orecco Electric
- Fuji Electric Co Ltd
- Crompton Greaves Power and Industrial Solutions Limited
- Toshiba International Corporation
- Hubbell Incorporated
- Hitachi Ltd
- Mitsubishi Electric Corporation
- Siemens AG
- Schneider Electric SE
- Powell Industries Inc
- Meidensha Corporation
- Havells India Limited
Key Developments in Switchgear Industry Industry
October 2023: Siemens Smart Infrastructure launched eco-friendly, digital medium-voltage switchgear, including the F-gas-free blue GIS primary switchgear and enhanced NXPLUS C 24, focusing on sustainability and high-end ratings. This significantly impacts market dynamics by promoting environmentally conscious choices and enhancing grid efficiency.
February 2024: Schneider Electric introduced SureSeT Medium Voltage (MV) switchgear for the Canadian market, featuring the EvoPacT circuit breaker and digital services for improved efficiency, remote control, and faster problem detection. This launch significantly impacts the market by providing advanced, digitally integrated switchgear solutions.
Strategic Outlook for Switchgear Industry Market
The switchgear industry is poised for sustained growth driven by several converging factors. The increasing adoption of renewable energy sources, coupled with significant investments in smart grid infrastructure, creates a strong demand for reliable and efficient switchgear solutions. Technological advancements, particularly in digitalization and the integration of AI, will continue to transform the industry, creating new opportunities for innovation and market expansion. Emerging markets in developing economies present substantial growth potential. The focus on sustainability and environmental considerations further drives the demand for eco-friendly and efficient switchgear, setting the stage for continued market expansion in the coming years.
Switchgear Industry Segmentation
-
1. Type
-
1.1. Voltage
- 1.1.1. Low-voltage
- 1.1.2. Medium-voltage
- 1.1.3. High-voltage
-
1.2. Insulation
- 1.2.1. Gas -insulated Switchgear (GIS)
- 1.2.2. Air-insulated Switchgear (AIS)
- 1.2.3. Other Insulation Types
-
1.3. Installation
- 1.3.1. Indoor
- 1.3.2. Outdoor
-
1.1. Voltage
-
2. End-user Industry
- 2.1. Commercial
- 2.2. Residential
- 2.3. Industrial
Switchgear Industry Segmentation By Geography
- 1. North America
- 2. Europe
- 3. Asia
- 4. Australia and New Zealand
- 5. Middle East and Africa
- 6. Latin America
Switchgear Industry REPORT HIGHLIGHTS
| Aspects | Details |
|---|---|
| Study Period | 2019-2033 |
| Base Year | 2024 |
| Estimated Year | 2025 |
| Forecast Period | 2025-2033 |
| Historical Period | 2019-2024 |
| Growth Rate | CAGR of 6.10% from 2019-2033 |
| Segmentation |
|
Table of Contents
- 1. Introduction
- 1.1. Research Scope
- 1.2. Market Segmentation
- 1.3. Research Methodology
- 1.4. Definitions and Assumptions
- 2. Executive Summary
- 2.1. Introduction
- 3. Market Dynamics
- 3.1. Introduction
- 3.2. Market Drivers
- 3.2.1. Growth of Smart Electricity Grid Infrastructure; Growing Focus on Infrastructure and Renewable Energy Sources; Increased Investment in Industrial Production
- 3.3. Market Restrains
- 3.3.1. Stringent Environmental and Safety Regulations; Increasing Competition from the Unorganized Sectors
- 3.4. Market Trends
- 3.4.1. The Residential Segment to Witness a Significant Growth
- 4. Market Factor Analysis
- 4.1. Porters Five Forces
- 4.2. Supply/Value Chain
- 4.3. PESTEL analysis
- 4.4. Market Entropy
- 4.5. Patent/Trademark Analysis
- 5. Global Switchgear Industry Analysis, Insights and Forecast, 2019-2031
- 5.1. Market Analysis, Insights and Forecast - by Type
- 5.1.1. Voltage
- 5.1.1.1. Low-voltage
- 5.1.1.2. Medium-voltage
- 5.1.1.3. High-voltage
- 5.1.2. Insulation
- 5.1.2.1. Gas -insulated Switchgear (GIS)
- 5.1.2.2. Air-insulated Switchgear (AIS)
- 5.1.2.3. Other Insulation Types
- 5.1.3. Installation
- 5.1.3.1. Indoor
- 5.1.3.2. Outdoor
- 5.1.1. Voltage
- 5.2. Market Analysis, Insights and Forecast - by End-user Industry
- 5.2.1. Commercial
- 5.2.2. Residential
- 5.2.3. Industrial
- 5.3. Market Analysis, Insights and Forecast - by Region
- 5.3.1. North America
- 5.3.2. Europe
- 5.3.3. Asia
- 5.3.4. Australia and New Zealand
- 5.3.5. Middle East and Africa
- 5.3.6. Latin America
- 5.1. Market Analysis, Insights and Forecast - by Type
- 6. North America Switchgear Industry Analysis, Insights and Forecast, 2019-2031
- 6.1. Market Analysis, Insights and Forecast - by Type
- 6.1.1. Voltage
- 6.1.1.1. Low-voltage
- 6.1.1.2. Medium-voltage
- 6.1.1.3. High-voltage
- 6.1.2. Insulation
- 6.1.2.1. Gas -insulated Switchgear (GIS)
- 6.1.2.2. Air-insulated Switchgear (AIS)
- 6.1.2.3. Other Insulation Types
- 6.1.3. Installation
- 6.1.3.1. Indoor
- 6.1.3.2. Outdoor
- 6.1.1. Voltage
- 6.2. Market Analysis, Insights and Forecast - by End-user Industry
- 6.2.1. Commercial
- 6.2.2. Residential
- 6.2.3. Industrial
- 6.1. Market Analysis, Insights and Forecast - by Type
- 7. Europe Switchgear Industry Analysis, Insights and Forecast, 2019-2031
- 7.1. Market Analysis, Insights and Forecast - by Type
- 7.1.1. Voltage
- 7.1.1.1. Low-voltage
- 7.1.1.2. Medium-voltage
- 7.1.1.3. High-voltage
- 7.1.2. Insulation
- 7.1.2.1. Gas -insulated Switchgear (GIS)
- 7.1.2.2. Air-insulated Switchgear (AIS)
- 7.1.2.3. Other Insulation Types
- 7.1.3. Installation
- 7.1.3.1. Indoor
- 7.1.3.2. Outdoor
- 7.1.1. Voltage
- 7.2. Market Analysis, Insights and Forecast - by End-user Industry
- 7.2.1. Commercial
- 7.2.2. Residential
- 7.2.3. Industrial
- 7.1. Market Analysis, Insights and Forecast - by Type
- 8. Asia Switchgear Industry Analysis, Insights and Forecast, 2019-2031
- 8.1. Market Analysis, Insights and Forecast - by Type
- 8.1.1. Voltage
- 8.1.1.1. Low-voltage
- 8.1.1.2. Medium-voltage
- 8.1.1.3. High-voltage
- 8.1.2. Insulation
- 8.1.2.1. Gas -insulated Switchgear (GIS)
- 8.1.2.2. Air-insulated Switchgear (AIS)
- 8.1.2.3. Other Insulation Types
- 8.1.3. Installation
- 8.1.3.1. Indoor
- 8.1.3.2. Outdoor
- 8.1.1. Voltage
- 8.2. Market Analysis, Insights and Forecast - by End-user Industry
- 8.2.1. Commercial
- 8.2.2. Residential
- 8.2.3. Industrial
- 8.1. Market Analysis, Insights and Forecast - by Type
- 9. Australia and New Zealand Switchgear Industry Analysis, Insights and Forecast, 2019-2031
- 9.1. Market Analysis, Insights and Forecast - by Type
- 9.1.1. Voltage
- 9.1.1.1. Low-voltage
- 9.1.1.2. Medium-voltage
- 9.1.1.3. High-voltage
- 9.1.2. Insulation
- 9.1.2.1. Gas -insulated Switchgear (GIS)
- 9.1.2.2. Air-insulated Switchgear (AIS)
- 9.1.2.3. Other Insulation Types
- 9.1.3. Installation
- 9.1.3.1. Indoor
- 9.1.3.2. Outdoor
- 9.1.1. Voltage
- 9.2. Market Analysis, Insights and Forecast - by End-user Industry
- 9.2.1. Commercial
- 9.2.2. Residential
- 9.2.3. Industrial
- 9.1. Market Analysis, Insights and Forecast - by Type
- 10. Middle East and Africa Switchgear Industry Analysis, Insights and Forecast, 2019-2031
- 10.1. Market Analysis, Insights and Forecast - by Type
- 10.1.1. Voltage
- 10.1.1.1. Low-voltage
- 10.1.1.2. Medium-voltage
- 10.1.1.3. High-voltage
- 10.1.2. Insulation
- 10.1.2.1. Gas -insulated Switchgear (GIS)
- 10.1.2.2. Air-insulated Switchgear (AIS)
- 10.1.2.3. Other Insulation Types
- 10.1.3. Installation
- 10.1.3.1. Indoor
- 10.1.3.2. Outdoor
- 10.1.1. Voltage
- 10.2. Market Analysis, Insights and Forecast - by End-user Industry
- 10.2.1. Commercial
- 10.2.2. Residential
- 10.2.3. Industrial
- 10.1. Market Analysis, Insights and Forecast - by Type
- 11. Latin America Switchgear Industry Analysis, Insights and Forecast, 2019-2031
- 11.1. Market Analysis, Insights and Forecast - by Type
- 11.1.1. Voltage
- 11.1.1.1. Low-voltage
- 11.1.1.2. Medium-voltage
- 11.1.1.3. High-voltage
- 11.1.2. Insulation
- 11.1.2.1. Gas -insulated Switchgear (GIS)
- 11.1.2.2. Air-insulated Switchgear (AIS)
- 11.1.2.3. Other Insulation Types
- 11.1.3. Installation
- 11.1.3.1. Indoor
- 11.1.3.2. Outdoor
- 11.1.1. Voltage
- 11.2. Market Analysis, Insights and Forecast - by End-user Industry
- 11.2.1. Commercial
- 11.2.2. Residential
- 11.2.3. Industrial
- 11.1. Market Analysis, Insights and Forecast - by Type
- 12. North America Switchgear Industry Analysis, Insights and Forecast, 2019-2031
- 12.1. Market Analysis, Insights and Forecast - By Country/Sub-region
- 12.1.1.
- 13. Europe Switchgear Industry Analysis, Insights and Forecast, 2019-2031
- 13.1. Market Analysis, Insights and Forecast - By Country/Sub-region
- 13.1.1.
- 14. Asia Switchgear Industry Analysis, Insights and Forecast, 2019-2031
- 14.1. Market Analysis, Insights and Forecast - By Country/Sub-region
- 14.1.1.
- 15. Australia and New Zealand Switchgear Industry Analysis, Insights and Forecast, 2019-2031
- 15.1. Market Analysis, Insights and Forecast - By Country/Sub-region
- 15.1.1.
- 16. Middle East and Africa Switchgear Industry Analysis, Insights and Forecast, 2019-2031
- 16.1. Market Analysis, Insights and Forecast - By Country/Sub-region
- 16.1.1.
- 17. Latin America Switchgear Industry Analysis, Insights and Forecast, 2019-2031
- 17.1. Market Analysis, Insights and Forecast - By Country/Sub-region
- 17.1.1.
- 18. Competitive Analysis
- 18.1. Global Market Share Analysis 2024
- 18.2. Company Profiles
- 18.2.1 ZPUE S
- 18.2.1.1. Overview
- 18.2.1.2. Products
- 18.2.1.3. SWOT Analysis
- 18.2.1.4. Recent Developments
- 18.2.1.5. Financials (Based on Availability)
- 18.2.2 Eaton Corporation
- 18.2.2.1. Overview
- 18.2.2.2. Products
- 18.2.2.3. SWOT Analysis
- 18.2.2.4. Recent Developments
- 18.2.2.5. Financials (Based on Availability)
- 18.2.3 Switchgear Company
- 18.2.3.1. Overview
- 18.2.3.2. Products
- 18.2.3.3. SWOT Analysis
- 18.2.3.4. Recent Developments
- 18.2.3.5. Financials (Based on Availability)
- 18.2.4 ABB Ltd
- 18.2.4.1. Overview
- 18.2.4.2. Products
- 18.2.4.3. SWOT Analysis
- 18.2.4.4. Recent Developments
- 18.2.4.5. Financials (Based on Availability)
- 18.2.5 General Electric
- 18.2.5.1. Overview
- 18.2.5.2. Products
- 18.2.5.3. SWOT Analysis
- 18.2.5.4. Recent Developments
- 18.2.5.5. Financials (Based on Availability)
- 18.2.6 Orecco Electric
- 18.2.6.1. Overview
- 18.2.6.2. Products
- 18.2.6.3. SWOT Analysis
- 18.2.6.4. Recent Developments
- 18.2.6.5. Financials (Based on Availability)
- 18.2.7 Fuji Electric Co Ltd
- 18.2.7.1. Overview
- 18.2.7.2. Products
- 18.2.7.3. SWOT Analysis
- 18.2.7.4. Recent Developments
- 18.2.7.5. Financials (Based on Availability)
- 18.2.8 Crompton Greaves Power and Industrial Solutions Limited
- 18.2.8.1. Overview
- 18.2.8.2. Products
- 18.2.8.3. SWOT Analysis
- 18.2.8.4. Recent Developments
- 18.2.8.5. Financials (Based on Availability)
- 18.2.9 Toshiba International Corporation
- 18.2.9.1. Overview
- 18.2.9.2. Products
- 18.2.9.3. SWOT Analysis
- 18.2.9.4. Recent Developments
- 18.2.9.5. Financials (Based on Availability)
- 18.2.10 Hubbell Incorporated
- 18.2.10.1. Overview
- 18.2.10.2. Products
- 18.2.10.3. SWOT Analysis
- 18.2.10.4. Recent Developments
- 18.2.10.5. Financials (Based on Availability)
- 18.2.11 Hitachi Ltd
- 18.2.11.1. Overview
- 18.2.11.2. Products
- 18.2.11.3. SWOT Analysis
- 18.2.11.4. Recent Developments
- 18.2.11.5. Financials (Based on Availability)
- 18.2.12 Mitsubishi Electric Corporation
- 18.2.12.1. Overview
- 18.2.12.2. Products
- 18.2.12.3. SWOT Analysis
- 18.2.12.4. Recent Developments
- 18.2.12.5. Financials (Based on Availability)
- 18.2.13 Siemens AG
- 18.2.13.1. Overview
- 18.2.13.2. Products
- 18.2.13.3. SWOT Analysis
- 18.2.13.4. Recent Developments
- 18.2.13.5. Financials (Based on Availability)
- 18.2.14 Schneider Electric SE
- 18.2.14.1. Overview
- 18.2.14.2. Products
- 18.2.14.3. SWOT Analysis
- 18.2.14.4. Recent Developments
- 18.2.14.5. Financials (Based on Availability)
- 18.2.15 Powell Industries Inc
- 18.2.15.1. Overview
- 18.2.15.2. Products
- 18.2.15.3. SWOT Analysis
- 18.2.15.4. Recent Developments
- 18.2.15.5. Financials (Based on Availability)
- 18.2.16 Meidensha Corporation
- 18.2.16.1. Overview
- 18.2.16.2. Products
- 18.2.16.3. SWOT Analysis
- 18.2.16.4. Recent Developments
- 18.2.16.5. Financials (Based on Availability)
- 18.2.17 Havells India Limited
- 18.2.17.1. Overview
- 18.2.17.2. Products
- 18.2.17.3. SWOT Analysis
- 18.2.17.4. Recent Developments
- 18.2.17.5. Financials (Based on Availability)
- 18.2.1 ZPUE S
List of Figures
- Figure 1: Global Switchgear Industry Revenue Breakdown (Million, %) by Region 2024 & 2032
- Figure 2: North America Switchgear Industry Revenue (Million), by Country 2024 & 2032
- Figure 3: North America Switchgear Industry Revenue Share (%), by Country 2024 & 2032
- Figure 4: Europe Switchgear Industry Revenue (Million), by Country 2024 & 2032
- Figure 5: Europe Switchgear Industry Revenue Share (%), by Country 2024 & 2032
- Figure 6: Asia Switchgear Industry Revenue (Million), by Country 2024 & 2032
- Figure 7: Asia Switchgear Industry Revenue Share (%), by Country 2024 & 2032
- Figure 8: Australia and New Zealand Switchgear Industry Revenue (Million), by Country 2024 & 2032
- Figure 9: Australia and New Zealand Switchgear Industry Revenue Share (%), by Country 2024 & 2032
- Figure 10: Middle East and Africa Switchgear Industry Revenue (Million), by Country 2024 & 2032
- Figure 11: Middle East and Africa Switchgear Industry Revenue Share (%), by Country 2024 & 2032
- Figure 12: Latin America Switchgear Industry Revenue (Million), by Country 2024 & 2032
- Figure 13: Latin America Switchgear Industry Revenue Share (%), by Country 2024 & 2032
- Figure 14: North America Switchgear Industry Revenue (Million), by Type 2024 & 2032
- Figure 15: North America Switchgear Industry Revenue Share (%), by Type 2024 & 2032
- Figure 16: North America Switchgear Industry Revenue (Million), by End-user Industry 2024 & 2032
- Figure 17: North America Switchgear Industry Revenue Share (%), by End-user Industry 2024 & 2032
- Figure 18: North America Switchgear Industry Revenue (Million), by Country 2024 & 2032
- Figure 19: North America Switchgear Industry Revenue Share (%), by Country 2024 & 2032
- Figure 20: Europe Switchgear Industry Revenue (Million), by Type 2024 & 2032
- Figure 21: Europe Switchgear Industry Revenue Share (%), by Type 2024 & 2032
- Figure 22: Europe Switchgear Industry Revenue (Million), by End-user Industry 2024 & 2032
- Figure 23: Europe Switchgear Industry Revenue Share (%), by End-user Industry 2024 & 2032
- Figure 24: Europe Switchgear Industry Revenue (Million), by Country 2024 & 2032
- Figure 25: Europe Switchgear Industry Revenue Share (%), by Country 2024 & 2032
- Figure 26: Asia Switchgear Industry Revenue (Million), by Type 2024 & 2032
- Figure 27: Asia Switchgear Industry Revenue Share (%), by Type 2024 & 2032
- Figure 28: Asia Switchgear Industry Revenue (Million), by End-user Industry 2024 & 2032
- Figure 29: Asia Switchgear Industry Revenue Share (%), by End-user Industry 2024 & 2032
- Figure 30: Asia Switchgear Industry Revenue (Million), by Country 2024 & 2032
- Figure 31: Asia Switchgear Industry Revenue Share (%), by Country 2024 & 2032
- Figure 32: Australia and New Zealand Switchgear Industry Revenue (Million), by Type 2024 & 2032
- Figure 33: Australia and New Zealand Switchgear Industry Revenue Share (%), by Type 2024 & 2032
- Figure 34: Australia and New Zealand Switchgear Industry Revenue (Million), by End-user Industry 2024 & 2032
- Figure 35: Australia and New Zealand Switchgear Industry Revenue Share (%), by End-user Industry 2024 & 2032
- Figure 36: Australia and New Zealand Switchgear Industry Revenue (Million), by Country 2024 & 2032
- Figure 37: Australia and New Zealand Switchgear Industry Revenue Share (%), by Country 2024 & 2032
- Figure 38: Middle East and Africa Switchgear Industry Revenue (Million), by Type 2024 & 2032
- Figure 39: Middle East and Africa Switchgear Industry Revenue Share (%), by Type 2024 & 2032
- Figure 40: Middle East and Africa Switchgear Industry Revenue (Million), by End-user Industry 2024 & 2032
- Figure 41: Middle East and Africa Switchgear Industry Revenue Share (%), by End-user Industry 2024 & 2032
- Figure 42: Middle East and Africa Switchgear Industry Revenue (Million), by Country 2024 & 2032
- Figure 43: Middle East and Africa Switchgear Industry Revenue Share (%), by Country 2024 & 2032
- Figure 44: Latin America Switchgear Industry Revenue (Million), by Type 2024 & 2032
- Figure 45: Latin America Switchgear Industry Revenue Share (%), by Type 2024 & 2032
- Figure 46: Latin America Switchgear Industry Revenue (Million), by End-user Industry 2024 & 2032
- Figure 47: Latin America Switchgear Industry Revenue Share (%), by End-user Industry 2024 & 2032
- Figure 48: Latin America Switchgear Industry Revenue (Million), by Country 2024 & 2032
- Figure 49: Latin America Switchgear Industry Revenue Share (%), by Country 2024 & 2032
List of Tables
- Table 1: Global Switchgear Industry Revenue Million Forecast, by Region 2019 & 2032
- Table 2: Global Switchgear Industry Revenue Million Forecast, by Type 2019 & 2032
- Table 3: Global Switchgear Industry Revenue Million Forecast, by End-user Industry 2019 & 2032
- Table 4: Global Switchgear Industry Revenue Million Forecast, by Region 2019 & 2032
- Table 5: Global Switchgear Industry Revenue Million Forecast, by Country 2019 & 2032
- Table 6: Switchgear Industry Revenue (Million) Forecast, by Application 2019 & 2032
- Table 7: Global Switchgear Industry Revenue Million Forecast, by Country 2019 & 2032
- Table 8: Switchgear Industry Revenue (Million) Forecast, by Application 2019 & 2032
- Table 9: Global Switchgear Industry Revenue Million Forecast, by Country 2019 & 2032
- Table 10: Switchgear Industry Revenue (Million) Forecast, by Application 2019 & 2032
- Table 11: Global Switchgear Industry Revenue Million Forecast, by Country 2019 & 2032
- Table 12: Switchgear Industry Revenue (Million) Forecast, by Application 2019 & 2032
- Table 13: Global Switchgear Industry Revenue Million Forecast, by Country 2019 & 2032
- Table 14: Switchgear Industry Revenue (Million) Forecast, by Application 2019 & 2032
- Table 15: Global Switchgear Industry Revenue Million Forecast, by Country 2019 & 2032
- Table 16: Switchgear Industry Revenue (Million) Forecast, by Application 2019 & 2032
- Table 17: Global Switchgear Industry Revenue Million Forecast, by Type 2019 & 2032
- Table 18: Global Switchgear Industry Revenue Million Forecast, by End-user Industry 2019 & 2032
- Table 19: Global Switchgear Industry Revenue Million Forecast, by Country 2019 & 2032
- Table 20: Global Switchgear Industry Revenue Million Forecast, by Type 2019 & 2032
- Table 21: Global Switchgear Industry Revenue Million Forecast, by End-user Industry 2019 & 2032
- Table 22: Global Switchgear Industry Revenue Million Forecast, by Country 2019 & 2032
- Table 23: Global Switchgear Industry Revenue Million Forecast, by Type 2019 & 2032
- Table 24: Global Switchgear Industry Revenue Million Forecast, by End-user Industry 2019 & 2032
- Table 25: Global Switchgear Industry Revenue Million Forecast, by Country 2019 & 2032
- Table 26: Global Switchgear Industry Revenue Million Forecast, by Type 2019 & 2032
- Table 27: Global Switchgear Industry Revenue Million Forecast, by End-user Industry 2019 & 2032
- Table 28: Global Switchgear Industry Revenue Million Forecast, by Country 2019 & 2032
- Table 29: Global Switchgear Industry Revenue Million Forecast, by Type 2019 & 2032
- Table 30: Global Switchgear Industry Revenue Million Forecast, by End-user Industry 2019 & 2032
- Table 31: Global Switchgear Industry Revenue Million Forecast, by Country 2019 & 2032
- Table 32: Global Switchgear Industry Revenue Million Forecast, by Type 2019 & 2032
- Table 33: Global Switchgear Industry Revenue Million Forecast, by End-user Industry 2019 & 2032
- Table 34: Global Switchgear Industry Revenue Million Forecast, by Country 2019 & 2032
Frequently Asked Questions
1. What is the projected Compound Annual Growth Rate (CAGR) of the Switchgear Industry?
The projected CAGR is approximately 6.10%.
2. Which companies are prominent players in the Switchgear Industry?
Key companies in the market include ZPUE S, Eaton Corporation, Switchgear Company, ABB Ltd, General Electric, Orecco Electric, Fuji Electric Co Ltd, Crompton Greaves Power and Industrial Solutions Limited, Toshiba International Corporation, Hubbell Incorporated, Hitachi Ltd, Mitsubishi Electric Corporation, Siemens AG, Schneider Electric SE, Powell Industries Inc, Meidensha Corporation, Havells India Limited.
3. What are the main segments of the Switchgear Industry?
The market segments include Type, End-user Industry.
4. Can you provide details about the market size?
The market size is estimated to be USD 122.24 Million as of 2022.
5. What are some drivers contributing to market growth?
Growth of Smart Electricity Grid Infrastructure; Growing Focus on Infrastructure and Renewable Energy Sources; Increased Investment in Industrial Production.
6. What are the notable trends driving market growth?
The Residential Segment to Witness a Significant Growth.
7. Are there any restraints impacting market growth?
Stringent Environmental and Safety Regulations; Increasing Competition from the Unorganized Sectors.
8. Can you provide examples of recent developments in the market?
February 2024: Schneider Electric introduced a new product called SureSeT Medium Voltage (MV) switchgear for the Canadian market. This innovative solution, which features the EvoPacT circuit breaker, aims to provide a more efficient and advanced option for primary switchgear applications that can handle digital operations effectively. SureSeT thoroughly monitors thermal, environmental, and circuit breaker health and is durable and compact. SureSeT can minimize downtime and enable faster detection of problems for quicker repairs by offering features like remote control and digital services utilizing real-time data.
9. What pricing options are available for accessing the report?
Pricing options include single-user, multi-user, and enterprise licenses priced at USD 4750, USD 5250, and USD 8750 respectively.
10. Is the market size provided in terms of value or volume?
The market size is provided in terms of value, measured in Million.
11. Are there any specific market keywords associated with the report?
Yes, the market keyword associated with the report is "Switchgear Industry," which aids in identifying and referencing the specific market segment covered.
12. How do I determine which pricing option suits my needs best?
The pricing options vary based on user requirements and access needs. Individual users may opt for single-user licenses, while businesses requiring broader access may choose multi-user or enterprise licenses for cost-effective access to the report.
13. Are there any additional resources or data provided in the Switchgear Industry report?
While the report offers comprehensive insights, it's advisable to review the specific contents or supplementary materials provided to ascertain if additional resources or data are available.
14. How can I stay updated on further developments or reports in the Switchgear Industry?
To stay informed about further developments, trends, and reports in the Switchgear Industry, consider subscribing to industry newsletters, following relevant companies and organizations, or regularly checking reputable industry news sources and publications.
Methodology
Step 1 - Identification of Relevant Samples Size from Population Database


Step 2 - Approaches for Defining Global Market Size (Value, Volume* & Price*)

Note*: In applicable scenarios
Step 3 - Data Sources
Primary Research
- Web Analytics
- Survey Reports
- Research Institute
- Latest Research Reports
- Opinion Leaders
Secondary Research
- Annual Reports
- White Paper
- Latest Press Release
- Industry Association
- Paid Database
- Investor Presentations

Step 4 - Data Triangulation
Involves using different sources of information in order to increase the validity of a study
These sources are likely to be stakeholders in a program - participants, other researchers, program staff, other community members, and so on.
Then we put all data in single framework & apply various statistical tools to find out the dynamic on the market.
During the analysis stage, feedback from the stakeholder groups would be compared to determine areas of agreement as well as areas of divergence


