
Key Insights
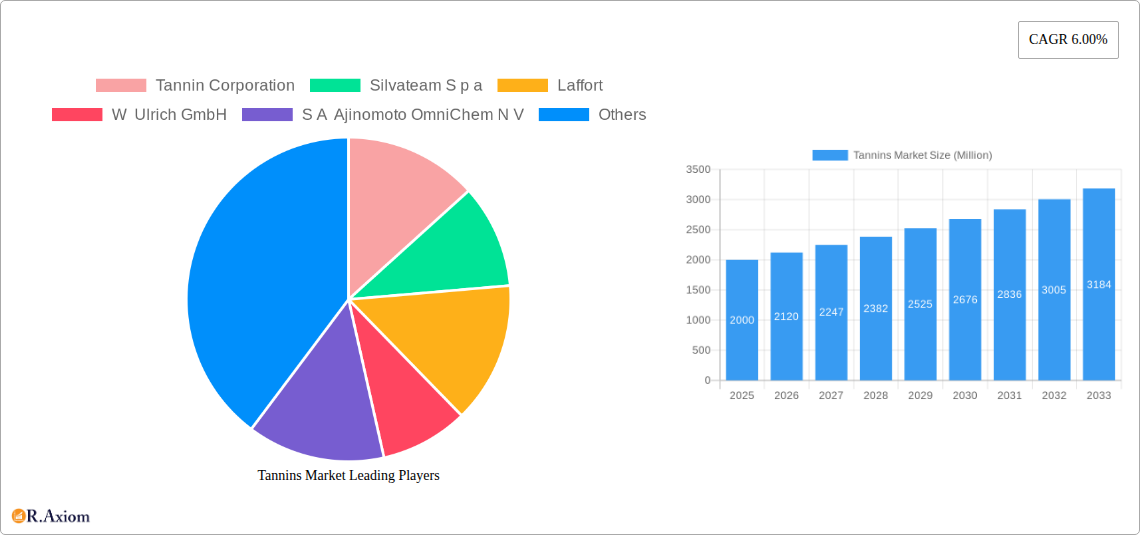
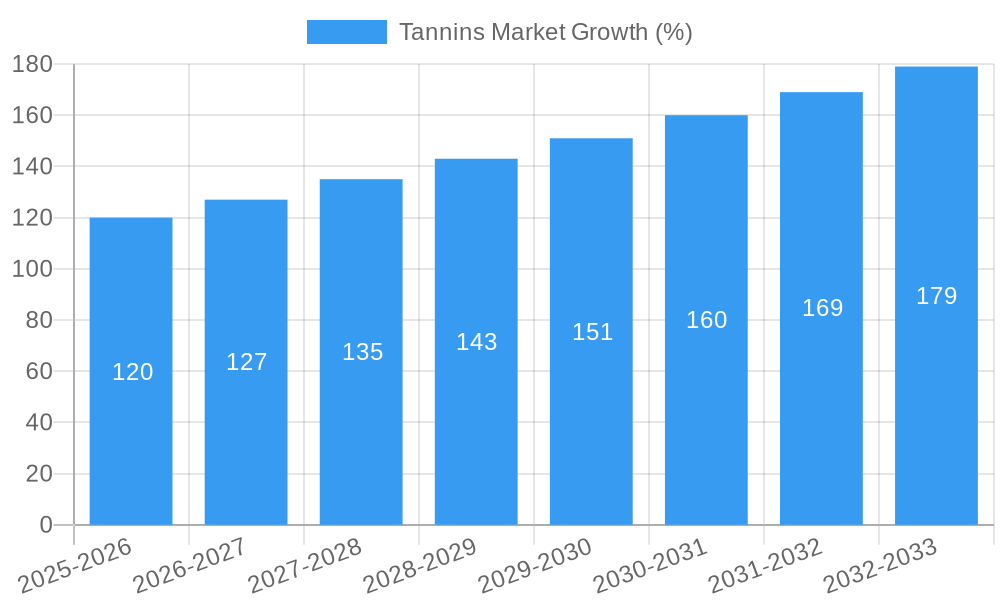
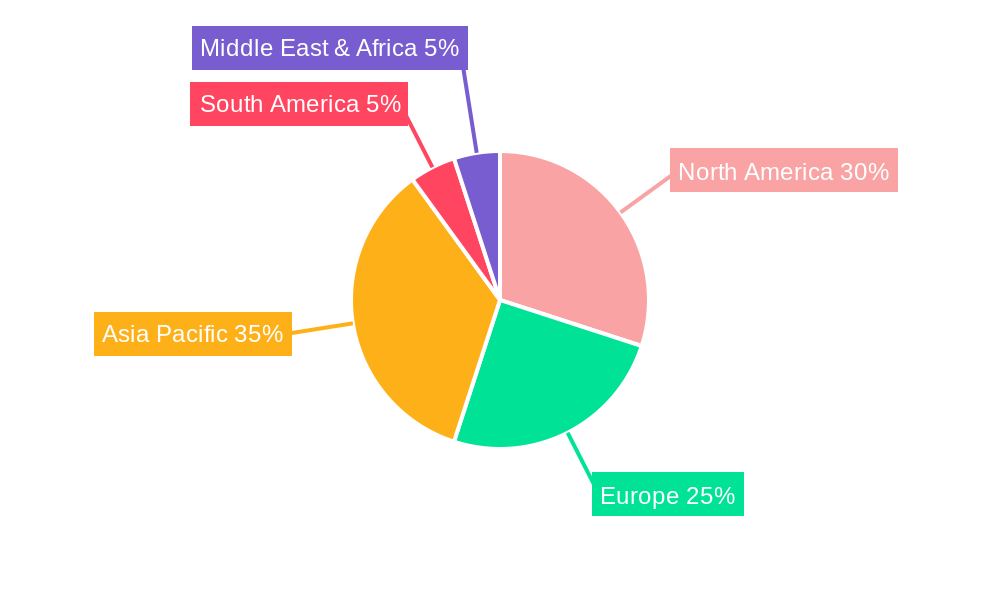
The global tannins market, valued at approximately $XX million in 2025, is projected to experience robust growth, exhibiting a compound annual growth rate (CAGR) of 6.00% from 2025 to 2033. This expansion is primarily driven by the increasing demand for natural tannins in the food and beverage industry, particularly as a natural preservative and flavor enhancer. The rising consumer preference for natural and sustainable ingredients is further bolstering the market. Growth is also fueled by applications in the pharmaceutical and leather industries, where tannins are used for their astringent and antimicrobial properties. While synthetic tannins offer cost advantages, the growing awareness of potential health and environmental concerns associated with synthetic chemicals is driving a shift towards natural tannins. This trend is particularly evident in developed regions like North America and Europe, which are characterized by stringent regulations and a heightened focus on product safety. The market segmentation reveals that natural tannin extracts currently dominate the market, although synthetic tannin extracts hold potential for growth in cost-sensitive applications. Geographical analysis shows robust growth across diverse regions, reflecting the broad applications and increasing awareness of tannins' benefits across various sectors.
However, the market faces certain challenges. Fluctuations in raw material prices, particularly for natural tannin extracts, can impact profitability. Moreover, the development and adoption of alternative technologies and ingredients in certain applications might pose competitive threats. Nevertheless, the overall outlook remains positive, driven by consistent growth in key application areas and the increasing preference for natural and sustainable products. Companies like Tannin Corporation, Silvateam S.p.A, and Laffort are key players, continually innovating to enhance product quality and expand market reach. Future growth is expected to be particularly strong in emerging economies in Asia-Pacific, driven by industrialization and rising consumer spending. Further research and development into novel tannin applications will be crucial in shaping the market's trajectory.
Tannins Market: A Comprehensive Report (2019-2033)
This comprehensive report provides an in-depth analysis of the global Tannins Market, offering actionable insights for industry stakeholders. Covering the period from 2019 to 2033, with a base year of 2025 and a forecast period from 2025 to 2033, this study meticulously examines market dynamics, segment performance, competitive landscape, and future growth prospects. The report's detailed segmentation, encompassing source (Natural Tannin Extract, Synthetic Tannin Extract) and application (Food & Beverage, Pharmaceutical, Leather, Others), provides a granular understanding of the market's intricacies. With a focus on key players like Tannin Corporation, Silvateam S.p.A, Laffort, W Ulrich GmbH, S.A. Ajinomoto OmniChem N.V., Jyoti Dye Chem Agency, Tanac S.A, and EVER s.r.l., this report serves as an invaluable resource for informed decision-making.
Tannins Market Concentration & Innovation
The Tannins market exhibits a moderately concentrated structure, with a few major players holding significant market share. While precise market share figures for individual companies are proprietary data, estimates suggest that the top five players collectively account for approximately xx% of the global market in 2025. This concentration is driven by substantial investments in research and development, leading to continuous product innovation and expansion into new applications. Innovation in the Tannins market focuses primarily on improving the quality and functionality of tannin extracts, particularly for food and beverage applications. This includes developing new extraction methods to enhance purity, exploring applications in other industries, like pharmaceuticals, and creating sustainably sourced and produced tannins. Regulatory frameworks play a significant role, with increasing scrutiny on the use of natural and synthetic tannins in different products. The presence of substitutes, such as other natural preservatives and colorants, necessitates ongoing innovation to maintain market share. Mergers and acquisitions (M&A) activity has been relatively moderate in recent years, with deal values averaging around xx Million annually. Future M&A activity may be driven by the need for companies to expand their product portfolios and gain access to new markets.
- Market Concentration: Top 5 players hold approximately xx% market share (2025).
- Innovation Drivers: Improved extraction methods, new applications (pharmaceuticals, etc.), sustainable sourcing.
- Regulatory Frameworks: Increasing scrutiny on natural and synthetic tannins.
- Product Substitutes: Other natural preservatives and colorants.
- M&A Activity: Average annual deal values estimated at xx Million.
Tannins Market Industry Trends & Insights
The global Tannins market is experiencing robust growth, driven by the increasing demand for natural food preservatives and the rising popularity of plant-based products. The market's Compound Annual Growth Rate (CAGR) is projected to be xx% during the forecast period (2025-2033). This growth is fueled by a surge in consumer awareness regarding health and sustainability, coupled with stringent regulations on synthetic additives. Technological advancements in extraction and purification processes are also contributing to market expansion, enabling the production of higher-quality, more standardized tannins. Consumer preferences are shifting towards natural, sustainably sourced ingredients, creating a favorable environment for the growth of the natural tannin extract segment. Competitive dynamics are characterized by both intense rivalry among established players and the emergence of new entrants. The market penetration of natural tannin extracts is increasing rapidly, primarily in the food and beverage sector, driven by the aforementioned trends. Market segmentation analysis reveals that specific geographical regions are exhibiting faster-than-average growth rates.
Dominant Markets & Segments in Tannins Market
The Tannins market demonstrates a geographically diverse spread, with no single region exhibiting overwhelming dominance. However, regions like [Name of Region with xx Million Market Size] and [Name of Region with xx Million Market Size] show strong performance due to factors such as [Name of Factor] and [Name of Factor]. Within the segmentation by source, the Natural Tannin Extract segment holds a larger market share due to growing consumer preference for natural ingredients and the increasing demand for natural food preservatives. The Synthetic Tannin Extract segment, although smaller, is expected to witness steady growth driven by its cost-effectiveness and consistent quality. In terms of applications, the Food & Beverage segment constitutes the largest portion of the market, driven by increasing adoption in winemaking, brewing, and other food processing applications. The pharmaceutical and leather industries also contribute significantly to overall market growth.
- Key Drivers (Region A): [List Specific economic policies, infrastructure developments, consumer preferences, etc.]
- Key Drivers (Region B): [List Specific economic policies, infrastructure developments, consumer preferences, etc.]
- Natural Tannin Extract: High growth due to consumer preference for natural ingredients.
- Synthetic Tannin Extract: Steady growth due to cost-effectiveness and consistent quality.
- Food & Beverage: Largest application segment driven by food processing applications.
Tannins Market Product Developments
Recent product innovations within the tannins market focus on enhancing the functionality and purity of tannin extracts. Companies are developing specialized tannin extracts tailored for specific applications, improving their efficacy and yield in different processes. Technological advancements in extraction techniques, such as supercritical fluid extraction, are allowing for the production of high-quality tannins with enhanced properties. This is leading to improved market fit and competitive advantages for manufacturers, particularly in the high-value food and beverage sector. The development of sustainable and eco-friendly extraction methods further enhances the appeal of these products to environmentally conscious consumers and brands.
Report Scope & Segmentation Analysis
This report provides a comprehensive analysis of the tannins market, segmented by source (Natural Tannin Extract and Synthetic Tannin Extract) and application (Food & Beverage, Pharmaceutical, Leather, and Others). The Natural Tannin Extract segment is expected to experience robust growth due to growing consumer demand for natural ingredients. The Synthetic Tannin Extract segment offers consistent quality and cost-effectiveness. The Food & Beverage segment is the largest application segment, followed by others. Each segment’s market size and growth projections are meticulously detailed within the report. Competitive dynamics vary across segments; some are characterized by intense competition while others offer opportunities for new players.
Key Drivers of Tannins Market Growth
The Tannins market is driven by several key factors. Firstly, the rising consumer preference for natural and sustainable ingredients is boosting demand for natural tannin extracts. Secondly, the growing food and beverage industry, particularly in developing economies, fuels the demand for natural preservatives and colorants. Thirdly, technological advancements in extraction and purification processes are improving the quality and functionality of tannins, expanding their potential applications. Lastly, favorable government regulations promoting the use of natural ingredients in various products are also driving market expansion.
Challenges in the Tannins Market Sector
The Tannins market faces several challenges. Fluctuations in raw material prices impact profitability, while stringent regulatory requirements increase production costs. Supply chain disruptions, particularly in regions with limited resources, can limit availability and impact pricing. Moreover, intense competition from substitute products and the emergence of new entrants pose a threat to established players. These factors, combined, can restrain overall market growth, particularly for smaller players without established supply chains and robust R&D capabilities.
Emerging Opportunities in Tannins Market
Several opportunities exist for growth in the Tannins market. The expanding pharmaceutical and cosmetic industries present significant potential for new applications, with tannins offering unique properties for drug delivery and skincare products. Furthermore, advancements in biotechnology offer potential for developing new, more efficient extraction methods and modified tannins with enhanced functionality. Exploring new geographical markets, particularly in regions with a growing awareness of natural ingredients, could create lucrative new revenue streams. Lastly, a strong focus on sustainability and eco-friendly production will be crucial for capturing environmentally conscious consumers.
Leading Players in the Tannins Market Market
- Tannin Corporation
- Silvateam S.p.A
- Laffort
- W Ulrich GmbH
- S.A. Ajinomoto OmniChem N.V.
- Jyoti Dye Chem Agency
- Tanac S.A
- EVER s.r.l
Key Developments in Tannins Market Industry
- 2022 Q4: Silvateam S.p.A launched a new line of sustainably sourced tannin extracts.
- 2023 Q1: Tannin Corporation acquired a smaller competitor, expanding its market reach.
- 2023 Q3: New regulations regarding the use of synthetic tannins in food products were implemented in [Country Name].
- 2024 Q2: Laffort announced a significant investment in R&D for new tannin extraction technologies.
Strategic Outlook for Tannins Market Market
The future of the Tannins market looks promising, driven by the continued growth of the health and wellness sectors, increasing demand for natural ingredients, and the ongoing development of innovative applications. The market is poised for expansion, particularly in emerging markets and within niche applications like pharmaceuticals and cosmetics. Companies focused on sustainability, technological innovation, and the development of high-quality, value-added products are well-positioned to capture significant market share. Continued investment in research and development will be crucial for unlocking new opportunities and navigating evolving regulatory landscapes.
Tannins Market Segmentation
-
1. Source
- 1.1. Naural Tannin Extract
- 1.2. Synthetic Tannin extract
-
2. Application
-
2.1. Food & Beverage
- 2.1.1. Wine
- 2.1.2. RTD Drinks
- 2.1.3. Others
- 2.2. Pharmaceutical
- 2.3. Leather
-
2.1. Food & Beverage
Tannins Market Segmentation By Geography
-
1. North America
- 1.1. United States
- 1.2. Canada
- 1.3. Mexico
- 1.4. Rest of North America
-
2. Europe
- 2.1. United Kingdom
- 2.2. Germany
- 2.3. France
- 2.4. Russia
- 2.5. Italy
- 2.6. Spain
- 2.7. Rest of Europe
-
3. Asia Pacific
- 3.1. India
- 3.2. China
- 3.3. Japan
- 3.4. Australia
- 3.5. Rest of Asia Pacific
-
4. South America
- 4.1. Brazil
- 4.2. Argentina
- 4.3. Rest of South America
- 5. Middle East
-
6. South Africa
- 6.1. Saudi Arabia
- 6.2. Rest of MEA
Tannins Market REPORT HIGHLIGHTS
| Aspects | Details |
|---|---|
| Study Period | 2019-2033 |
| Base Year | 2024 |
| Estimated Year | 2025 |
| Forecast Period | 2025-2033 |
| Historical Period | 2019-2024 |
| Growth Rate | CAGR of 6.00% from 2019-2033 |
| Segmentation |
|
Table of Contents
- 1. Introduction
- 1.1. Research Scope
- 1.2. Market Segmentation
- 1.3. Research Methodology
- 1.4. Definitions and Assumptions
- 2. Executive Summary
- 2.1. Introduction
- 3. Market Dynamics
- 3.1. Introduction
- 3.2. Market Drivers
- 3.2.1. Increasing Demand for Protein-Rich Food; Increasing Demand for Plant-Based and Organic Ingredients
- 3.3. Market Restrains
- 3.3.1. Presence of Alternative Proteins
- 3.4. Market Trends
- 3.4.1. Rising Demand For Plant-based Tannin Extracts
- 4. Market Factor Analysis
- 4.1. Porters Five Forces
- 4.2. Supply/Value Chain
- 4.3. PESTEL analysis
- 4.4. Market Entropy
- 4.5. Patent/Trademark Analysis
- 5. Global Tannins Market Analysis, Insights and Forecast, 2019-2031
- 5.1. Market Analysis, Insights and Forecast - by Source
- 5.1.1. Naural Tannin Extract
- 5.1.2. Synthetic Tannin extract
- 5.2. Market Analysis, Insights and Forecast - by Application
- 5.2.1. Food & Beverage
- 5.2.1.1. Wine
- 5.2.1.2. RTD Drinks
- 5.2.1.3. Others
- 5.2.2. Pharmaceutical
- 5.2.3. Leather
- 5.2.1. Food & Beverage
- 5.3. Market Analysis, Insights and Forecast - by Region
- 5.3.1. North America
- 5.3.2. Europe
- 5.3.3. Asia Pacific
- 5.3.4. South America
- 5.3.5. Middle East
- 5.3.6. South Africa
- 5.1. Market Analysis, Insights and Forecast - by Source
- 6. North America Tannins Market Analysis, Insights and Forecast, 2019-2031
- 6.1. Market Analysis, Insights and Forecast - by Source
- 6.1.1. Naural Tannin Extract
- 6.1.2. Synthetic Tannin extract
- 6.2. Market Analysis, Insights and Forecast - by Application
- 6.2.1. Food & Beverage
- 6.2.1.1. Wine
- 6.2.1.2. RTD Drinks
- 6.2.1.3. Others
- 6.2.2. Pharmaceutical
- 6.2.3. Leather
- 6.2.1. Food & Beverage
- 6.1. Market Analysis, Insights and Forecast - by Source
- 7. Europe Tannins Market Analysis, Insights and Forecast, 2019-2031
- 7.1. Market Analysis, Insights and Forecast - by Source
- 7.1.1. Naural Tannin Extract
- 7.1.2. Synthetic Tannin extract
- 7.2. Market Analysis, Insights and Forecast - by Application
- 7.2.1. Food & Beverage
- 7.2.1.1. Wine
- 7.2.1.2. RTD Drinks
- 7.2.1.3. Others
- 7.2.2. Pharmaceutical
- 7.2.3. Leather
- 7.2.1. Food & Beverage
- 7.1. Market Analysis, Insights and Forecast - by Source
- 8. Asia Pacific Tannins Market Analysis, Insights and Forecast, 2019-2031
- 8.1. Market Analysis, Insights and Forecast - by Source
- 8.1.1. Naural Tannin Extract
- 8.1.2. Synthetic Tannin extract
- 8.2. Market Analysis, Insights and Forecast - by Application
- 8.2.1. Food & Beverage
- 8.2.1.1. Wine
- 8.2.1.2. RTD Drinks
- 8.2.1.3. Others
- 8.2.2. Pharmaceutical
- 8.2.3. Leather
- 8.2.1. Food & Beverage
- 8.1. Market Analysis, Insights and Forecast - by Source
- 9. South America Tannins Market Analysis, Insights and Forecast, 2019-2031
- 9.1. Market Analysis, Insights and Forecast - by Source
- 9.1.1. Naural Tannin Extract
- 9.1.2. Synthetic Tannin extract
- 9.2. Market Analysis, Insights and Forecast - by Application
- 9.2.1. Food & Beverage
- 9.2.1.1. Wine
- 9.2.1.2. RTD Drinks
- 9.2.1.3. Others
- 9.2.2. Pharmaceutical
- 9.2.3. Leather
- 9.2.1. Food & Beverage
- 9.1. Market Analysis, Insights and Forecast - by Source
- 10. Middle East Tannins Market Analysis, Insights and Forecast, 2019-2031
- 10.1. Market Analysis, Insights and Forecast - by Source
- 10.1.1. Naural Tannin Extract
- 10.1.2. Synthetic Tannin extract
- 10.2. Market Analysis, Insights and Forecast - by Application
- 10.2.1. Food & Beverage
- 10.2.1.1. Wine
- 10.2.1.2. RTD Drinks
- 10.2.1.3. Others
- 10.2.2. Pharmaceutical
- 10.2.3. Leather
- 10.2.1. Food & Beverage
- 10.1. Market Analysis, Insights and Forecast - by Source
- 11. South Africa Tannins Market Analysis, Insights and Forecast, 2019-2031
- 11.1. Market Analysis, Insights and Forecast - by Source
- 11.1.1. Naural Tannin Extract
- 11.1.2. Synthetic Tannin extract
- 11.2. Market Analysis, Insights and Forecast - by Application
- 11.2.1. Food & Beverage
- 11.2.1.1. Wine
- 11.2.1.2. RTD Drinks
- 11.2.1.3. Others
- 11.2.2. Pharmaceutical
- 11.2.3. Leather
- 11.2.1. Food & Beverage
- 11.1. Market Analysis, Insights and Forecast - by Source
- 12. North America Tannins Market Analysis, Insights and Forecast, 2019-2031
- 12.1. Market Analysis, Insights and Forecast - By Country/Sub-region
- 12.1.1 United States
- 12.1.2 Canada
- 12.1.3 Mexico
- 12.1.4 Rest of North America
- 13. Europe Tannins Market Analysis, Insights and Forecast, 2019-2031
- 13.1. Market Analysis, Insights and Forecast - By Country/Sub-region
- 13.1.1 United Kingdom
- 13.1.2 Germany
- 13.1.3 France
- 13.1.4 Russia
- 13.1.5 Italy
- 13.1.6 Spain
- 13.1.7 Rest of Europe
- 14. Asia Pacific Tannins Market Analysis, Insights and Forecast, 2019-2031
- 14.1. Market Analysis, Insights and Forecast - By Country/Sub-region
- 14.1.1 India
- 14.1.2 China
- 14.1.3 Japan
- 14.1.4 Australia
- 14.1.5 Rest of Asia Pacific
- 15. South America Tannins Market Analysis, Insights and Forecast, 2019-2031
- 15.1. Market Analysis, Insights and Forecast - By Country/Sub-region
- 15.1.1 Brazil
- 15.1.2 Argentina
- 15.1.3 Rest of South America
- 16. Middle East Tannins Market Analysis, Insights and Forecast, 2019-2031
- 16.1. Market Analysis, Insights and Forecast - By Country/Sub-region
- 16.1.1.
- 17. South Africa Tannins Market Analysis, Insights and Forecast, 2019-2031
- 17.1. Market Analysis, Insights and Forecast - By Country/Sub-region
- 17.1.1 Saudi Arabia
- 17.1.2 Rest of MEA
- 18. Competitive Analysis
- 18.1. Global Market Share Analysis 2024
- 18.2. Company Profiles
- 18.2.1 Tannin Corporation
- 18.2.1.1. Overview
- 18.2.1.2. Products
- 18.2.1.3. SWOT Analysis
- 18.2.1.4. Recent Developments
- 18.2.1.5. Financials (Based on Availability)
- 18.2.2 Silvateam S p a
- 18.2.2.1. Overview
- 18.2.2.2. Products
- 18.2.2.3. SWOT Analysis
- 18.2.2.4. Recent Developments
- 18.2.2.5. Financials (Based on Availability)
- 18.2.3 Laffort
- 18.2.3.1. Overview
- 18.2.3.2. Products
- 18.2.3.3. SWOT Analysis
- 18.2.3.4. Recent Developments
- 18.2.3.5. Financials (Based on Availability)
- 18.2.4 W Ulrich GmbH
- 18.2.4.1. Overview
- 18.2.4.2. Products
- 18.2.4.3. SWOT Analysis
- 18.2.4.4. Recent Developments
- 18.2.4.5. Financials (Based on Availability)
- 18.2.5 S A Ajinomoto OmniChem N V
- 18.2.5.1. Overview
- 18.2.5.2. Products
- 18.2.5.3. SWOT Analysis
- 18.2.5.4. Recent Developments
- 18.2.5.5. Financials (Based on Availability)
- 18.2.6 Jyoti Dye Chem Agency*List Not Exhaustive
- 18.2.6.1. Overview
- 18.2.6.2. Products
- 18.2.6.3. SWOT Analysis
- 18.2.6.4. Recent Developments
- 18.2.6.5. Financials (Based on Availability)
- 18.2.7 Tanac S A
- 18.2.7.1. Overview
- 18.2.7.2. Products
- 18.2.7.3. SWOT Analysis
- 18.2.7.4. Recent Developments
- 18.2.7.5. Financials (Based on Availability)
- 18.2.8 EVER s r l
- 18.2.8.1. Overview
- 18.2.8.2. Products
- 18.2.8.3. SWOT Analysis
- 18.2.8.4. Recent Developments
- 18.2.8.5. Financials (Based on Availability)
- 18.2.1 Tannin Corporation
List of Figures
- Figure 1: Global Tannins Market Revenue Breakdown (Million, %) by Region 2024 & 2032
- Figure 2: North America Tannins Market Revenue (Million), by Country 2024 & 2032
- Figure 3: North America Tannins Market Revenue Share (%), by Country 2024 & 2032
- Figure 4: Europe Tannins Market Revenue (Million), by Country 2024 & 2032
- Figure 5: Europe Tannins Market Revenue Share (%), by Country 2024 & 2032
- Figure 6: Asia Pacific Tannins Market Revenue (Million), by Country 2024 & 2032
- Figure 7: Asia Pacific Tannins Market Revenue Share (%), by Country 2024 & 2032
- Figure 8: South America Tannins Market Revenue (Million), by Country 2024 & 2032
- Figure 9: South America Tannins Market Revenue Share (%), by Country 2024 & 2032
- Figure 10: Middle East Tannins Market Revenue (Million), by Country 2024 & 2032
- Figure 11: Middle East Tannins Market Revenue Share (%), by Country 2024 & 2032
- Figure 12: South Africa Tannins Market Revenue (Million), by Country 2024 & 2032
- Figure 13: South Africa Tannins Market Revenue Share (%), by Country 2024 & 2032
- Figure 14: North America Tannins Market Revenue (Million), by Source 2024 & 2032
- Figure 15: North America Tannins Market Revenue Share (%), by Source 2024 & 2032
- Figure 16: North America Tannins Market Revenue (Million), by Application 2024 & 2032
- Figure 17: North America Tannins Market Revenue Share (%), by Application 2024 & 2032
- Figure 18: North America Tannins Market Revenue (Million), by Country 2024 & 2032
- Figure 19: North America Tannins Market Revenue Share (%), by Country 2024 & 2032
- Figure 20: Europe Tannins Market Revenue (Million), by Source 2024 & 2032
- Figure 21: Europe Tannins Market Revenue Share (%), by Source 2024 & 2032
- Figure 22: Europe Tannins Market Revenue (Million), by Application 2024 & 2032
- Figure 23: Europe Tannins Market Revenue Share (%), by Application 2024 & 2032
- Figure 24: Europe Tannins Market Revenue (Million), by Country 2024 & 2032
- Figure 25: Europe Tannins Market Revenue Share (%), by Country 2024 & 2032
- Figure 26: Asia Pacific Tannins Market Revenue (Million), by Source 2024 & 2032
- Figure 27: Asia Pacific Tannins Market Revenue Share (%), by Source 2024 & 2032
- Figure 28: Asia Pacific Tannins Market Revenue (Million), by Application 2024 & 2032
- Figure 29: Asia Pacific Tannins Market Revenue Share (%), by Application 2024 & 2032
- Figure 30: Asia Pacific Tannins Market Revenue (Million), by Country 2024 & 2032
- Figure 31: Asia Pacific Tannins Market Revenue Share (%), by Country 2024 & 2032
- Figure 32: South America Tannins Market Revenue (Million), by Source 2024 & 2032
- Figure 33: South America Tannins Market Revenue Share (%), by Source 2024 & 2032
- Figure 34: South America Tannins Market Revenue (Million), by Application 2024 & 2032
- Figure 35: South America Tannins Market Revenue Share (%), by Application 2024 & 2032
- Figure 36: South America Tannins Market Revenue (Million), by Country 2024 & 2032
- Figure 37: South America Tannins Market Revenue Share (%), by Country 2024 & 2032
- Figure 38: Middle East Tannins Market Revenue (Million), by Source 2024 & 2032
- Figure 39: Middle East Tannins Market Revenue Share (%), by Source 2024 & 2032
- Figure 40: Middle East Tannins Market Revenue (Million), by Application 2024 & 2032
- Figure 41: Middle East Tannins Market Revenue Share (%), by Application 2024 & 2032
- Figure 42: Middle East Tannins Market Revenue (Million), by Country 2024 & 2032
- Figure 43: Middle East Tannins Market Revenue Share (%), by Country 2024 & 2032
- Figure 44: South Africa Tannins Market Revenue (Million), by Source 2024 & 2032
- Figure 45: South Africa Tannins Market Revenue Share (%), by Source 2024 & 2032
- Figure 46: South Africa Tannins Market Revenue (Million), by Application 2024 & 2032
- Figure 47: South Africa Tannins Market Revenue Share (%), by Application 2024 & 2032
- Figure 48: South Africa Tannins Market Revenue (Million), by Country 2024 & 2032
- Figure 49: South Africa Tannins Market Revenue Share (%), by Country 2024 & 2032
List of Tables
- Table 1: Global Tannins Market Revenue Million Forecast, by Region 2019 & 2032
- Table 2: Global Tannins Market Revenue Million Forecast, by Source 2019 & 2032
- Table 3: Global Tannins Market Revenue Million Forecast, by Application 2019 & 2032
- Table 4: Global Tannins Market Revenue Million Forecast, by Region 2019 & 2032
- Table 5: Global Tannins Market Revenue Million Forecast, by Country 2019 & 2032
- Table 6: United States Tannins Market Revenue (Million) Forecast, by Application 2019 & 2032
- Table 7: Canada Tannins Market Revenue (Million) Forecast, by Application 2019 & 2032
- Table 8: Mexico Tannins Market Revenue (Million) Forecast, by Application 2019 & 2032
- Table 9: Rest of North America Tannins Market Revenue (Million) Forecast, by Application 2019 & 2032
- Table 10: Global Tannins Market Revenue Million Forecast, by Country 2019 & 2032
- Table 11: United Kingdom Tannins Market Revenue (Million) Forecast, by Application 2019 & 2032
- Table 12: Germany Tannins Market Revenue (Million) Forecast, by Application 2019 & 2032
- Table 13: France Tannins Market Revenue (Million) Forecast, by Application 2019 & 2032
- Table 14: Russia Tannins Market Revenue (Million) Forecast, by Application 2019 & 2032
- Table 15: Italy Tannins Market Revenue (Million) Forecast, by Application 2019 & 2032
- Table 16: Spain Tannins Market Revenue (Million) Forecast, by Application 2019 & 2032
- Table 17: Rest of Europe Tannins Market Revenue (Million) Forecast, by Application 2019 & 2032
- Table 18: Global Tannins Market Revenue Million Forecast, by Country 2019 & 2032
- Table 19: India Tannins Market Revenue (Million) Forecast, by Application 2019 & 2032
- Table 20: China Tannins Market Revenue (Million) Forecast, by Application 2019 & 2032
- Table 21: Japan Tannins Market Revenue (Million) Forecast, by Application 2019 & 2032
- Table 22: Australia Tannins Market Revenue (Million) Forecast, by Application 2019 & 2032
- Table 23: Rest of Asia Pacific Tannins Market Revenue (Million) Forecast, by Application 2019 & 2032
- Table 24: Global Tannins Market Revenue Million Forecast, by Country 2019 & 2032
- Table 25: Brazil Tannins Market Revenue (Million) Forecast, by Application 2019 & 2032
- Table 26: Argentina Tannins Market Revenue (Million) Forecast, by Application 2019 & 2032
- Table 27: Rest of South America Tannins Market Revenue (Million) Forecast, by Application 2019 & 2032
- Table 28: Global Tannins Market Revenue Million Forecast, by Country 2019 & 2032
- Table 29: Tannins Market Revenue (Million) Forecast, by Application 2019 & 2032
- Table 30: Global Tannins Market Revenue Million Forecast, by Country 2019 & 2032
- Table 31: Saudi Arabia Tannins Market Revenue (Million) Forecast, by Application 2019 & 2032
- Table 32: Rest of MEA Tannins Market Revenue (Million) Forecast, by Application 2019 & 2032
- Table 33: Global Tannins Market Revenue Million Forecast, by Source 2019 & 2032
- Table 34: Global Tannins Market Revenue Million Forecast, by Application 2019 & 2032
- Table 35: Global Tannins Market Revenue Million Forecast, by Country 2019 & 2032
- Table 36: United States Tannins Market Revenue (Million) Forecast, by Application 2019 & 2032
- Table 37: Canada Tannins Market Revenue (Million) Forecast, by Application 2019 & 2032
- Table 38: Mexico Tannins Market Revenue (Million) Forecast, by Application 2019 & 2032
- Table 39: Rest of North America Tannins Market Revenue (Million) Forecast, by Application 2019 & 2032
- Table 40: Global Tannins Market Revenue Million Forecast, by Source 2019 & 2032
- Table 41: Global Tannins Market Revenue Million Forecast, by Application 2019 & 2032
- Table 42: Global Tannins Market Revenue Million Forecast, by Country 2019 & 2032
- Table 43: United Kingdom Tannins Market Revenue (Million) Forecast, by Application 2019 & 2032
- Table 44: Germany Tannins Market Revenue (Million) Forecast, by Application 2019 & 2032
- Table 45: France Tannins Market Revenue (Million) Forecast, by Application 2019 & 2032
- Table 46: Russia Tannins Market Revenue (Million) Forecast, by Application 2019 & 2032
- Table 47: Italy Tannins Market Revenue (Million) Forecast, by Application 2019 & 2032
- Table 48: Spain Tannins Market Revenue (Million) Forecast, by Application 2019 & 2032
- Table 49: Rest of Europe Tannins Market Revenue (Million) Forecast, by Application 2019 & 2032
- Table 50: Global Tannins Market Revenue Million Forecast, by Source 2019 & 2032
- Table 51: Global Tannins Market Revenue Million Forecast, by Application 2019 & 2032
- Table 52: Global Tannins Market Revenue Million Forecast, by Country 2019 & 2032
- Table 53: India Tannins Market Revenue (Million) Forecast, by Application 2019 & 2032
- Table 54: China Tannins Market Revenue (Million) Forecast, by Application 2019 & 2032
- Table 55: Japan Tannins Market Revenue (Million) Forecast, by Application 2019 & 2032
- Table 56: Australia Tannins Market Revenue (Million) Forecast, by Application 2019 & 2032
- Table 57: Rest of Asia Pacific Tannins Market Revenue (Million) Forecast, by Application 2019 & 2032
- Table 58: Global Tannins Market Revenue Million Forecast, by Source 2019 & 2032
- Table 59: Global Tannins Market Revenue Million Forecast, by Application 2019 & 2032
- Table 60: Global Tannins Market Revenue Million Forecast, by Country 2019 & 2032
- Table 61: Brazil Tannins Market Revenue (Million) Forecast, by Application 2019 & 2032
- Table 62: Argentina Tannins Market Revenue (Million) Forecast, by Application 2019 & 2032
- Table 63: Rest of South America Tannins Market Revenue (Million) Forecast, by Application 2019 & 2032
- Table 64: Global Tannins Market Revenue Million Forecast, by Source 2019 & 2032
- Table 65: Global Tannins Market Revenue Million Forecast, by Application 2019 & 2032
- Table 66: Global Tannins Market Revenue Million Forecast, by Country 2019 & 2032
- Table 67: Global Tannins Market Revenue Million Forecast, by Source 2019 & 2032
- Table 68: Global Tannins Market Revenue Million Forecast, by Application 2019 & 2032
- Table 69: Global Tannins Market Revenue Million Forecast, by Country 2019 & 2032
- Table 70: Saudi Arabia Tannins Market Revenue (Million) Forecast, by Application 2019 & 2032
- Table 71: Rest of MEA Tannins Market Revenue (Million) Forecast, by Application 2019 & 2032
Frequently Asked Questions
1. What is the projected Compound Annual Growth Rate (CAGR) of the Tannins Market?
The projected CAGR is approximately 6.00%.
2. Which companies are prominent players in the Tannins Market?
Key companies in the market include Tannin Corporation, Silvateam S p a, Laffort, W Ulrich GmbH, S A Ajinomoto OmniChem N V, Jyoti Dye Chem Agency*List Not Exhaustive, Tanac S A, EVER s r l.
3. What are the main segments of the Tannins Market?
The market segments include Source, Application.
4. Can you provide details about the market size?
The market size is estimated to be USD XX Million as of 2022.
5. What are some drivers contributing to market growth?
Increasing Demand for Protein-Rich Food; Increasing Demand for Plant-Based and Organic Ingredients.
6. What are the notable trends driving market growth?
Rising Demand For Plant-based Tannin Extracts.
7. Are there any restraints impacting market growth?
Presence of Alternative Proteins.
8. Can you provide examples of recent developments in the market?
N/A
9. What pricing options are available for accessing the report?
Pricing options include single-user, multi-user, and enterprise licenses priced at USD 4750, USD 5250, and USD 8750 respectively.
10. Is the market size provided in terms of value or volume?
The market size is provided in terms of value, measured in Million.
11. Are there any specific market keywords associated with the report?
Yes, the market keyword associated with the report is "Tannins Market," which aids in identifying and referencing the specific market segment covered.
12. How do I determine which pricing option suits my needs best?
The pricing options vary based on user requirements and access needs. Individual users may opt for single-user licenses, while businesses requiring broader access may choose multi-user or enterprise licenses for cost-effective access to the report.
13. Are there any additional resources or data provided in the Tannins Market report?
While the report offers comprehensive insights, it's advisable to review the specific contents or supplementary materials provided to ascertain if additional resources or data are available.
14. How can I stay updated on further developments or reports in the Tannins Market?
To stay informed about further developments, trends, and reports in the Tannins Market, consider subscribing to industry newsletters, following relevant companies and organizations, or regularly checking reputable industry news sources and publications.
Methodology
Step 1 - Identification of Relevant Samples Size from Population Database


Step 2 - Approaches for Defining Global Market Size (Value, Volume* & Price*)

Note*: In applicable scenarios
Step 3 - Data Sources
Primary Research
- Web Analytics
- Survey Reports
- Research Institute
- Latest Research Reports
- Opinion Leaders
Secondary Research
- Annual Reports
- White Paper
- Latest Press Release
- Industry Association
- Paid Database
- Investor Presentations

Step 4 - Data Triangulation
Involves using different sources of information in order to increase the validity of a study
These sources are likely to be stakeholders in a program - participants, other researchers, program staff, other community members, and so on.
Then we put all data in single framework & apply various statistical tools to find out the dynamic on the market.
During the analysis stage, feedback from the stakeholder groups would be compared to determine areas of agreement as well as areas of divergence


