
Key Insights
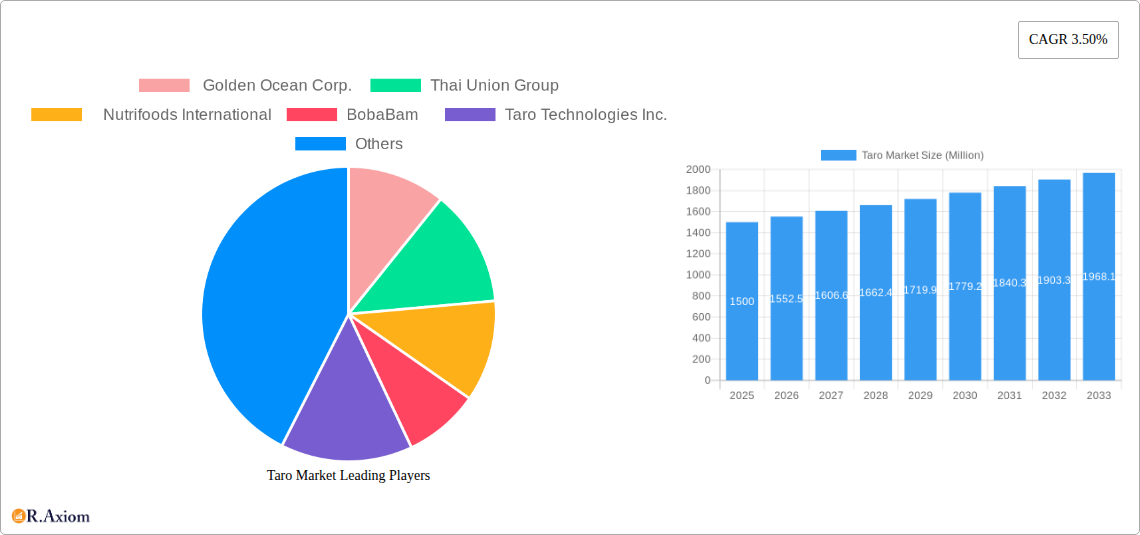
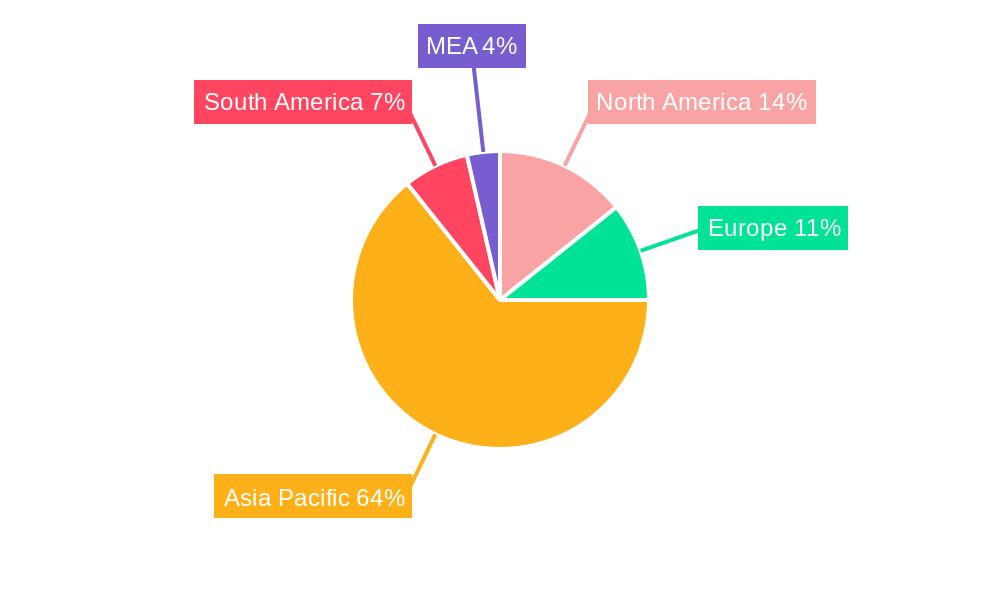
The global taro market, valued at approximately $1.5 billion in 2025, is projected to experience steady growth at a compound annual growth rate (CAGR) of 3.5% from 2025 to 2033. This growth is driven by increasing consumer demand for healthy and nutritious food products, the rising popularity of taro-based food and beverages, and its expanding use in the pharmaceutical and cosmetic industries. The versatility of taro, enabling its use in various forms like fresh taro, flour, and chips, further fuels market expansion. Key applications include food and beverages (dominating the market share), followed by pharmaceutical and cosmetic uses. The food processing industry remains a major end-user segment, with retail stores and food service outlets showing significant growth potential. Geographic expansion is also a significant factor, with Asia-Pacific expected to lead the market due to high taro consumption and cultivation in countries like China, India, and Southeast Asia. However, challenges such as seasonal variations in taro production, susceptibility to pests and diseases, and limitations in processing and preservation technologies may present some constraints to market growth. Nevertheless, ongoing research and development focused on improving taro cultivation techniques and expanding its applications are expected to mitigate these challenges and maintain a steady market trajectory.
The North American market, characterized by a growing awareness of health benefits and a diverse culinary landscape, is witnessing increasing demand for taro-based products. Europe exhibits a relatively smaller market share compared to Asia-Pacific, primarily driven by the consumption of taro-based foods in niche markets. Emerging markets in South America and the Middle East & Africa, while currently showing lower adoption, present lucrative opportunities for future growth as consumer preferences evolve and awareness of taro's nutritional value increases. The presence of key players like Golden Ocean Corp., Thai Union Group, and Nutrifoods International indicates a competitive landscape with ongoing investments in product innovation and market expansion strategies. The market is expected to see increasing product diversification, improved supply chain management, and the development of sustainable cultivation practices in the coming years.
This comprehensive report provides an in-depth analysis of the Taro Market, projecting a robust growth trajectory fueled by increasing consumer demand and innovative product applications. The study period spans from 2019 to 2033, with 2025 serving as the base and estimated year. The report meticulously examines market segmentation, key players, growth drivers, challenges, and emerging opportunities, offering actionable insights for industry stakeholders. The market size is projected to reach xx Million by 2033, exhibiting a CAGR of xx% during the forecast period (2025-2033).
Taro Market Concentration & Innovation
The Taro market exhibits a moderately concentrated landscape, with a few large players like Thai Union Group and Nutrifoods International holding significant market share. However, the market also accommodates several smaller, specialized companies like BobaBam focusing on niche segments. The market share of the top 5 players is estimated at xx%. Innovation is driven by the development of new Taro-based products, improved processing techniques, and the exploration of novel applications beyond traditional food and beverage segments. The market witnesses consistent M&A activity, with deal values averaging xx Million annually during the historical period (2019-2024). Regulatory frameworks, while largely supportive, vary across regions, impacting market access and product standards. Substitutes for Taro exist but often lack the unique flavor profile and nutritional benefits, limiting their overall market impact. End-user trends point towards increasing demand for convenient, ready-to-consume Taro products and those emphasizing health and wellness.
- Market Share (Top 5 Players): xx%
- Average M&A Deal Value (2019-2024): xx Million
- Key Innovation Drivers: New product development, improved processing, expanding applications.
Taro Market Industry Trends & Insights
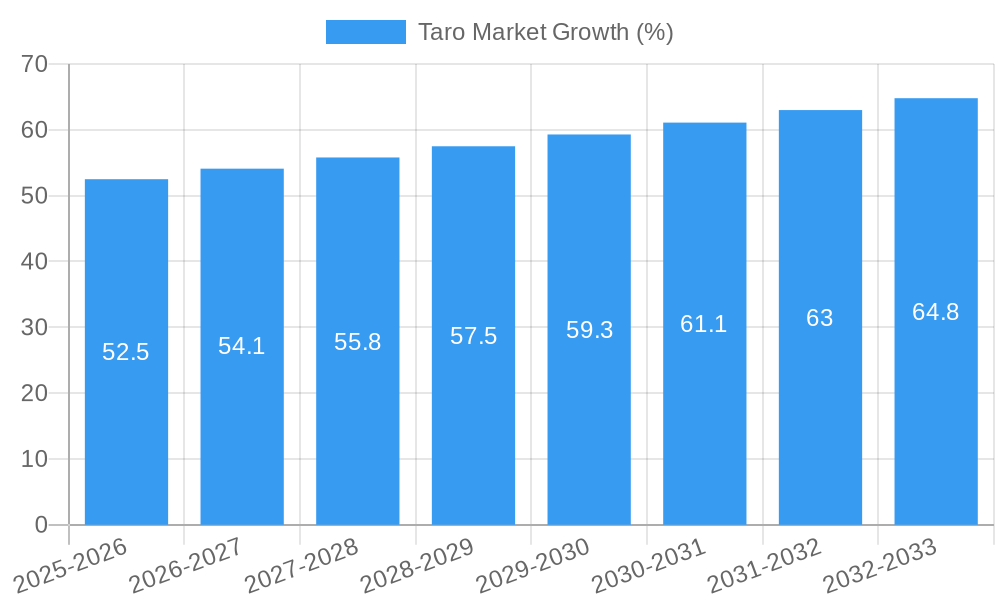
The Taro market is experiencing significant growth driven by the rising popularity of Taro-based products in food and beverage applications, particularly in Asia and North America. Consumer preferences are shifting toward healthier and more convenient food options, leading to an increased demand for Taro flour, chips, and other processed products. Technological advancements in processing and packaging are further enhancing product quality and shelf life, contributing to market expansion. The CAGR for the Taro market during the forecast period (2025-2033) is projected at xx%. Market penetration is highest in the food and beverage segment, followed by pharmaceutical and cosmetic applications. Competitive dynamics are characterized by both established players and emerging businesses vying for market share through product diversification, brand building, and strategic partnerships. The increasing adoption of online retail channels is also a major trend, opening new avenues for market growth.
Dominant Markets & Segments in Taro Market
The Asia-Pacific region dominates the global Taro market, primarily driven by strong consumer demand in countries like China and India. Within product types, Fresh Taro holds the largest market share, followed by Taro flour and Taro chips. The Food and Beverage application segment leads in market value, with consistent growth anticipated across all end-users including Food Processors, Retail Stores and Food Service channels.
- Leading Region: Asia-Pacific
- Key Drivers (Asia-Pacific): Large consumer base, increasing disposable incomes, favorable government policies.
- Dominant Product Type: Fresh Taro
- Dominant Application: Food and Beverage
- Dominant End-User: Food Processors
Detailed Dominance Analysis: The dominance of Asia-Pacific stems from established cultivation practices and strong cultural preference for Taro. The high market share of fresh Taro reflects the preference for natural products and traditional culinary practices. The Food and Beverage sector’s dominance is fueled by the versatility of Taro in diverse food and beverage applications.
Taro Market Product Developments
Recent product innovations focus on creating convenient, ready-to-consume Taro products, such as ready-to-drink beverages, pre-packaged snacks, and instant Taro mixes. These developments are aimed at capturing the growing demand for convenient and healthy food options. Technological advancements in processing and preservation techniques are enabling the creation of high-quality, long-shelf-life Taro products, expanding market reach. The market also witnesses the growing integration of Taro into other food categories, promoting market expansion and catering to diverse consumer preferences.
Report Scope & Segmentation Analysis
This report offers a comprehensive segmentation analysis of the Taro market across various parameters.
By Product Type: Fresh Taro, Taro Flour, Taro Chips, Other Products (each segment includes growth projections, market size estimates, and competitive dynamics).
By Application: Food and Beverage, Pharmaceutical & Cosmetic, Other Applications (each segment includes growth projections, market size estimates, and competitive dynamics).
By End-User: Food Processors, Retail Stores, Food Service, Others (each segment includes growth projections, market size estimates, and competitive dynamics).
Key Drivers of Taro Market Growth
The Taro market's growth is primarily driven by:
- Rising consumer demand: Increasing awareness of Taro's nutritional benefits and its versatility in culinary applications.
- Technological advancements: Improved processing and packaging techniques enhance product quality and shelf life.
- Favorable government policies: Support for Taro cultivation and processing in several regions.
Challenges in the Taro Market Sector
The Taro market faces challenges including:
- Supply chain disruptions: Climate change and disease outbreaks can significantly impact Taro production.
- Price volatility: Fluctuations in Taro prices due to seasonal variations and supply constraints.
- Competition from substitute products: Other root vegetables and starches compete with Taro in various applications.
Emerging Opportunities in Taro Market
Emerging opportunities include:
- Expansion into new markets: Untapped potential in developing countries with rising disposable incomes.
- Development of novel Taro-based products: Exploring new applications in functional foods, dietary supplements, and cosmetics.
- Sustainable cultivation practices: Promoting environmentally friendly farming methods to ensure long-term Taro production.
Leading Players in the Taro Market Market
- Golden Ocean Corp.
- Thai Union Group
- Nutrifoods International
- BobaBam
- Taro Technologies Inc.
Key Developments in Taro Market Industry
- January 2023: BobaBam launched new Milk Tea and Taro flavor variety packs, boosting sales within the beverage sector.
- March 2022: Harvesting of a record-breaking 50-pound taro root in Hawaii highlights the potential for increased production and innovation.
Strategic Outlook for Taro Market Market
The Taro market presents a promising outlook with significant growth potential. Continued innovation in product development, coupled with expanding consumer awareness of Taro's nutritional value and versatility, will drive market expansion. Strategic partnerships, sustainable cultivation practices, and effective supply chain management will play crucial roles in securing long-term market success. The market is poised for further diversification, with applications beyond traditional culinary uses likely to contribute significantly to overall growth.
Taro Market Segmentation
- 1. Production Analysis
- 2. Consumption Analysis
- 3. Import Market Analysis (Value & Volume)
- 4. Export Market Analysis (Value & Volume)
- 5. Price Trend Analysis
Taro Market Segmentation By Geography
-
1. North America
- 1.1. United States
-
2. Europe
- 2.1. France
-
3. Asia Pacific
- 3.1. China
-
4. South America
- 4.1. Brazil
-
5. Middle East And Africa
- 5.1. Turkey
Taro Market REPORT HIGHLIGHTS
| Aspects | Details |
|---|---|
| Study Period | 2019-2033 |
| Base Year | 2024 |
| Estimated Year | 2025 |
| Forecast Period | 2025-2033 |
| Historical Period | 2019-2024 |
| Growth Rate | CAGR of 3.50% from 2019-2033 |
| Segmentation |
|
Table of Contents
- 1. Introduction
- 1.1. Research Scope
- 1.2. Market Segmentation
- 1.3. Research Methodology
- 1.4. Definitions and Assumptions
- 2. Executive Summary
- 2.1. Introduction
- 3. Market Dynamics
- 3.1. Introduction
- 3.2. Market Drivers
- 3.2.1. ; Awareness About Health Benefits Associated With Pecan Consumption; Wide Application of Pecan
- 3.3. Market Restrains
- 3.3.1. ; Volatility in the Prices; Adverse Weather Conditions Affecting Yield
- 3.4. Market Trends
- 3.4.1. Strong Growth in Taro Production
- 4. Market Factor Analysis
- 4.1. Porters Five Forces
- 4.2. Supply/Value Chain
- 4.3. PESTEL analysis
- 4.4. Market Entropy
- 4.5. Patent/Trademark Analysis
- 5. Global Taro Market Analysis, Insights and Forecast, 2019-2031
- 5.1. Market Analysis, Insights and Forecast - by Production Analysis
- 5.2. Market Analysis, Insights and Forecast - by Consumption Analysis
- 5.3. Market Analysis, Insights and Forecast - by Import Market Analysis (Value & Volume)
- 5.4. Market Analysis, Insights and Forecast - by Export Market Analysis (Value & Volume)
- 5.5. Market Analysis, Insights and Forecast - by Price Trend Analysis
- 5.6. Market Analysis, Insights and Forecast - by Region
- 5.6.1. North America
- 5.6.2. Europe
- 5.6.3. Asia Pacific
- 5.6.4. South America
- 5.6.5. Middle East And Africa
- 5.1. Market Analysis, Insights and Forecast - by Production Analysis
- 6. North America Taro Market Analysis, Insights and Forecast, 2019-2031
- 6.1. Market Analysis, Insights and Forecast - by Production Analysis
- 6.2. Market Analysis, Insights and Forecast - by Consumption Analysis
- 6.3. Market Analysis, Insights and Forecast - by Import Market Analysis (Value & Volume)
- 6.4. Market Analysis, Insights and Forecast - by Export Market Analysis (Value & Volume)
- 6.5. Market Analysis, Insights and Forecast - by Price Trend Analysis
- 6.1. Market Analysis, Insights and Forecast - by Production Analysis
- 7. Europe Taro Market Analysis, Insights and Forecast, 2019-2031
- 7.1. Market Analysis, Insights and Forecast - by Production Analysis
- 7.2. Market Analysis, Insights and Forecast - by Consumption Analysis
- 7.3. Market Analysis, Insights and Forecast - by Import Market Analysis (Value & Volume)
- 7.4. Market Analysis, Insights and Forecast - by Export Market Analysis (Value & Volume)
- 7.5. Market Analysis, Insights and Forecast - by Price Trend Analysis
- 7.1. Market Analysis, Insights and Forecast - by Production Analysis
- 8. Asia Pacific Taro Market Analysis, Insights and Forecast, 2019-2031
- 8.1. Market Analysis, Insights and Forecast - by Production Analysis
- 8.2. Market Analysis, Insights and Forecast - by Consumption Analysis
- 8.3. Market Analysis, Insights and Forecast - by Import Market Analysis (Value & Volume)
- 8.4. Market Analysis, Insights and Forecast - by Export Market Analysis (Value & Volume)
- 8.5. Market Analysis, Insights and Forecast - by Price Trend Analysis
- 8.1. Market Analysis, Insights and Forecast - by Production Analysis
- 9. South America Taro Market Analysis, Insights and Forecast, 2019-2031
- 9.1. Market Analysis, Insights and Forecast - by Production Analysis
- 9.2. Market Analysis, Insights and Forecast - by Consumption Analysis
- 9.3. Market Analysis, Insights and Forecast - by Import Market Analysis (Value & Volume)
- 9.4. Market Analysis, Insights and Forecast - by Export Market Analysis (Value & Volume)
- 9.5. Market Analysis, Insights and Forecast - by Price Trend Analysis
- 9.1. Market Analysis, Insights and Forecast - by Production Analysis
- 10. Middle East And Africa Taro Market Analysis, Insights and Forecast, 2019-2031
- 10.1. Market Analysis, Insights and Forecast - by Production Analysis
- 10.2. Market Analysis, Insights and Forecast - by Consumption Analysis
- 10.3. Market Analysis, Insights and Forecast - by Import Market Analysis (Value & Volume)
- 10.4. Market Analysis, Insights and Forecast - by Export Market Analysis (Value & Volume)
- 10.5. Market Analysis, Insights and Forecast - by Price Trend Analysis
- 10.1. Market Analysis, Insights and Forecast - by Production Analysis
- 11. North America Taro Market Analysis, Insights and Forecast, 2019-2031
- 11.1. Market Analysis, Insights and Forecast - By Country/Sub-region
- 11.1.1 United States
- 11.1.2 Canada
- 11.1.3 Mexico
- 12. Europe Taro Market Analysis, Insights and Forecast, 2019-2031
- 12.1. Market Analysis, Insights and Forecast - By Country/Sub-region
- 12.1.1 Germany
- 12.1.2 United Kingdom
- 12.1.3 France
- 12.1.4 Spain
- 12.1.5 Italy
- 12.1.6 Spain
- 12.1.7 Belgium
- 12.1.8 Netherland
- 12.1.9 Nordics
- 12.1.10 Rest of Europe
- 13. Asia Pacific Taro Market Analysis, Insights and Forecast, 2019-2031
- 13.1. Market Analysis, Insights and Forecast - By Country/Sub-region
- 13.1.1 China
- 13.1.2 Japan
- 13.1.3 India
- 13.1.4 South Korea
- 13.1.5 Southeast Asia
- 13.1.6 Australia
- 13.1.7 Indonesia
- 13.1.8 Phillipes
- 13.1.9 Singapore
- 13.1.10 Thailandc
- 13.1.11 Rest of Asia Pacific
- 14. South America Taro Market Analysis, Insights and Forecast, 2019-2031
- 14.1. Market Analysis, Insights and Forecast - By Country/Sub-region
- 14.1.1 Brazil
- 14.1.2 Argentina
- 14.1.3 Peru
- 14.1.4 Chile
- 14.1.5 Colombia
- 14.1.6 Ecuador
- 14.1.7 Venezuela
- 14.1.8 Rest of South America
- 15. MEA Taro Market Analysis, Insights and Forecast, 2019-2031
- 15.1. Market Analysis, Insights and Forecast - By Country/Sub-region
- 15.1.1 United Arab Emirates
- 15.1.2 Saudi Arabia
- 15.1.3 South Africa
- 15.1.4 Rest of Middle East and Africa
- 16. Competitive Analysis
- 16.1. Global Market Share Analysis 2024
- 16.2. Company Profiles
- 16.2.1 Golden Ocean Corp.
- 16.2.1.1. Overview
- 16.2.1.2. Products
- 16.2.1.3. SWOT Analysis
- 16.2.1.4. Recent Developments
- 16.2.1.5. Financials (Based on Availability)
- 16.2.2 Thai Union Group
- 16.2.2.1. Overview
- 16.2.2.2. Products
- 16.2.2.3. SWOT Analysis
- 16.2.2.4. Recent Developments
- 16.2.2.5. Financials (Based on Availability)
- 16.2.3 Nutrifoods International
- 16.2.3.1. Overview
- 16.2.3.2. Products
- 16.2.3.3. SWOT Analysis
- 16.2.3.4. Recent Developments
- 16.2.3.5. Financials (Based on Availability)
- 16.2.4 BobaBam
- 16.2.4.1. Overview
- 16.2.4.2. Products
- 16.2.4.3. SWOT Analysis
- 16.2.4.4. Recent Developments
- 16.2.4.5. Financials (Based on Availability)
- 16.2.5 Taro Technologies Inc.
- 16.2.5.1. Overview
- 16.2.5.2. Products
- 16.2.5.3. SWOT Analysis
- 16.2.5.4. Recent Developments
- 16.2.5.5. Financials (Based on Availability)
- 16.2.1 Golden Ocean Corp.
List of Figures
- Figure 1: Global Taro Market Revenue Breakdown (Million, %) by Region 2024 & 2032
- Figure 2: Global Taro Market Volume Breakdown (Kiloton, %) by Region 2024 & 2032
- Figure 3: North America Taro Market Revenue (Million), by Country 2024 & 2032
- Figure 4: North America Taro Market Volume (Kiloton), by Country 2024 & 2032
- Figure 5: North America Taro Market Revenue Share (%), by Country 2024 & 2032
- Figure 6: North America Taro Market Volume Share (%), by Country 2024 & 2032
- Figure 7: Europe Taro Market Revenue (Million), by Country 2024 & 2032
- Figure 8: Europe Taro Market Volume (Kiloton), by Country 2024 & 2032
- Figure 9: Europe Taro Market Revenue Share (%), by Country 2024 & 2032
- Figure 10: Europe Taro Market Volume Share (%), by Country 2024 & 2032
- Figure 11: Asia Pacific Taro Market Revenue (Million), by Country 2024 & 2032
- Figure 12: Asia Pacific Taro Market Volume (Kiloton), by Country 2024 & 2032
- Figure 13: Asia Pacific Taro Market Revenue Share (%), by Country 2024 & 2032
- Figure 14: Asia Pacific Taro Market Volume Share (%), by Country 2024 & 2032
- Figure 15: South America Taro Market Revenue (Million), by Country 2024 & 2032
- Figure 16: South America Taro Market Volume (Kiloton), by Country 2024 & 2032
- Figure 17: South America Taro Market Revenue Share (%), by Country 2024 & 2032
- Figure 18: South America Taro Market Volume Share (%), by Country 2024 & 2032
- Figure 19: MEA Taro Market Revenue (Million), by Country 2024 & 2032
- Figure 20: MEA Taro Market Volume (Kiloton), by Country 2024 & 2032
- Figure 21: MEA Taro Market Revenue Share (%), by Country 2024 & 2032
- Figure 22: MEA Taro Market Volume Share (%), by Country 2024 & 2032
- Figure 23: North America Taro Market Revenue (Million), by Production Analysis 2024 & 2032
- Figure 24: North America Taro Market Volume (Kiloton), by Production Analysis 2024 & 2032
- Figure 25: North America Taro Market Revenue Share (%), by Production Analysis 2024 & 2032
- Figure 26: North America Taro Market Volume Share (%), by Production Analysis 2024 & 2032
- Figure 27: North America Taro Market Revenue (Million), by Consumption Analysis 2024 & 2032
- Figure 28: North America Taro Market Volume (Kiloton), by Consumption Analysis 2024 & 2032
- Figure 29: North America Taro Market Revenue Share (%), by Consumption Analysis 2024 & 2032
- Figure 30: North America Taro Market Volume Share (%), by Consumption Analysis 2024 & 2032
- Figure 31: North America Taro Market Revenue (Million), by Import Market Analysis (Value & Volume) 2024 & 2032
- Figure 32: North America Taro Market Volume (Kiloton), by Import Market Analysis (Value & Volume) 2024 & 2032
- Figure 33: North America Taro Market Revenue Share (%), by Import Market Analysis (Value & Volume) 2024 & 2032
- Figure 34: North America Taro Market Volume Share (%), by Import Market Analysis (Value & Volume) 2024 & 2032
- Figure 35: North America Taro Market Revenue (Million), by Export Market Analysis (Value & Volume) 2024 & 2032
- Figure 36: North America Taro Market Volume (Kiloton), by Export Market Analysis (Value & Volume) 2024 & 2032
- Figure 37: North America Taro Market Revenue Share (%), by Export Market Analysis (Value & Volume) 2024 & 2032
- Figure 38: North America Taro Market Volume Share (%), by Export Market Analysis (Value & Volume) 2024 & 2032
- Figure 39: North America Taro Market Revenue (Million), by Price Trend Analysis 2024 & 2032
- Figure 40: North America Taro Market Volume (Kiloton), by Price Trend Analysis 2024 & 2032
- Figure 41: North America Taro Market Revenue Share (%), by Price Trend Analysis 2024 & 2032
- Figure 42: North America Taro Market Volume Share (%), by Price Trend Analysis 2024 & 2032
- Figure 43: North America Taro Market Revenue (Million), by Country 2024 & 2032
- Figure 44: North America Taro Market Volume (Kiloton), by Country 2024 & 2032
- Figure 45: North America Taro Market Revenue Share (%), by Country 2024 & 2032
- Figure 46: North America Taro Market Volume Share (%), by Country 2024 & 2032
- Figure 47: Europe Taro Market Revenue (Million), by Production Analysis 2024 & 2032
- Figure 48: Europe Taro Market Volume (Kiloton), by Production Analysis 2024 & 2032
- Figure 49: Europe Taro Market Revenue Share (%), by Production Analysis 2024 & 2032
- Figure 50: Europe Taro Market Volume Share (%), by Production Analysis 2024 & 2032
- Figure 51: Europe Taro Market Revenue (Million), by Consumption Analysis 2024 & 2032
- Figure 52: Europe Taro Market Volume (Kiloton), by Consumption Analysis 2024 & 2032
- Figure 53: Europe Taro Market Revenue Share (%), by Consumption Analysis 2024 & 2032
- Figure 54: Europe Taro Market Volume Share (%), by Consumption Analysis 2024 & 2032
- Figure 55: Europe Taro Market Revenue (Million), by Import Market Analysis (Value & Volume) 2024 & 2032
- Figure 56: Europe Taro Market Volume (Kiloton), by Import Market Analysis (Value & Volume) 2024 & 2032
- Figure 57: Europe Taro Market Revenue Share (%), by Import Market Analysis (Value & Volume) 2024 & 2032
- Figure 58: Europe Taro Market Volume Share (%), by Import Market Analysis (Value & Volume) 2024 & 2032
- Figure 59: Europe Taro Market Revenue (Million), by Export Market Analysis (Value & Volume) 2024 & 2032
- Figure 60: Europe Taro Market Volume (Kiloton), by Export Market Analysis (Value & Volume) 2024 & 2032
- Figure 61: Europe Taro Market Revenue Share (%), by Export Market Analysis (Value & Volume) 2024 & 2032
- Figure 62: Europe Taro Market Volume Share (%), by Export Market Analysis (Value & Volume) 2024 & 2032
- Figure 63: Europe Taro Market Revenue (Million), by Price Trend Analysis 2024 & 2032
- Figure 64: Europe Taro Market Volume (Kiloton), by Price Trend Analysis 2024 & 2032
- Figure 65: Europe Taro Market Revenue Share (%), by Price Trend Analysis 2024 & 2032
- Figure 66: Europe Taro Market Volume Share (%), by Price Trend Analysis 2024 & 2032
- Figure 67: Europe Taro Market Revenue (Million), by Country 2024 & 2032
- Figure 68: Europe Taro Market Volume (Kiloton), by Country 2024 & 2032
- Figure 69: Europe Taro Market Revenue Share (%), by Country 2024 & 2032
- Figure 70: Europe Taro Market Volume Share (%), by Country 2024 & 2032
- Figure 71: Asia Pacific Taro Market Revenue (Million), by Production Analysis 2024 & 2032
- Figure 72: Asia Pacific Taro Market Volume (Kiloton), by Production Analysis 2024 & 2032
- Figure 73: Asia Pacific Taro Market Revenue Share (%), by Production Analysis 2024 & 2032
- Figure 74: Asia Pacific Taro Market Volume Share (%), by Production Analysis 2024 & 2032
- Figure 75: Asia Pacific Taro Market Revenue (Million), by Consumption Analysis 2024 & 2032
- Figure 76: Asia Pacific Taro Market Volume (Kiloton), by Consumption Analysis 2024 & 2032
- Figure 77: Asia Pacific Taro Market Revenue Share (%), by Consumption Analysis 2024 & 2032
- Figure 78: Asia Pacific Taro Market Volume Share (%), by Consumption Analysis 2024 & 2032
- Figure 79: Asia Pacific Taro Market Revenue (Million), by Import Market Analysis (Value & Volume) 2024 & 2032
- Figure 80: Asia Pacific Taro Market Volume (Kiloton), by Import Market Analysis (Value & Volume) 2024 & 2032
- Figure 81: Asia Pacific Taro Market Revenue Share (%), by Import Market Analysis (Value & Volume) 2024 & 2032
- Figure 82: Asia Pacific Taro Market Volume Share (%), by Import Market Analysis (Value & Volume) 2024 & 2032
- Figure 83: Asia Pacific Taro Market Revenue (Million), by Export Market Analysis (Value & Volume) 2024 & 2032
- Figure 84: Asia Pacific Taro Market Volume (Kiloton), by Export Market Analysis (Value & Volume) 2024 & 2032
- Figure 85: Asia Pacific Taro Market Revenue Share (%), by Export Market Analysis (Value & Volume) 2024 & 2032
- Figure 86: Asia Pacific Taro Market Volume Share (%), by Export Market Analysis (Value & Volume) 2024 & 2032
- Figure 87: Asia Pacific Taro Market Revenue (Million), by Price Trend Analysis 2024 & 2032
- Figure 88: Asia Pacific Taro Market Volume (Kiloton), by Price Trend Analysis 2024 & 2032
- Figure 89: Asia Pacific Taro Market Revenue Share (%), by Price Trend Analysis 2024 & 2032
- Figure 90: Asia Pacific Taro Market Volume Share (%), by Price Trend Analysis 2024 & 2032
- Figure 91: Asia Pacific Taro Market Revenue (Million), by Country 2024 & 2032
- Figure 92: Asia Pacific Taro Market Volume (Kiloton), by Country 2024 & 2032
- Figure 93: Asia Pacific Taro Market Revenue Share (%), by Country 2024 & 2032
- Figure 94: Asia Pacific Taro Market Volume Share (%), by Country 2024 & 2032
- Figure 95: South America Taro Market Revenue (Million), by Production Analysis 2024 & 2032
- Figure 96: South America Taro Market Volume (Kiloton), by Production Analysis 2024 & 2032
- Figure 97: South America Taro Market Revenue Share (%), by Production Analysis 2024 & 2032
- Figure 98: South America Taro Market Volume Share (%), by Production Analysis 2024 & 2032
- Figure 99: South America Taro Market Revenue (Million), by Consumption Analysis 2024 & 2032
- Figure 100: South America Taro Market Volume (Kiloton), by Consumption Analysis 2024 & 2032
- Figure 101: South America Taro Market Revenue Share (%), by Consumption Analysis 2024 & 2032
- Figure 102: South America Taro Market Volume Share (%), by Consumption Analysis 2024 & 2032
- Figure 103: South America Taro Market Revenue (Million), by Import Market Analysis (Value & Volume) 2024 & 2032
- Figure 104: South America Taro Market Volume (Kiloton), by Import Market Analysis (Value & Volume) 2024 & 2032
- Figure 105: South America Taro Market Revenue Share (%), by Import Market Analysis (Value & Volume) 2024 & 2032
- Figure 106: South America Taro Market Volume Share (%), by Import Market Analysis (Value & Volume) 2024 & 2032
- Figure 107: South America Taro Market Revenue (Million), by Export Market Analysis (Value & Volume) 2024 & 2032
- Figure 108: South America Taro Market Volume (Kiloton), by Export Market Analysis (Value & Volume) 2024 & 2032
- Figure 109: South America Taro Market Revenue Share (%), by Export Market Analysis (Value & Volume) 2024 & 2032
- Figure 110: South America Taro Market Volume Share (%), by Export Market Analysis (Value & Volume) 2024 & 2032
- Figure 111: South America Taro Market Revenue (Million), by Price Trend Analysis 2024 & 2032
- Figure 112: South America Taro Market Volume (Kiloton), by Price Trend Analysis 2024 & 2032
- Figure 113: South America Taro Market Revenue Share (%), by Price Trend Analysis 2024 & 2032
- Figure 114: South America Taro Market Volume Share (%), by Price Trend Analysis 2024 & 2032
- Figure 115: South America Taro Market Revenue (Million), by Country 2024 & 2032
- Figure 116: South America Taro Market Volume (Kiloton), by Country 2024 & 2032
- Figure 117: South America Taro Market Revenue Share (%), by Country 2024 & 2032
- Figure 118: South America Taro Market Volume Share (%), by Country 2024 & 2032
- Figure 119: Middle East And Africa Taro Market Revenue (Million), by Production Analysis 2024 & 2032
- Figure 120: Middle East And Africa Taro Market Volume (Kiloton), by Production Analysis 2024 & 2032
- Figure 121: Middle East And Africa Taro Market Revenue Share (%), by Production Analysis 2024 & 2032
- Figure 122: Middle East And Africa Taro Market Volume Share (%), by Production Analysis 2024 & 2032
- Figure 123: Middle East And Africa Taro Market Revenue (Million), by Consumption Analysis 2024 & 2032
- Figure 124: Middle East And Africa Taro Market Volume (Kiloton), by Consumption Analysis 2024 & 2032
- Figure 125: Middle East And Africa Taro Market Revenue Share (%), by Consumption Analysis 2024 & 2032
- Figure 126: Middle East And Africa Taro Market Volume Share (%), by Consumption Analysis 2024 & 2032
- Figure 127: Middle East And Africa Taro Market Revenue (Million), by Import Market Analysis (Value & Volume) 2024 & 2032
- Figure 128: Middle East And Africa Taro Market Volume (Kiloton), by Import Market Analysis (Value & Volume) 2024 & 2032
- Figure 129: Middle East And Africa Taro Market Revenue Share (%), by Import Market Analysis (Value & Volume) 2024 & 2032
- Figure 130: Middle East And Africa Taro Market Volume Share (%), by Import Market Analysis (Value & Volume) 2024 & 2032
- Figure 131: Middle East And Africa Taro Market Revenue (Million), by Export Market Analysis (Value & Volume) 2024 & 2032
- Figure 132: Middle East And Africa Taro Market Volume (Kiloton), by Export Market Analysis (Value & Volume) 2024 & 2032
- Figure 133: Middle East And Africa Taro Market Revenue Share (%), by Export Market Analysis (Value & Volume) 2024 & 2032
- Figure 134: Middle East And Africa Taro Market Volume Share (%), by Export Market Analysis (Value & Volume) 2024 & 2032
- Figure 135: Middle East And Africa Taro Market Revenue (Million), by Price Trend Analysis 2024 & 2032
- Figure 136: Middle East And Africa Taro Market Volume (Kiloton), by Price Trend Analysis 2024 & 2032
- Figure 137: Middle East And Africa Taro Market Revenue Share (%), by Price Trend Analysis 2024 & 2032
- Figure 138: Middle East And Africa Taro Market Volume Share (%), by Price Trend Analysis 2024 & 2032
- Figure 139: Middle East And Africa Taro Market Revenue (Million), by Country 2024 & 2032
- Figure 140: Middle East And Africa Taro Market Volume (Kiloton), by Country 2024 & 2032
- Figure 141: Middle East And Africa Taro Market Revenue Share (%), by Country 2024 & 2032
- Figure 142: Middle East And Africa Taro Market Volume Share (%), by Country 2024 & 2032
List of Tables
- Table 1: Global Taro Market Revenue Million Forecast, by Region 2019 & 2032
- Table 2: Global Taro Market Volume Kiloton Forecast, by Region 2019 & 2032
- Table 3: Global Taro Market Revenue Million Forecast, by Production Analysis 2019 & 2032
- Table 4: Global Taro Market Volume Kiloton Forecast, by Production Analysis 2019 & 2032
- Table 5: Global Taro Market Revenue Million Forecast, by Consumption Analysis 2019 & 2032
- Table 6: Global Taro Market Volume Kiloton Forecast, by Consumption Analysis 2019 & 2032
- Table 7: Global Taro Market Revenue Million Forecast, by Import Market Analysis (Value & Volume) 2019 & 2032
- Table 8: Global Taro Market Volume Kiloton Forecast, by Import Market Analysis (Value & Volume) 2019 & 2032
- Table 9: Global Taro Market Revenue Million Forecast, by Export Market Analysis (Value & Volume) 2019 & 2032
- Table 10: Global Taro Market Volume Kiloton Forecast, by Export Market Analysis (Value & Volume) 2019 & 2032
- Table 11: Global Taro Market Revenue Million Forecast, by Price Trend Analysis 2019 & 2032
- Table 12: Global Taro Market Volume Kiloton Forecast, by Price Trend Analysis 2019 & 2032
- Table 13: Global Taro Market Revenue Million Forecast, by Region 2019 & 2032
- Table 14: Global Taro Market Volume Kiloton Forecast, by Region 2019 & 2032
- Table 15: Global Taro Market Revenue Million Forecast, by Country 2019 & 2032
- Table 16: Global Taro Market Volume Kiloton Forecast, by Country 2019 & 2032
- Table 17: United States Taro Market Revenue (Million) Forecast, by Application 2019 & 2032
- Table 18: United States Taro Market Volume (Kiloton) Forecast, by Application 2019 & 2032
- Table 19: Canada Taro Market Revenue (Million) Forecast, by Application 2019 & 2032
- Table 20: Canada Taro Market Volume (Kiloton) Forecast, by Application 2019 & 2032
- Table 21: Mexico Taro Market Revenue (Million) Forecast, by Application 2019 & 2032
- Table 22: Mexico Taro Market Volume (Kiloton) Forecast, by Application 2019 & 2032
- Table 23: Global Taro Market Revenue Million Forecast, by Country 2019 & 2032
- Table 24: Global Taro Market Volume Kiloton Forecast, by Country 2019 & 2032
- Table 25: Germany Taro Market Revenue (Million) Forecast, by Application 2019 & 2032
- Table 26: Germany Taro Market Volume (Kiloton) Forecast, by Application 2019 & 2032
- Table 27: United Kingdom Taro Market Revenue (Million) Forecast, by Application 2019 & 2032
- Table 28: United Kingdom Taro Market Volume (Kiloton) Forecast, by Application 2019 & 2032
- Table 29: France Taro Market Revenue (Million) Forecast, by Application 2019 & 2032
- Table 30: France Taro Market Volume (Kiloton) Forecast, by Application 2019 & 2032
- Table 31: Spain Taro Market Revenue (Million) Forecast, by Application 2019 & 2032
- Table 32: Spain Taro Market Volume (Kiloton) Forecast, by Application 2019 & 2032
- Table 33: Italy Taro Market Revenue (Million) Forecast, by Application 2019 & 2032
- Table 34: Italy Taro Market Volume (Kiloton) Forecast, by Application 2019 & 2032
- Table 35: Spain Taro Market Revenue (Million) Forecast, by Application 2019 & 2032
- Table 36: Spain Taro Market Volume (Kiloton) Forecast, by Application 2019 & 2032
- Table 37: Belgium Taro Market Revenue (Million) Forecast, by Application 2019 & 2032
- Table 38: Belgium Taro Market Volume (Kiloton) Forecast, by Application 2019 & 2032
- Table 39: Netherland Taro Market Revenue (Million) Forecast, by Application 2019 & 2032
- Table 40: Netherland Taro Market Volume (Kiloton) Forecast, by Application 2019 & 2032
- Table 41: Nordics Taro Market Revenue (Million) Forecast, by Application 2019 & 2032
- Table 42: Nordics Taro Market Volume (Kiloton) Forecast, by Application 2019 & 2032
- Table 43: Rest of Europe Taro Market Revenue (Million) Forecast, by Application 2019 & 2032
- Table 44: Rest of Europe Taro Market Volume (Kiloton) Forecast, by Application 2019 & 2032
- Table 45: Global Taro Market Revenue Million Forecast, by Country 2019 & 2032
- Table 46: Global Taro Market Volume Kiloton Forecast, by Country 2019 & 2032
- Table 47: China Taro Market Revenue (Million) Forecast, by Application 2019 & 2032
- Table 48: China Taro Market Volume (Kiloton) Forecast, by Application 2019 & 2032
- Table 49: Japan Taro Market Revenue (Million) Forecast, by Application 2019 & 2032
- Table 50: Japan Taro Market Volume (Kiloton) Forecast, by Application 2019 & 2032
- Table 51: India Taro Market Revenue (Million) Forecast, by Application 2019 & 2032
- Table 52: India Taro Market Volume (Kiloton) Forecast, by Application 2019 & 2032
- Table 53: South Korea Taro Market Revenue (Million) Forecast, by Application 2019 & 2032
- Table 54: South Korea Taro Market Volume (Kiloton) Forecast, by Application 2019 & 2032
- Table 55: Southeast Asia Taro Market Revenue (Million) Forecast, by Application 2019 & 2032
- Table 56: Southeast Asia Taro Market Volume (Kiloton) Forecast, by Application 2019 & 2032
- Table 57: Australia Taro Market Revenue (Million) Forecast, by Application 2019 & 2032
- Table 58: Australia Taro Market Volume (Kiloton) Forecast, by Application 2019 & 2032
- Table 59: Indonesia Taro Market Revenue (Million) Forecast, by Application 2019 & 2032
- Table 60: Indonesia Taro Market Volume (Kiloton) Forecast, by Application 2019 & 2032
- Table 61: Phillipes Taro Market Revenue (Million) Forecast, by Application 2019 & 2032
- Table 62: Phillipes Taro Market Volume (Kiloton) Forecast, by Application 2019 & 2032
- Table 63: Singapore Taro Market Revenue (Million) Forecast, by Application 2019 & 2032
- Table 64: Singapore Taro Market Volume (Kiloton) Forecast, by Application 2019 & 2032
- Table 65: Thailandc Taro Market Revenue (Million) Forecast, by Application 2019 & 2032
- Table 66: Thailandc Taro Market Volume (Kiloton) Forecast, by Application 2019 & 2032
- Table 67: Rest of Asia Pacific Taro Market Revenue (Million) Forecast, by Application 2019 & 2032
- Table 68: Rest of Asia Pacific Taro Market Volume (Kiloton) Forecast, by Application 2019 & 2032
- Table 69: Global Taro Market Revenue Million Forecast, by Country 2019 & 2032
- Table 70: Global Taro Market Volume Kiloton Forecast, by Country 2019 & 2032
- Table 71: Brazil Taro Market Revenue (Million) Forecast, by Application 2019 & 2032
- Table 72: Brazil Taro Market Volume (Kiloton) Forecast, by Application 2019 & 2032
- Table 73: Argentina Taro Market Revenue (Million) Forecast, by Application 2019 & 2032
- Table 74: Argentina Taro Market Volume (Kiloton) Forecast, by Application 2019 & 2032
- Table 75: Peru Taro Market Revenue (Million) Forecast, by Application 2019 & 2032
- Table 76: Peru Taro Market Volume (Kiloton) Forecast, by Application 2019 & 2032
- Table 77: Chile Taro Market Revenue (Million) Forecast, by Application 2019 & 2032
- Table 78: Chile Taro Market Volume (Kiloton) Forecast, by Application 2019 & 2032
- Table 79: Colombia Taro Market Revenue (Million) Forecast, by Application 2019 & 2032
- Table 80: Colombia Taro Market Volume (Kiloton) Forecast, by Application 2019 & 2032
- Table 81: Ecuador Taro Market Revenue (Million) Forecast, by Application 2019 & 2032
- Table 82: Ecuador Taro Market Volume (Kiloton) Forecast, by Application 2019 & 2032
- Table 83: Venezuela Taro Market Revenue (Million) Forecast, by Application 2019 & 2032
- Table 84: Venezuela Taro Market Volume (Kiloton) Forecast, by Application 2019 & 2032
- Table 85: Rest of South America Taro Market Revenue (Million) Forecast, by Application 2019 & 2032
- Table 86: Rest of South America Taro Market Volume (Kiloton) Forecast, by Application 2019 & 2032
- Table 87: Global Taro Market Revenue Million Forecast, by Country 2019 & 2032
- Table 88: Global Taro Market Volume Kiloton Forecast, by Country 2019 & 2032
- Table 89: United Arab Emirates Taro Market Revenue (Million) Forecast, by Application 2019 & 2032
- Table 90: United Arab Emirates Taro Market Volume (Kiloton) Forecast, by Application 2019 & 2032
- Table 91: Saudi Arabia Taro Market Revenue (Million) Forecast, by Application 2019 & 2032
- Table 92: Saudi Arabia Taro Market Volume (Kiloton) Forecast, by Application 2019 & 2032
- Table 93: South Africa Taro Market Revenue (Million) Forecast, by Application 2019 & 2032
- Table 94: South Africa Taro Market Volume (Kiloton) Forecast, by Application 2019 & 2032
- Table 95: Rest of Middle East and Africa Taro Market Revenue (Million) Forecast, by Application 2019 & 2032
- Table 96: Rest of Middle East and Africa Taro Market Volume (Kiloton) Forecast, by Application 2019 & 2032
- Table 97: Global Taro Market Revenue Million Forecast, by Production Analysis 2019 & 2032
- Table 98: Global Taro Market Volume Kiloton Forecast, by Production Analysis 2019 & 2032
- Table 99: Global Taro Market Revenue Million Forecast, by Consumption Analysis 2019 & 2032
- Table 100: Global Taro Market Volume Kiloton Forecast, by Consumption Analysis 2019 & 2032
- Table 101: Global Taro Market Revenue Million Forecast, by Import Market Analysis (Value & Volume) 2019 & 2032
- Table 102: Global Taro Market Volume Kiloton Forecast, by Import Market Analysis (Value & Volume) 2019 & 2032
- Table 103: Global Taro Market Revenue Million Forecast, by Export Market Analysis (Value & Volume) 2019 & 2032
- Table 104: Global Taro Market Volume Kiloton Forecast, by Export Market Analysis (Value & Volume) 2019 & 2032
- Table 105: Global Taro Market Revenue Million Forecast, by Price Trend Analysis 2019 & 2032
- Table 106: Global Taro Market Volume Kiloton Forecast, by Price Trend Analysis 2019 & 2032
- Table 107: Global Taro Market Revenue Million Forecast, by Country 2019 & 2032
- Table 108: Global Taro Market Volume Kiloton Forecast, by Country 2019 & 2032
- Table 109: United States Taro Market Revenue (Million) Forecast, by Application 2019 & 2032
- Table 110: United States Taro Market Volume (Kiloton) Forecast, by Application 2019 & 2032
- Table 111: Global Taro Market Revenue Million Forecast, by Production Analysis 2019 & 2032
- Table 112: Global Taro Market Volume Kiloton Forecast, by Production Analysis 2019 & 2032
- Table 113: Global Taro Market Revenue Million Forecast, by Consumption Analysis 2019 & 2032
- Table 114: Global Taro Market Volume Kiloton Forecast, by Consumption Analysis 2019 & 2032
- Table 115: Global Taro Market Revenue Million Forecast, by Import Market Analysis (Value & Volume) 2019 & 2032
- Table 116: Global Taro Market Volume Kiloton Forecast, by Import Market Analysis (Value & Volume) 2019 & 2032
- Table 117: Global Taro Market Revenue Million Forecast, by Export Market Analysis (Value & Volume) 2019 & 2032
- Table 118: Global Taro Market Volume Kiloton Forecast, by Export Market Analysis (Value & Volume) 2019 & 2032
- Table 119: Global Taro Market Revenue Million Forecast, by Price Trend Analysis 2019 & 2032
- Table 120: Global Taro Market Volume Kiloton Forecast, by Price Trend Analysis 2019 & 2032
- Table 121: Global Taro Market Revenue Million Forecast, by Country 2019 & 2032
- Table 122: Global Taro Market Volume Kiloton Forecast, by Country 2019 & 2032
- Table 123: France Taro Market Revenue (Million) Forecast, by Application 2019 & 2032
- Table 124: France Taro Market Volume (Kiloton) Forecast, by Application 2019 & 2032
- Table 125: Global Taro Market Revenue Million Forecast, by Production Analysis 2019 & 2032
- Table 126: Global Taro Market Volume Kiloton Forecast, by Production Analysis 2019 & 2032
- Table 127: Global Taro Market Revenue Million Forecast, by Consumption Analysis 2019 & 2032
- Table 128: Global Taro Market Volume Kiloton Forecast, by Consumption Analysis 2019 & 2032
- Table 129: Global Taro Market Revenue Million Forecast, by Import Market Analysis (Value & Volume) 2019 & 2032
- Table 130: Global Taro Market Volume Kiloton Forecast, by Import Market Analysis (Value & Volume) 2019 & 2032
- Table 131: Global Taro Market Revenue Million Forecast, by Export Market Analysis (Value & Volume) 2019 & 2032
- Table 132: Global Taro Market Volume Kiloton Forecast, by Export Market Analysis (Value & Volume) 2019 & 2032
- Table 133: Global Taro Market Revenue Million Forecast, by Price Trend Analysis 2019 & 2032
- Table 134: Global Taro Market Volume Kiloton Forecast, by Price Trend Analysis 2019 & 2032
- Table 135: Global Taro Market Revenue Million Forecast, by Country 2019 & 2032
- Table 136: Global Taro Market Volume Kiloton Forecast, by Country 2019 & 2032
- Table 137: China Taro Market Revenue (Million) Forecast, by Application 2019 & 2032
- Table 138: China Taro Market Volume (Kiloton) Forecast, by Application 2019 & 2032
- Table 139: Global Taro Market Revenue Million Forecast, by Production Analysis 2019 & 2032
- Table 140: Global Taro Market Volume Kiloton Forecast, by Production Analysis 2019 & 2032
- Table 141: Global Taro Market Revenue Million Forecast, by Consumption Analysis 2019 & 2032
- Table 142: Global Taro Market Volume Kiloton Forecast, by Consumption Analysis 2019 & 2032
- Table 143: Global Taro Market Revenue Million Forecast, by Import Market Analysis (Value & Volume) 2019 & 2032
- Table 144: Global Taro Market Volume Kiloton Forecast, by Import Market Analysis (Value & Volume) 2019 & 2032
- Table 145: Global Taro Market Revenue Million Forecast, by Export Market Analysis (Value & Volume) 2019 & 2032
- Table 146: Global Taro Market Volume Kiloton Forecast, by Export Market Analysis (Value & Volume) 2019 & 2032
- Table 147: Global Taro Market Revenue Million Forecast, by Price Trend Analysis 2019 & 2032
- Table 148: Global Taro Market Volume Kiloton Forecast, by Price Trend Analysis 2019 & 2032
- Table 149: Global Taro Market Revenue Million Forecast, by Country 2019 & 2032
- Table 150: Global Taro Market Volume Kiloton Forecast, by Country 2019 & 2032
- Table 151: Brazil Taro Market Revenue (Million) Forecast, by Application 2019 & 2032
- Table 152: Brazil Taro Market Volume (Kiloton) Forecast, by Application 2019 & 2032
- Table 153: Global Taro Market Revenue Million Forecast, by Production Analysis 2019 & 2032
- Table 154: Global Taro Market Volume Kiloton Forecast, by Production Analysis 2019 & 2032
- Table 155: Global Taro Market Revenue Million Forecast, by Consumption Analysis 2019 & 2032
- Table 156: Global Taro Market Volume Kiloton Forecast, by Consumption Analysis 2019 & 2032
- Table 157: Global Taro Market Revenue Million Forecast, by Import Market Analysis (Value & Volume) 2019 & 2032
- Table 158: Global Taro Market Volume Kiloton Forecast, by Import Market Analysis (Value & Volume) 2019 & 2032
- Table 159: Global Taro Market Revenue Million Forecast, by Export Market Analysis (Value & Volume) 2019 & 2032
- Table 160: Global Taro Market Volume Kiloton Forecast, by Export Market Analysis (Value & Volume) 2019 & 2032
- Table 161: Global Taro Market Revenue Million Forecast, by Price Trend Analysis 2019 & 2032
- Table 162: Global Taro Market Volume Kiloton Forecast, by Price Trend Analysis 2019 & 2032
- Table 163: Global Taro Market Revenue Million Forecast, by Country 2019 & 2032
- Table 164: Global Taro Market Volume Kiloton Forecast, by Country 2019 & 2032
- Table 165: Turkey Taro Market Revenue (Million) Forecast, by Application 2019 & 2032
- Table 166: Turkey Taro Market Volume (Kiloton) Forecast, by Application 2019 & 2032
Frequently Asked Questions
1. What is the projected Compound Annual Growth Rate (CAGR) of the Taro Market?
The projected CAGR is approximately 3.50%.
2. Which companies are prominent players in the Taro Market?
Key companies in the market include Golden Ocean Corp. , Thai Union Group, Nutrifoods International, BobaBam , Taro Technologies Inc..
3. What are the main segments of the Taro Market?
The market segments include Production Analysis, Consumption Analysis, Import Market Analysis (Value & Volume), Export Market Analysis (Value & Volume), Price Trend Analysis.
4. Can you provide details about the market size?
The market size is estimated to be USD XXX Million as of 2022.
5. What are some drivers contributing to market growth?
; Awareness About Health Benefits Associated With Pecan Consumption; Wide Application of Pecan.
6. What are the notable trends driving market growth?
Strong Growth in Taro Production.
7. Are there any restraints impacting market growth?
; Volatility in the Prices; Adverse Weather Conditions Affecting Yield.
8. Can you provide examples of recent developments in the market?
January 2023: BobaBam launched new Milk Tea and Taro, which features two of the Los Angeles-based company's newest flavors which are among the best-selling flavors at boba shops around 200 club locations across the Northeast and West Coast. The new variety pack contains 14 packs (7 each of Milk Tea and Taro) and includes eco-friendly packaging.
9. What pricing options are available for accessing the report?
Pricing options include single-user, multi-user, and enterprise licenses priced at USD 4750, USD 5250, and USD 8750 respectively.
10. Is the market size provided in terms of value or volume?
The market size is provided in terms of value, measured in Million and volume, measured in Kiloton.
11. Are there any specific market keywords associated with the report?
Yes, the market keyword associated with the report is "Taro Market," which aids in identifying and referencing the specific market segment covered.
12. How do I determine which pricing option suits my needs best?
The pricing options vary based on user requirements and access needs. Individual users may opt for single-user licenses, while businesses requiring broader access may choose multi-user or enterprise licenses for cost-effective access to the report.
13. Are there any additional resources or data provided in the Taro Market report?
While the report offers comprehensive insights, it's advisable to review the specific contents or supplementary materials provided to ascertain if additional resources or data are available.
14. How can I stay updated on further developments or reports in the Taro Market?
To stay informed about further developments, trends, and reports in the Taro Market, consider subscribing to industry newsletters, following relevant companies and organizations, or regularly checking reputable industry news sources and publications.
Methodology
Step 1 - Identification of Relevant Samples Size from Population Database


Step 2 - Approaches for Defining Global Market Size (Value, Volume* & Price*)

Note*: In applicable scenarios
Step 3 - Data Sources
Primary Research
- Web Analytics
- Survey Reports
- Research Institute
- Latest Research Reports
- Opinion Leaders
Secondary Research
- Annual Reports
- White Paper
- Latest Press Release
- Industry Association
- Paid Database
- Investor Presentations

Step 4 - Data Triangulation
Involves using different sources of information in order to increase the validity of a study
These sources are likely to be stakeholders in a program - participants, other researchers, program staff, other community members, and so on.
Then we put all data in single framework & apply various statistical tools to find out the dynamic on the market.
During the analysis stage, feedback from the stakeholder groups would be compared to determine areas of agreement as well as areas of divergence


