


Key Insights
The teleradiology software market is experiencing robust growth, driven by the increasing demand for remote diagnostic imaging services, advancements in high-speed internet and cloud technologies, and a growing need to improve healthcare access in underserved areas. The market's expansion is fueled by the rising prevalence of chronic diseases requiring frequent imaging, the increasing adoption of telehealth initiatives globally, and the cost-effectiveness offered by teleradiology compared to traditional on-site radiology departments. Major players like McKesson, Siemens Healthineers, and Cerner are actively shaping market dynamics through strategic acquisitions, technological innovations, and partnerships, fostering competition and driving innovation in image analysis, reporting capabilities, and security features. The market is segmented by software type (PACS, RIS, specialized AI-powered tools), deployment model (cloud-based, on-premise), and end-user (hospitals, clinics, diagnostic centers). We project a healthy Compound Annual Growth Rate (CAGR) of 15% between 2025 and 2033, given these factors.
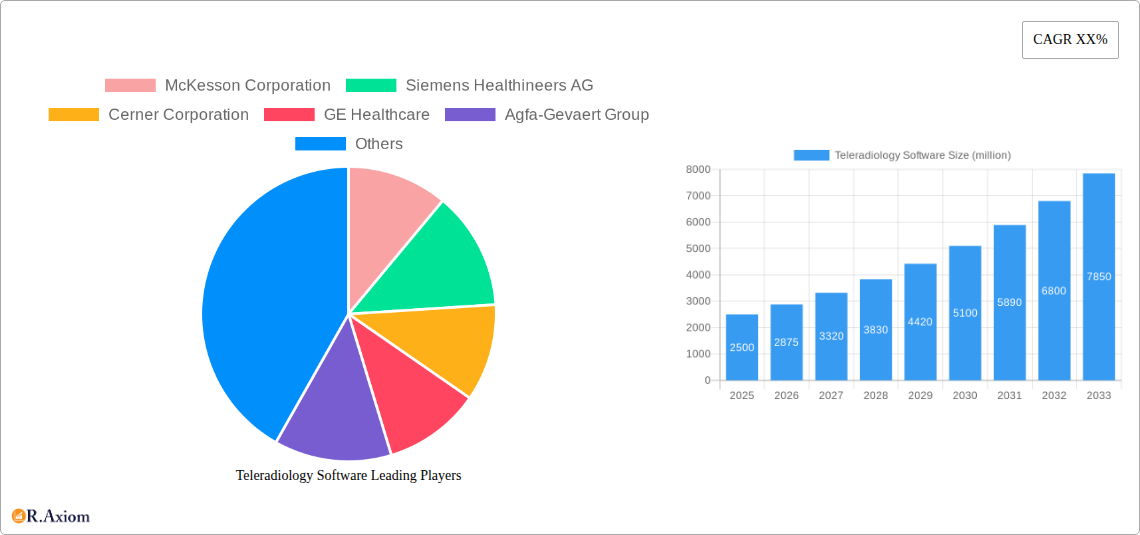
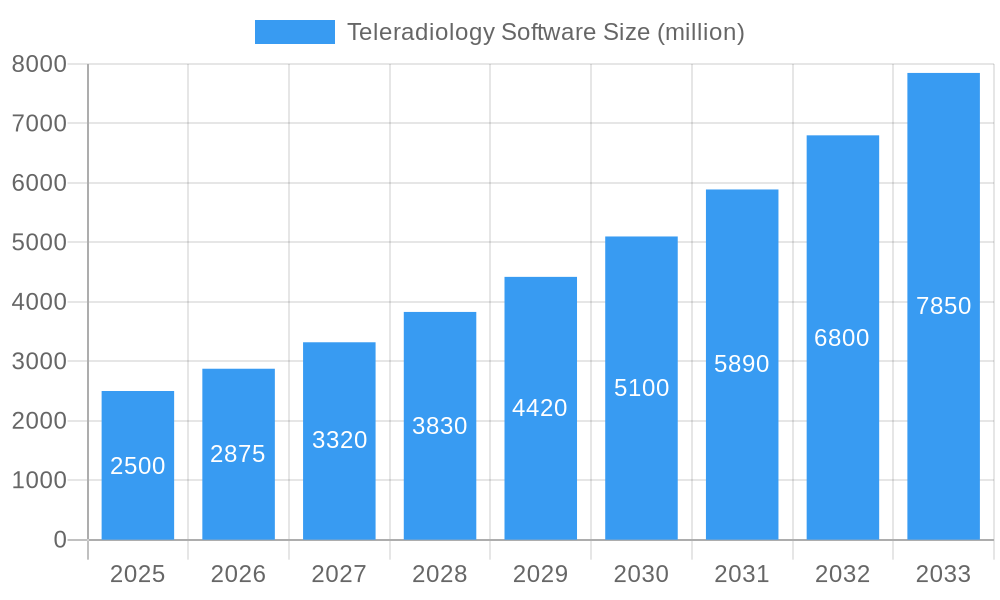
Teleradiology Software Market Size (In Billion)

However, challenges remain. High initial investment costs for implementing teleradiology systems and concerns regarding data security and regulatory compliance can impede wider adoption. Ensuring interoperability between different imaging systems and maintaining the quality of image interpretation across geographical locations also pose significant hurdles. Furthermore, the need for robust, reliable internet infrastructure, particularly in rural areas, presents a key limitation. Despite these restraints, the market's long-term prospects appear positive, especially as technology advancements overcome some of these obstacles and regulatory frameworks evolve to support the growing use of teleradiology. The increasing integration of artificial intelligence (AI) into teleradiology software, automating tasks and improving diagnostic accuracy, is a particularly significant trend that promises to fuel continued market expansion.
Teleradiology Software Company Market Share
This comprehensive report provides a detailed analysis of the global teleradiology software market from 2019 to 2033, offering invaluable insights for industry stakeholders, investors, and market entrants. The report covers market size, segmentation, growth drivers, challenges, opportunities, competitive landscape, and future outlook. The study period is 2019-2033, with 2025 as the base and estimated year. The forecast period is 2025-2033, and the historical period is 2019-2024. The market is valued at $xx million in 2025 and is projected to reach $xx million by 2033, exhibiting a CAGR of xx%.
Teleradiology Software Market Concentration & Innovation
The global teleradiology software market exhibits a moderately concentrated structure, with several major players holding significant market share. In 2025, the top five companies – McKesson Corporation, Siemens Healthineers AG, Cerner Corporation, GE Healthcare, and Agfa-Gevaert Group – collectively held an estimated xx% market share. This concentration is driven by significant investments in R&D, robust distribution networks, and established brand recognition. However, smaller, specialized companies are also contributing significantly through niche offerings and innovative solutions.
Innovation Drivers:
- Advancements in AI and machine learning for image analysis and diagnosis.
- Increased adoption of cloud-based platforms for enhanced accessibility and scalability.
- Development of mobile-friendly applications for remote image viewing and reporting.
- Integration with other healthcare IT systems for streamlined workflows.
Regulatory Frameworks: Stringent data privacy regulations (like HIPAA) and evolving standards for image exchange are shaping the market. Product substitutes, primarily traditional methods of film-based radiology, are gradually diminishing in prevalence. End-user trends are shifting toward increased demand for remote diagnostics, fueled by growing healthcare needs in underserved areas and the rising preference for convenient healthcare access.
M&A Activities: The market has witnessed several mergers and acquisitions (M&A) in recent years, with deal values totaling $xx million during the historical period. These transactions reflect the consolidation trend within the industry, aimed at expanding market reach, integrating technologies, and strengthening competitive positioning. For example, the acquisition of Company X by Company Y in 2022 resulted in a significant increase in market share for Company Y.
Teleradiology Software Industry Trends & Insights
The teleradiology software market is experiencing robust growth, driven by several key factors. The increasing prevalence of chronic diseases, the rising demand for efficient healthcare delivery, and the expansion of telehealth services are major contributors to market expansion. Technological advancements, such as AI-powered image analysis, are significantly enhancing the speed, accuracy, and efficiency of radiological interpretations.
The market penetration of teleradiology software is increasing steadily, particularly in developed regions with advanced healthcare infrastructure. Consumer preferences are shifting towards remote access to diagnostic services, seeking convenience and reduced wait times. However, competitive dynamics remain intense, with established players and emerging startups vying for market share through product innovation, strategic partnerships, and aggressive marketing strategies. The market is expected to maintain a healthy CAGR of xx% throughout the forecast period (2025-2033). The adoption of cloud-based solutions is expected to increase market penetration by xx% over the next five years.
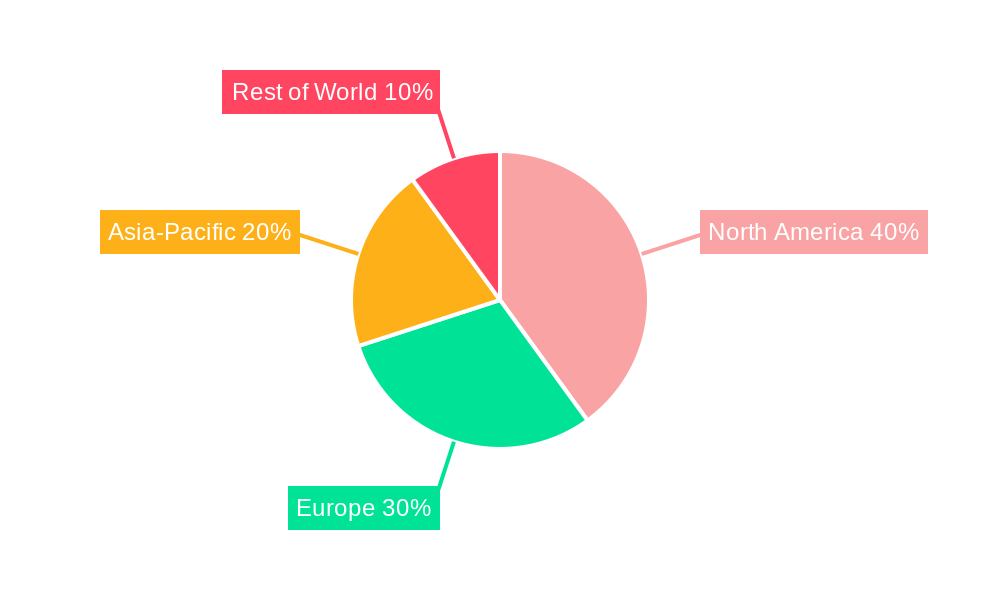
Dominant Markets & Segments in Teleradiology Software
The North American region currently dominates the global teleradiology software market, accounting for xx% of the total market value in 2025. This dominance is attributable to several factors:
- Advanced healthcare infrastructure: The presence of well-established healthcare systems and a high density of radiology practices contribute to high adoption rates.
- High technological adoption: North America's early adoption of telemedicine and robust IT infrastructure supports widespread teleradiology software implementation.
- Favorable regulatory environment: Supportive government policies and regulations encourage the adoption of telehealth services, including teleradiology.
- High per capita healthcare expenditure: Greater affordability of healthcare contributes to demand for advanced diagnostic technologies.
The market is further segmented by deployment (cloud-based, on-premise), specialty (general radiology, cardiology, etc.), and end-user (hospitals, clinics, diagnostic centers). The cloud-based segment is projected to exhibit the fastest growth due to its scalability, cost-effectiveness, and accessibility. The hospital segment is the largest end-user group, followed by diagnostic centers and clinics.
Teleradiology Software Product Developments
Recent product developments in teleradiology software focus on AI-powered image analysis, improved workflow automation, enhanced image quality, and integration with existing hospital information systems (HIS). Innovations include advanced algorithms for automated image interpretation, improved image compression techniques for faster transmission, and secure cloud-based platforms for data storage and access. These advancements enhance diagnostic accuracy, improve workflow efficiency, and ultimately reduce healthcare costs. The integration of PACS (Picture Archiving and Communication Systems) is paramount to successful implementation and market fit.
Report Scope & Segmentation Analysis
This report provides a comprehensive analysis of the global teleradiology software market, segmented by region (North America, Europe, Asia Pacific, Middle East & Africa, South America), deployment model (cloud-based, on-premise), end-user (hospitals, clinics, diagnostic imaging centers, independent radiology practices), modality (X-ray, CT, MRI, Ultrasound, etc.), and application (general radiology, cardiology, oncology, neurology, etc.). Each segment's market size, growth rate, and competitive dynamics are analyzed in detail, offering granular insights into market trends and opportunities. Growth projections for each segment are provided throughout the forecast period (2025-2033).
Key Drivers of Teleradiology Software Growth
Several factors are driving the growth of the teleradiology software market. Technological advancements, such as AI-powered image analysis and cloud-based platforms, are enhancing efficiency and accessibility. The rising prevalence of chronic diseases and the increasing demand for timely and accurate diagnoses are further boosting demand. Government initiatives promoting telehealth and remote healthcare are creating favorable regulatory environments, accelerating market growth. Finally, the cost-effectiveness of teleradiology compared to traditional methods is contributing to its wider adoption.
Challenges in the Teleradiology Software Sector
The teleradiology software market faces several challenges. High implementation costs and the need for robust IT infrastructure can hinder adoption, particularly in resource-constrained settings. Data security and privacy concerns, especially with the increased reliance on cloud-based solutions, require robust security measures. Furthermore, regulatory compliance and interoperability issues, along with potential reimbursement challenges, can create barriers to market growth. The shortage of qualified radiologists in certain regions also impacts the effective deployment of teleradiology solutions.
Emerging Opportunities in Teleradiology Software
Emerging opportunities lie in the integration of AI and machine learning for automated image analysis, expanding into underserved regions, and developing specialized solutions for niche applications. The adoption of 5G technology is expected to improve connectivity and enable higher-resolution image transmission, opening new avenues for growth. Furthermore, the growing demand for remote patient monitoring and the increasing adoption of wearables are creating synergistic opportunities for the integration of teleradiology into broader telehealth platforms.
Leading Players in the Teleradiology Software Market
- McKesson Corporation
- Siemens Healthineers AG
- Cerner Corporation
- GE Healthcare
- Agfa-Gevaert Group
- IBM Watson Health
- RamSoft
- Mednax Services
- Novarad Corporation
- Fujifilm Holdings Corporation
- ONRAD
- Everlight Radiology
- Nighthawk Radiology Services
- MILLENSYS
- Everrtech Teleradiology
- Telediagnosis Systems
- VRad (Virtual Radiologic)
- USARAD Holdings
- Teleradiology Solutions
- Carestream Health Inc
- Hexarad Ltd
- NucleusHealth
Key Developments in Teleradiology Software Industry
- 2022, Q4: McKesson Corporation launched a new AI-powered teleradiology platform.
- 2023, Q1: Siemens Healthineers AG acquired a smaller teleradiology software company.
- 2023, Q2: New FDA regulations impacting data security in teleradiology were implemented.
- 2024, Q3: A major industry conference focused on AI advancements in teleradiology was held. (Further specific examples of key developments with dates and impact can be added here)
Strategic Outlook for Teleradiology Software Market
The teleradiology software market is poised for substantial growth in the coming years. Continued technological advancements, increasing demand for remote healthcare services, and favorable regulatory environments will drive market expansion. Strategic partnerships, mergers and acquisitions, and the development of innovative solutions will further shape the competitive landscape. The market is expected to witness a significant influx of new players, leading to increased competition and a broader range of solutions available to healthcare providers. The focus on AI-driven solutions and integration with other healthcare IT systems will be crucial for future success in this dynamic market.
Teleradiology Software Segmentation
-
1. Application
- 1.1. Hospital
- 1.2. Clinic
- 1.3. Others
-
2. Types
- 2.1. Cloud-based
- 2.2. On-premises
Teleradiology Software Segmentation By Geography
-
1. North America
- 1.1. United States
- 1.2. Canada
- 1.3. Mexico
-
2. South America
- 2.1. Brazil
- 2.2. Argentina
- 2.3. Rest of South America
-
3. Europe
- 3.1. United Kingdom
- 3.2. Germany
- 3.3. France
- 3.4. Italy
- 3.5. Spain
- 3.6. Russia
- 3.7. Benelux
- 3.8. Nordics
- 3.9. Rest of Europe
-
4. Middle East & Africa
- 4.1. Turkey
- 4.2. Israel
- 4.3. GCC
- 4.4. North Africa
- 4.5. South Africa
- 4.6. Rest of Middle East & Africa
-
5. Asia Pacific
- 5.1. China
- 5.2. India
- 5.3. Japan
- 5.4. South Korea
- 5.5. ASEAN
- 5.6. Oceania
- 5.7. Rest of Asia Pacific
Teleradiology Software Regional Market Share
Geographic Coverage of Teleradiology Software
Teleradiology Software REPORT HIGHLIGHTS
| Aspects | Details |
|---|---|
| Study Period | 2020-2034 |
| Base Year | 2025 |
| Estimated Year | 2026 |
| Forecast Period | 2026-2034 |
| Historical Period | 2020-2025 |
| Growth Rate | CAGR of 11.94% from 2020-2034 |
| Segmentation |
|
Table of Contents
- 1. Introduction
- 1.1. Research Scope
- 1.2. Market Segmentation
- 1.3. Research Methodology
- 1.4. Definitions and Assumptions
- 2. Executive Summary
- 2.1. Introduction
- 3. Market Dynamics
- 3.1. Introduction
- 3.2. Market Drivers
- 3.3. Market Restrains
- 3.4. Market Trends
- 4. Market Factor Analysis
- 4.1. Porters Five Forces
- 4.2. Supply/Value Chain
- 4.3. PESTEL analysis
- 4.4. Market Entropy
- 4.5. Patent/Trademark Analysis
- 5. Global Teleradiology Software Analysis, Insights and Forecast, 2020-2032
- 5.1. Market Analysis, Insights and Forecast - by Application
- 5.1.1. Hospital
- 5.1.2. Clinic
- 5.1.3. Others
- 5.2. Market Analysis, Insights and Forecast - by Types
- 5.2.1. Cloud-based
- 5.2.2. On-premises
- 5.3. Market Analysis, Insights and Forecast - by Region
- 5.3.1. North America
- 5.3.2. South America
- 5.3.3. Europe
- 5.3.4. Middle East & Africa
- 5.3.5. Asia Pacific
- 5.1. Market Analysis, Insights and Forecast - by Application
- 6. North America Teleradiology Software Analysis, Insights and Forecast, 2020-2032
- 6.1. Market Analysis, Insights and Forecast - by Application
- 6.1.1. Hospital
- 6.1.2. Clinic
- 6.1.3. Others
- 6.2. Market Analysis, Insights and Forecast - by Types
- 6.2.1. Cloud-based
- 6.2.2. On-premises
- 6.1. Market Analysis, Insights and Forecast - by Application
- 7. South America Teleradiology Software Analysis, Insights and Forecast, 2020-2032
- 7.1. Market Analysis, Insights and Forecast - by Application
- 7.1.1. Hospital
- 7.1.2. Clinic
- 7.1.3. Others
- 7.2. Market Analysis, Insights and Forecast - by Types
- 7.2.1. Cloud-based
- 7.2.2. On-premises
- 7.1. Market Analysis, Insights and Forecast - by Application
- 8. Europe Teleradiology Software Analysis, Insights and Forecast, 2020-2032
- 8.1. Market Analysis, Insights and Forecast - by Application
- 8.1.1. Hospital
- 8.1.2. Clinic
- 8.1.3. Others
- 8.2. Market Analysis, Insights and Forecast - by Types
- 8.2.1. Cloud-based
- 8.2.2. On-premises
- 8.1. Market Analysis, Insights and Forecast - by Application
- 9. Middle East & Africa Teleradiology Software Analysis, Insights and Forecast, 2020-2032
- 9.1. Market Analysis, Insights and Forecast - by Application
- 9.1.1. Hospital
- 9.1.2. Clinic
- 9.1.3. Others
- 9.2. Market Analysis, Insights and Forecast - by Types
- 9.2.1. Cloud-based
- 9.2.2. On-premises
- 9.1. Market Analysis, Insights and Forecast - by Application
- 10. Asia Pacific Teleradiology Software Analysis, Insights and Forecast, 2020-2032
- 10.1. Market Analysis, Insights and Forecast - by Application
- 10.1.1. Hospital
- 10.1.2. Clinic
- 10.1.3. Others
- 10.2. Market Analysis, Insights and Forecast - by Types
- 10.2.1. Cloud-based
- 10.2.2. On-premises
- 10.1. Market Analysis, Insights and Forecast - by Application
- 11. Competitive Analysis
- 11.1. Global Market Share Analysis 2025
- 11.2. Company Profiles
- 11.2.1 McKesson Corporation
- 11.2.1.1. Overview
- 11.2.1.2. Products
- 11.2.1.3. SWOT Analysis
- 11.2.1.4. Recent Developments
- 11.2.1.5. Financials (Based on Availability)
- 11.2.2 Siemens Healthineers AG
- 11.2.2.1. Overview
- 11.2.2.2. Products
- 11.2.2.3. SWOT Analysis
- 11.2.2.4. Recent Developments
- 11.2.2.5. Financials (Based on Availability)
- 11.2.3 Cerner Corporation
- 11.2.3.1. Overview
- 11.2.3.2. Products
- 11.2.3.3. SWOT Analysis
- 11.2.3.4. Recent Developments
- 11.2.3.5. Financials (Based on Availability)
- 11.2.4 GE Healthcare
- 11.2.4.1. Overview
- 11.2.4.2. Products
- 11.2.4.3. SWOT Analysis
- 11.2.4.4. Recent Developments
- 11.2.4.5. Financials (Based on Availability)
- 11.2.5 Agfa-Gevaert Group
- 11.2.5.1. Overview
- 11.2.5.2. Products
- 11.2.5.3. SWOT Analysis
- 11.2.5.4. Recent Developments
- 11.2.5.5. Financials (Based on Availability)
- 11.2.6 IBM Watson Health
- 11.2.6.1. Overview
- 11.2.6.2. Products
- 11.2.6.3. SWOT Analysis
- 11.2.6.4. Recent Developments
- 11.2.6.5. Financials (Based on Availability)
- 11.2.7 RamSoft
- 11.2.7.1. Overview
- 11.2.7.2. Products
- 11.2.7.3. SWOT Analysis
- 11.2.7.4. Recent Developments
- 11.2.7.5. Financials (Based on Availability)
- 11.2.8 Mednax Services
- 11.2.8.1. Overview
- 11.2.8.2. Products
- 11.2.8.3. SWOT Analysis
- 11.2.8.4. Recent Developments
- 11.2.8.5. Financials (Based on Availability)
- 11.2.9 Novarad Corporation
- 11.2.9.1. Overview
- 11.2.9.2. Products
- 11.2.9.3. SWOT Analysis
- 11.2.9.4. Recent Developments
- 11.2.9.5. Financials (Based on Availability)
- 11.2.10 Fujifilm Holdings Corporation
- 11.2.10.1. Overview
- 11.2.10.2. Products
- 11.2.10.3. SWOT Analysis
- 11.2.10.4. Recent Developments
- 11.2.10.5. Financials (Based on Availability)
- 11.2.11 ONRAD
- 11.2.11.1. Overview
- 11.2.11.2. Products
- 11.2.11.3. SWOT Analysis
- 11.2.11.4. Recent Developments
- 11.2.11.5. Financials (Based on Availability)
- 11.2.12 Everlight Radiology
- 11.2.12.1. Overview
- 11.2.12.2. Products
- 11.2.12.3. SWOT Analysis
- 11.2.12.4. Recent Developments
- 11.2.12.5. Financials (Based on Availability)
- 11.2.13 Nighthawk Radiology Services
- 11.2.13.1. Overview
- 11.2.13.2. Products
- 11.2.13.3. SWOT Analysis
- 11.2.13.4. Recent Developments
- 11.2.13.5. Financials (Based on Availability)
- 11.2.14 MILLENSYS
- 11.2.14.1. Overview
- 11.2.14.2. Products
- 11.2.14.3. SWOT Analysis
- 11.2.14.4. Recent Developments
- 11.2.14.5. Financials (Based on Availability)
- 11.2.15 Everrtech Teleradiology
- 11.2.15.1. Overview
- 11.2.15.2. Products
- 11.2.15.3. SWOT Analysis
- 11.2.15.4. Recent Developments
- 11.2.15.5. Financials (Based on Availability)
- 11.2.16 Telediagnosis Systems
- 11.2.16.1. Overview
- 11.2.16.2. Products
- 11.2.16.3. SWOT Analysis
- 11.2.16.4. Recent Developments
- 11.2.16.5. Financials (Based on Availability)
- 11.2.17 VRad (Virtual Radiologic)
- 11.2.17.1. Overview
- 11.2.17.2. Products
- 11.2.17.3. SWOT Analysis
- 11.2.17.4. Recent Developments
- 11.2.17.5. Financials (Based on Availability)
- 11.2.18 USARAD Holdings
- 11.2.18.1. Overview
- 11.2.18.2. Products
- 11.2.18.3. SWOT Analysis
- 11.2.18.4. Recent Developments
- 11.2.18.5. Financials (Based on Availability)
- 11.2.19 Teleradiology Solutions
- 11.2.19.1. Overview
- 11.2.19.2. Products
- 11.2.19.3. SWOT Analysis
- 11.2.19.4. Recent Developments
- 11.2.19.5. Financials (Based on Availability)
- 11.2.20 Carestream Health Inc
- 11.2.20.1. Overview
- 11.2.20.2. Products
- 11.2.20.3. SWOT Analysis
- 11.2.20.4. Recent Developments
- 11.2.20.5. Financials (Based on Availability)
- 11.2.21 Hexarad Ltd
- 11.2.21.1. Overview
- 11.2.21.2. Products
- 11.2.21.3. SWOT Analysis
- 11.2.21.4. Recent Developments
- 11.2.21.5. Financials (Based on Availability)
- 11.2.22 NucleusHealth
- 11.2.22.1. Overview
- 11.2.22.2. Products
- 11.2.22.3. SWOT Analysis
- 11.2.22.4. Recent Developments
- 11.2.22.5. Financials (Based on Availability)
- 11.2.1 McKesson Corporation
List of Figures
- Figure 1: Global Teleradiology Software Revenue Breakdown (undefined, %) by Region 2025 & 2033
- Figure 2: North America Teleradiology Software Revenue (undefined), by Application 2025 & 2033
- Figure 3: North America Teleradiology Software Revenue Share (%), by Application 2025 & 2033
- Figure 4: North America Teleradiology Software Revenue (undefined), by Types 2025 & 2033
- Figure 5: North America Teleradiology Software Revenue Share (%), by Types 2025 & 2033
- Figure 6: North America Teleradiology Software Revenue (undefined), by Country 2025 & 2033
- Figure 7: North America Teleradiology Software Revenue Share (%), by Country 2025 & 2033
- Figure 8: South America Teleradiology Software Revenue (undefined), by Application 2025 & 2033
- Figure 9: South America Teleradiology Software Revenue Share (%), by Application 2025 & 2033
- Figure 10: South America Teleradiology Software Revenue (undefined), by Types 2025 & 2033
- Figure 11: South America Teleradiology Software Revenue Share (%), by Types 2025 & 2033
- Figure 12: South America Teleradiology Software Revenue (undefined), by Country 2025 & 2033
- Figure 13: South America Teleradiology Software Revenue Share (%), by Country 2025 & 2033
- Figure 14: Europe Teleradiology Software Revenue (undefined), by Application 2025 & 2033
- Figure 15: Europe Teleradiology Software Revenue Share (%), by Application 2025 & 2033
- Figure 16: Europe Teleradiology Software Revenue (undefined), by Types 2025 & 2033
- Figure 17: Europe Teleradiology Software Revenue Share (%), by Types 2025 & 2033
- Figure 18: Europe Teleradiology Software Revenue (undefined), by Country 2025 & 2033
- Figure 19: Europe Teleradiology Software Revenue Share (%), by Country 2025 & 2033
- Figure 20: Middle East & Africa Teleradiology Software Revenue (undefined), by Application 2025 & 2033
- Figure 21: Middle East & Africa Teleradiology Software Revenue Share (%), by Application 2025 & 2033
- Figure 22: Middle East & Africa Teleradiology Software Revenue (undefined), by Types 2025 & 2033
- Figure 23: Middle East & Africa Teleradiology Software Revenue Share (%), by Types 2025 & 2033
- Figure 24: Middle East & Africa Teleradiology Software Revenue (undefined), by Country 2025 & 2033
- Figure 25: Middle East & Africa Teleradiology Software Revenue Share (%), by Country 2025 & 2033
- Figure 26: Asia Pacific Teleradiology Software Revenue (undefined), by Application 2025 & 2033
- Figure 27: Asia Pacific Teleradiology Software Revenue Share (%), by Application 2025 & 2033
- Figure 28: Asia Pacific Teleradiology Software Revenue (undefined), by Types 2025 & 2033
- Figure 29: Asia Pacific Teleradiology Software Revenue Share (%), by Types 2025 & 2033
- Figure 30: Asia Pacific Teleradiology Software Revenue (undefined), by Country 2025 & 2033
- Figure 31: Asia Pacific Teleradiology Software Revenue Share (%), by Country 2025 & 2033
List of Tables
- Table 1: Global Teleradiology Software Revenue undefined Forecast, by Application 2020 & 2033
- Table 2: Global Teleradiology Software Revenue undefined Forecast, by Types 2020 & 2033
- Table 3: Global Teleradiology Software Revenue undefined Forecast, by Region 2020 & 2033
- Table 4: Global Teleradiology Software Revenue undefined Forecast, by Application 2020 & 2033
- Table 5: Global Teleradiology Software Revenue undefined Forecast, by Types 2020 & 2033
- Table 6: Global Teleradiology Software Revenue undefined Forecast, by Country 2020 & 2033
- Table 7: United States Teleradiology Software Revenue (undefined) Forecast, by Application 2020 & 2033
- Table 8: Canada Teleradiology Software Revenue (undefined) Forecast, by Application 2020 & 2033
- Table 9: Mexico Teleradiology Software Revenue (undefined) Forecast, by Application 2020 & 2033
- Table 10: Global Teleradiology Software Revenue undefined Forecast, by Application 2020 & 2033
- Table 11: Global Teleradiology Software Revenue undefined Forecast, by Types 2020 & 2033
- Table 12: Global Teleradiology Software Revenue undefined Forecast, by Country 2020 & 2033
- Table 13: Brazil Teleradiology Software Revenue (undefined) Forecast, by Application 2020 & 2033
- Table 14: Argentina Teleradiology Software Revenue (undefined) Forecast, by Application 2020 & 2033
- Table 15: Rest of South America Teleradiology Software Revenue (undefined) Forecast, by Application 2020 & 2033
- Table 16: Global Teleradiology Software Revenue undefined Forecast, by Application 2020 & 2033
- Table 17: Global Teleradiology Software Revenue undefined Forecast, by Types 2020 & 2033
- Table 18: Global Teleradiology Software Revenue undefined Forecast, by Country 2020 & 2033
- Table 19: United Kingdom Teleradiology Software Revenue (undefined) Forecast, by Application 2020 & 2033
- Table 20: Germany Teleradiology Software Revenue (undefined) Forecast, by Application 2020 & 2033
- Table 21: France Teleradiology Software Revenue (undefined) Forecast, by Application 2020 & 2033
- Table 22: Italy Teleradiology Software Revenue (undefined) Forecast, by Application 2020 & 2033
- Table 23: Spain Teleradiology Software Revenue (undefined) Forecast, by Application 2020 & 2033
- Table 24: Russia Teleradiology Software Revenue (undefined) Forecast, by Application 2020 & 2033
- Table 25: Benelux Teleradiology Software Revenue (undefined) Forecast, by Application 2020 & 2033
- Table 26: Nordics Teleradiology Software Revenue (undefined) Forecast, by Application 2020 & 2033
- Table 27: Rest of Europe Teleradiology Software Revenue (undefined) Forecast, by Application 2020 & 2033
- Table 28: Global Teleradiology Software Revenue undefined Forecast, by Application 2020 & 2033
- Table 29: Global Teleradiology Software Revenue undefined Forecast, by Types 2020 & 2033
- Table 30: Global Teleradiology Software Revenue undefined Forecast, by Country 2020 & 2033
- Table 31: Turkey Teleradiology Software Revenue (undefined) Forecast, by Application 2020 & 2033
- Table 32: Israel Teleradiology Software Revenue (undefined) Forecast, by Application 2020 & 2033
- Table 33: GCC Teleradiology Software Revenue (undefined) Forecast, by Application 2020 & 2033
- Table 34: North Africa Teleradiology Software Revenue (undefined) Forecast, by Application 2020 & 2033
- Table 35: South Africa Teleradiology Software Revenue (undefined) Forecast, by Application 2020 & 2033
- Table 36: Rest of Middle East & Africa Teleradiology Software Revenue (undefined) Forecast, by Application 2020 & 2033
- Table 37: Global Teleradiology Software Revenue undefined Forecast, by Application 2020 & 2033
- Table 38: Global Teleradiology Software Revenue undefined Forecast, by Types 2020 & 2033
- Table 39: Global Teleradiology Software Revenue undefined Forecast, by Country 2020 & 2033
- Table 40: China Teleradiology Software Revenue (undefined) Forecast, by Application 2020 & 2033
- Table 41: India Teleradiology Software Revenue (undefined) Forecast, by Application 2020 & 2033
- Table 42: Japan Teleradiology Software Revenue (undefined) Forecast, by Application 2020 & 2033
- Table 43: South Korea Teleradiology Software Revenue (undefined) Forecast, by Application 2020 & 2033
- Table 44: ASEAN Teleradiology Software Revenue (undefined) Forecast, by Application 2020 & 2033
- Table 45: Oceania Teleradiology Software Revenue (undefined) Forecast, by Application 2020 & 2033
- Table 46: Rest of Asia Pacific Teleradiology Software Revenue (undefined) Forecast, by Application 2020 & 2033
Frequently Asked Questions
1. What is the projected Compound Annual Growth Rate (CAGR) of the Teleradiology Software?
The projected CAGR is approximately 11.94%.
2. Which companies are prominent players in the Teleradiology Software?
Key companies in the market include McKesson Corporation, Siemens Healthineers AG, Cerner Corporation, GE Healthcare, Agfa-Gevaert Group, IBM Watson Health, RamSoft, Mednax Services, Novarad Corporation, Fujifilm Holdings Corporation, ONRAD, Everlight Radiology, Nighthawk Radiology Services, MILLENSYS, Everrtech Teleradiology, Telediagnosis Systems, VRad (Virtual Radiologic), USARAD Holdings, Teleradiology Solutions, Carestream Health Inc, Hexarad Ltd, NucleusHealth.
3. What are the main segments of the Teleradiology Software?
The market segments include Application, Types.
4. Can you provide details about the market size?
The market size is estimated to be USD XXX N/A as of 2022.
5. What are some drivers contributing to market growth?
N/A
6. What are the notable trends driving market growth?
N/A
7. Are there any restraints impacting market growth?
N/A
8. Can you provide examples of recent developments in the market?
N/A
9. What pricing options are available for accessing the report?
Pricing options include single-user, multi-user, and enterprise licenses priced at USD 3350.00, USD 5025.00, and USD 6700.00 respectively.
10. Is the market size provided in terms of value or volume?
The market size is provided in terms of value, measured in N/A.
11. Are there any specific market keywords associated with the report?
Yes, the market keyword associated with the report is "Teleradiology Software," which aids in identifying and referencing the specific market segment covered.
12. How do I determine which pricing option suits my needs best?
The pricing options vary based on user requirements and access needs. Individual users may opt for single-user licenses, while businesses requiring broader access may choose multi-user or enterprise licenses for cost-effective access to the report.
13. Are there any additional resources or data provided in the Teleradiology Software report?
While the report offers comprehensive insights, it's advisable to review the specific contents or supplementary materials provided to ascertain if additional resources or data are available.
14. How can I stay updated on further developments or reports in the Teleradiology Software?
To stay informed about further developments, trends, and reports in the Teleradiology Software, consider subscribing to industry newsletters, following relevant companies and organizations, or regularly checking reputable industry news sources and publications.
Methodology
Step 1 - Identification of Relevant Samples Size from Population Database


Step 2 - Approaches for Defining Global Market Size (Value, Volume* & Price*)

Note*: In applicable scenarios
Step 3 - Data Sources
Primary Research
- Web Analytics
- Survey Reports
- Research Institute
- Latest Research Reports
- Opinion Leaders
Secondary Research
- Annual Reports
- White Paper
- Latest Press Release
- Industry Association
- Paid Database
- Investor Presentations

Step 4 - Data Triangulation
Involves using different sources of information in order to increase the validity of a study
These sources are likely to be stakeholders in a program - participants, other researchers, program staff, other community members, and so on.
Then we put all data in single framework & apply various statistical tools to find out the dynamic on the market.
During the analysis stage, feedback from the stakeholder groups would be compared to determine areas of agreement as well as areas of divergence