

Key Insights
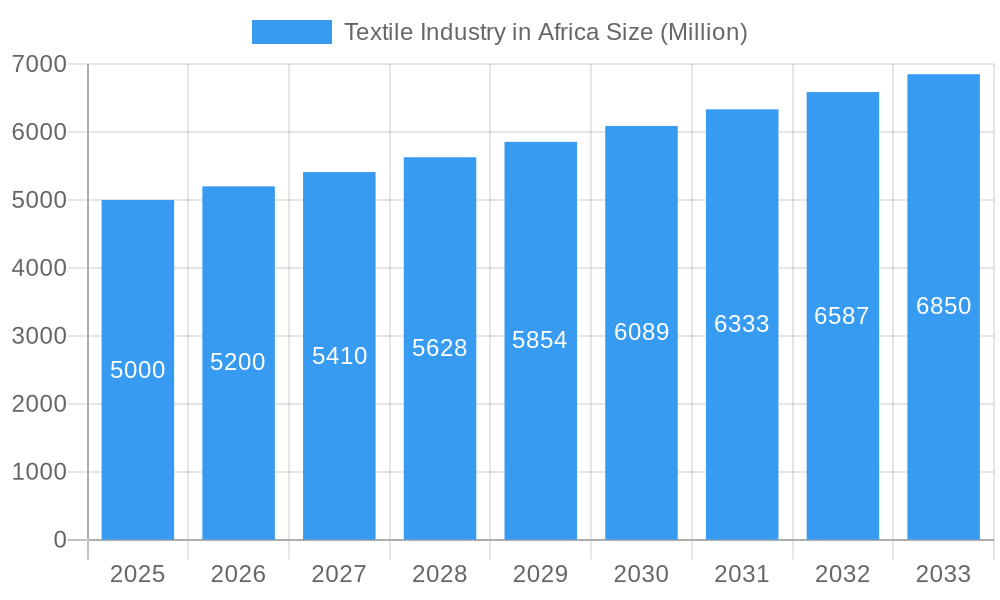
The African textile market, estimated at $39.21 billion in the base year 2025, is poised for significant expansion. The industry is projected to grow at a Compound Annual Growth Rate (CAGR) of approximately 4.73% through 2033. This robust growth is underpinned by several key drivers. Increasing disposable incomes across the continent are spurring higher demand for apparel and home textiles. A growing population and accelerating urbanization are expanding consumer bases. The adoption of advanced manufacturing technologies, enhancing weaving and non-woven processes, is improving efficiency and product quality. Government support for domestic production and import substitution further bolsters the sector's positive trajectory. However, challenges such as competition from low-cost imports, infrastructure deficits (especially in power and logistics), and the need for workforce upskilling persist. The market is segmented by material (cotton, jute, silk, synthetics, wool), process (woven, non-woven), and end-use (apparel, industrial/technical, household). Leading companies like Mediterranean Textile Company S.A.E., Saygin-Dima Textile Sc, and CIEL Textile Ltd are at the forefront of innovation and market leadership, alongside numerous specialized local enterprises. Key regional markets include South Africa, Kenya, and Uganda.
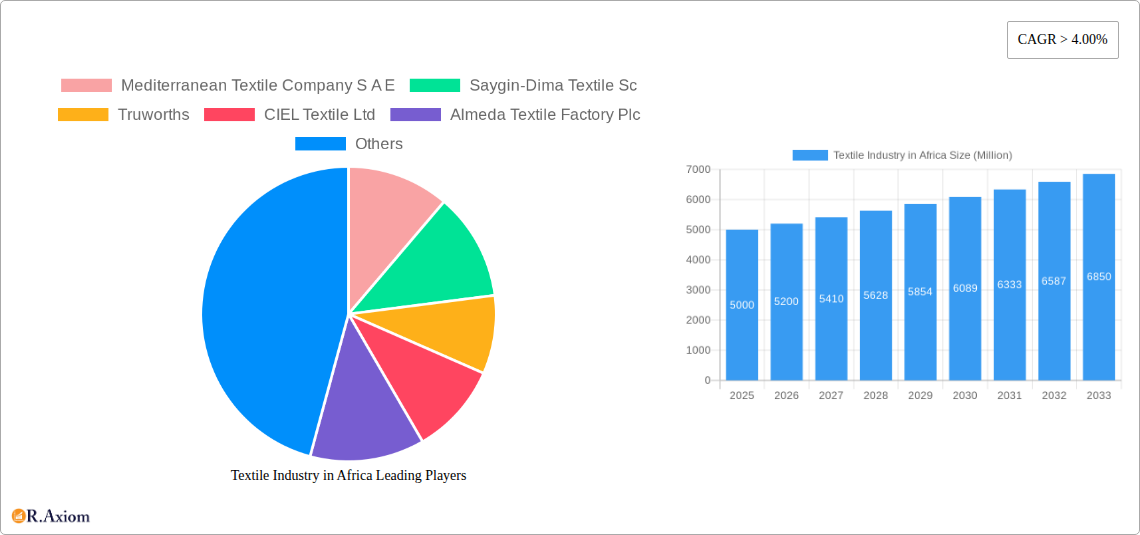
Textile Industry in Africa Market Size (In Billion)
The African textile sector offers considerable investment and business opportunities. Strategic investments in infrastructure, technology, and talent development are vital for unlocking the industry's full potential. The increasing consumer preference for sustainable and ethically produced textiles represents a growing niche market. Sustained growth is expected, contingent on effectively addressing current challenges to achieve the sector's complete potential. Collaborative efforts involving government policy, private capital, and value chain partnerships will be essential for ensuring long-term, sustainable development.
Textile Industry in Africa Company Market Share
Textile Industry in Africa: A Comprehensive Market Report (2019-2033)
This in-depth report provides a comprehensive analysis of the African textile industry, covering market dynamics, growth drivers, challenges, and opportunities from 2019 to 2033. With a base year of 2025 and a forecast period of 2025-2033, this report is an essential resource for industry stakeholders, investors, and policymakers seeking to understand and navigate this dynamic sector. The report leverages extensive data analysis and expert insights to offer actionable intelligence on key segments, leading players, and emerging trends. The total market size is projected to reach xx Million by 2033.
Textile Industry in Africa Market Concentration & Innovation
The African textile industry exhibits a moderately concentrated market structure, with a few large players holding significant market share. However, the landscape is increasingly fragmented with the rise of smaller, specialized firms. Market concentration is highest in the clothing segment, particularly within the ready-to-wear sector. Innovation is driven by several factors, including the increasing demand for sustainable and ethically produced textiles, the adoption of advanced technologies in manufacturing, and the need to cater to evolving consumer preferences. The regulatory framework varies significantly across African nations, impacting market access and operations. Product substitutes, such as synthetic materials, pose a competitive challenge, particularly for natural fiber producers. Mergers and acquisitions (M&A) activity is steadily increasing as companies seek to expand their market reach and enhance their production capabilities. Recent M&A deals in the sector have been valued at approximately xx Million.
- Key Metrics:
- Market share of top 5 players: xx%
- Average M&A deal value (2019-2024): xx Million
- Number of M&A deals (2019-2024): xx
Textile Industry in Africa Industry Trends & Insights
The African textile industry is experiencing significant transformation, driven by several key factors. Growth is fueled by increasing domestic consumption, particularly in rapidly growing urban populations, coupled with rising disposable incomes. Technological advancements, such as automation and improved machinery, are increasing efficiency and productivity. Consumer preferences are shifting towards higher quality, more sustainable, and ethically sourced textiles, presenting opportunities for brands that emphasize these aspects. Competitive dynamics are characterized by both local and international players vying for market share, resulting in price competition and innovation in product offerings. The Compound Annual Growth Rate (CAGR) for the period 2019-2024 is estimated at xx%, with market penetration expected to reach xx% by 2033. Challenges persist, however, including infrastructure limitations, fluctuating raw material prices, and a lack of skilled labor in certain regions.
Dominant Markets & Segments in Textile Industry in Africa
The dominance within the African textile industry varies across segments and geographic locations. Cotton remains the most prevalent material type, primarily concentrated in countries like Egypt, Sudan, and Tanzania. Clothing applications represent the largest segment, driven by strong population growth and rising apparel consumption. Within processing, woven fabrics dominate over non-woven, reflecting traditional manufacturing practices.
Key Drivers:
- Cotton: Favorable climatic conditions, established cultivation practices.
- Clothing: Growing population, rising middle class, increased fashion consciousness.
- Woven fabrics: Established manufacturing infrastructure, preference for traditional fabrics.
Dominant Regions/Countries: Egypt, Nigeria, Ethiopia, and Kenya are key players due to factors like favorable climatic conditions, government support, and substantial consumer markets.
Textile Industry in Africa Product Developments
Recent product developments focus on incorporating sustainable and eco-friendly materials, such as recycled cotton and organic fibers. Technological advancements have led to the introduction of innovative fabrics with enhanced properties like moisture-wicking, antimicrobial, and wrinkle-resistant qualities. These new materials and functionalities are catering to the growing demand for high-performance apparel and technical textiles.
Report Scope & Segmentation Analysis
This report segments the African textile market across various dimensions, including:
Material Type: Cotton, Jute, Silk, Synthetics, Wool – each segment shows varied growth projections based on factors like raw material availability and price fluctuations. Cotton and synthetic fabrics show the highest growth.
Process: Woven, Non-woven – The woven segment dominates due to established infrastructure. However, non-woven is gaining traction due to its cost-effectiveness in certain applications.
Application: Clothing, Industrial/Technical Applications, Household Applications – Clothing dominates, followed by industrial applications, with household applications showing steady growth.
Key Drivers of Textile Industry in Africa Growth
Several factors fuel the growth of the African textile industry. These include increasing government support through initiatives promoting local textile production, the rise of a burgeoning middle class with increased purchasing power, and improved infrastructure in certain regions facilitating trade and logistics. Technological advancements are enhancing productivity and creating new product possibilities.
Challenges in the Textile Industry in Africa Sector
The African textile industry faces several challenges, including infrastructure limitations, especially unreliable power supply and transportation networks, which increase production costs and limit efficiency. Competition from cheaper imports and the lack of skilled labor in some areas also pose significant hurdles. Regulatory inconsistencies across different countries can create trade barriers.
Emerging Opportunities in Textile Industry in Africa
Significant opportunities exist in the African textile industry, particularly in the burgeoning e-commerce sector providing access to larger markets. The growth of the tourism and hospitality sectors drive demand for textiles used in hotels and resorts. Technological innovations, such as 3D printing, offer new avenues for product development and customization. Growing emphasis on sustainable and ethical production opens opportunities for companies committed to eco-friendly practices.
Leading Players in the Textile Industry in Africa Market
- Mediterranean Textile Company S A E
- Saygin-Dima Textile Sc
- Truworths
- CIEL Textile Ltd
- Almeda Textile Factory Plc
- Woolworths
- Edcon
- Gelvenor Textiles
Key Developments in Textile Industry in Africa Industry
- Feb 2021: Truworths launches Primark, a value fashion chain targeting lower-income consumers, signifying a shift towards affordable apparel segments. The anticipated impact is increased competition in the budget clothing market.
Strategic Outlook for Textile Industry in Africa Market
The African textile industry holds considerable long-term potential, driven by the continent's young and growing population, rising disposable incomes, and increasing government support for local manufacturing. Addressing infrastructure deficiencies and fostering a skilled workforce will be crucial for realizing this potential. Companies that embrace sustainable practices, invest in technology, and cater to evolving consumer preferences are best positioned for success.
Textile Industry in Africa Segmentation
-
1. Application
- 1.1. Clothing
- 1.2. Industrial/Technical Applications
- 1.3. Household Applications
-
2. Material Type
- 2.1. Cotton
- 2.2. Jute
- 2.3. Silk
- 2.4. Synthetics
- 2.5. Wool
-
3. Process
- 3.1. Woven
- 3.2. Non-woven
Textile Industry in Africa Segmentation By Geography
-
1. North America
- 1.1. United States
- 1.2. Canada
- 1.3. Mexico
-
2. South America
- 2.1. Brazil
- 2.2. Argentina
- 2.3. Rest of South America
-
3. Europe
- 3.1. United Kingdom
- 3.2. Germany
- 3.3. France
- 3.4. Italy
- 3.5. Spain
- 3.6. Russia
- 3.7. Benelux
- 3.8. Nordics
- 3.9. Rest of Europe
-
4. Middle East & Africa
- 4.1. Turkey
- 4.2. Israel
- 4.3. GCC
- 4.4. North Africa
- 4.5. South Africa
- 4.6. Rest of Middle East & Africa
-
5. Asia Pacific
- 5.1. China
- 5.2. India
- 5.3. Japan
- 5.4. South Korea
- 5.5. ASEAN
- 5.6. Oceania
- 5.7. Rest of Asia Pacific
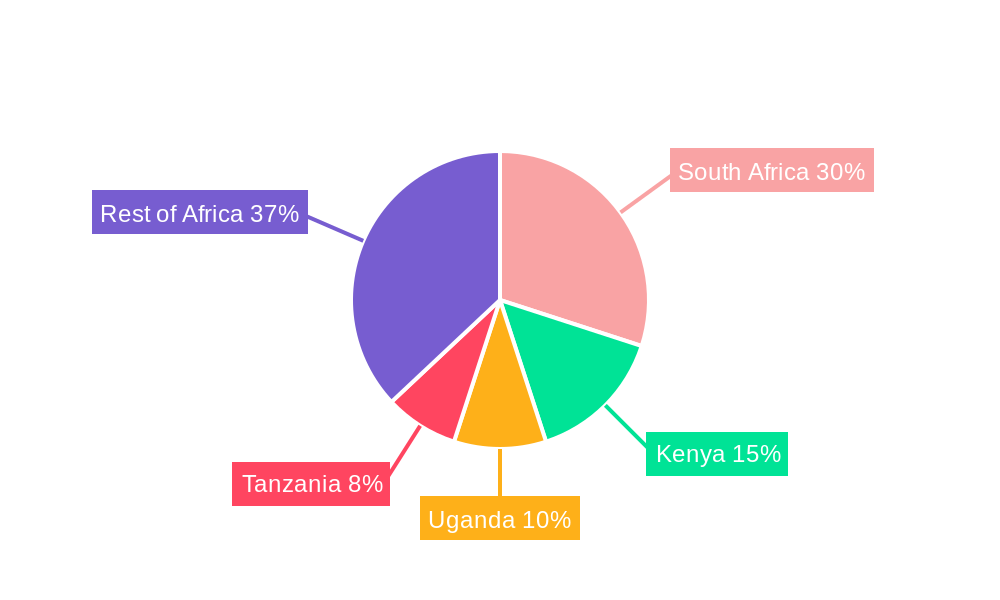
Textile Industry in Africa Regional Market Share
Geographic Coverage of Textile Industry in Africa
Textile Industry in Africa REPORT HIGHLIGHTS
| Aspects | Details |
|---|---|
| Study Period | 2020-2034 |
| Base Year | 2025 |
| Estimated Year | 2026 |
| Forecast Period | 2026-2034 |
| Historical Period | 2020-2025 |
| Growth Rate | CAGR of 4.73% from 2020-2034 |
| Segmentation |
|
Table of Contents
- 1. Introduction
- 1.1. Research Scope
- 1.2. Market Segmentation
- 1.3. Research Objective
- 1.4. Definitions and Assumptions
- 2. Executive Summary
- 2.1. Market Snapshot
- 3. Market Dynamics
- 3.1. Market Drivers
- 3.2. Market Restrains
- 3.3. Market Trends
- 3.4. Market Opportunities
- 4. Market Factor Analysis
- 4.1. Porters Five Forces
- 4.1.1. Bargaining Power of Suppliers
- 4.1.2. Bargaining Power of Buyers
- 4.1.3. Threat of New Entrants
- 4.1.4. Threat of Substitutes
- 4.1.5. Competitive Rivalry
- 4.2. PESTEL analysis
- 4.3. BCG Analysis
- 4.3.1. Stars (High Growth, High Market Share)
- 4.3.2. Cash Cows (Low Growth, High Market Share)
- 4.3.3. Question Mark (High Growth, Low Market Share)
- 4.3.4. Dogs (Low Growth, Low Market Share)
- 4.4. Ansoff Matrix Analysis
- 4.5. Supply Chain Analysis
- 4.6. Regulatory Landscape
- 4.7. Current Market Potential and Opportunity Assessment (TAM–SAM–SOM Framework)
- 4.8. RAX Analyst Note
- 4.1. Porters Five Forces
- 5. Market Analysis, Insights and Forecast 2021-2033
- 5.1. Market Analysis, Insights and Forecast - by Application
- 5.1.1. Clothing
- 5.1.2. Industrial/Technical Applications
- 5.1.3. Household Applications
- 5.2. Market Analysis, Insights and Forecast - by Material Type
- 5.2.1. Cotton
- 5.2.2. Jute
- 5.2.3. Silk
- 5.2.4. Synthetics
- 5.2.5. Wool
- 5.3. Market Analysis, Insights and Forecast - by Process
- 5.3.1. Woven
- 5.3.2. Non-woven
- 5.4. Market Analysis, Insights and Forecast - by Region
- 5.4.1. North America
- 5.4.2. South America
- 5.4.3. Europe
- 5.4.4. Middle East & Africa
- 5.4.5. Asia Pacific
- 5.1. Market Analysis, Insights and Forecast - by Application
- 6. Global Textile Industry in Africa Analysis, Insights and Forecast, 2021-2033
- 6.1. Market Analysis, Insights and Forecast - by Application
- 6.1.1. Clothing
- 6.1.2. Industrial/Technical Applications
- 6.1.3. Household Applications
- 6.2. Market Analysis, Insights and Forecast - by Material Type
- 6.2.1. Cotton
- 6.2.2. Jute
- 6.2.3. Silk
- 6.2.4. Synthetics
- 6.2.5. Wool
- 6.3. Market Analysis, Insights and Forecast - by Process
- 6.3.1. Woven
- 6.3.2. Non-woven
- 6.1. Market Analysis, Insights and Forecast - by Application
- 7. North America Textile Industry in Africa Analysis, Insights and Forecast, 2020-2032
- 7.1. Market Analysis, Insights and Forecast - by Application
- 7.1.1. Clothing
- 7.1.2. Industrial/Technical Applications
- 7.1.3. Household Applications
- 7.2. Market Analysis, Insights and Forecast - by Material Type
- 7.2.1. Cotton
- 7.2.2. Jute
- 7.2.3. Silk
- 7.2.4. Synthetics
- 7.2.5. Wool
- 7.3. Market Analysis, Insights and Forecast - by Process
- 7.3.1. Woven
- 7.3.2. Non-woven
- 7.1. Market Analysis, Insights and Forecast - by Application
- 8. South America Textile Industry in Africa Analysis, Insights and Forecast, 2020-2032
- 8.1. Market Analysis, Insights and Forecast - by Application
- 8.1.1. Clothing
- 8.1.2. Industrial/Technical Applications
- 8.1.3. Household Applications
- 8.2. Market Analysis, Insights and Forecast - by Material Type
- 8.2.1. Cotton
- 8.2.2. Jute
- 8.2.3. Silk
- 8.2.4. Synthetics
- 8.2.5. Wool
- 8.3. Market Analysis, Insights and Forecast - by Process
- 8.3.1. Woven
- 8.3.2. Non-woven
- 8.1. Market Analysis, Insights and Forecast - by Application
- 9. Europe Textile Industry in Africa Analysis, Insights and Forecast, 2020-2032
- 9.1. Market Analysis, Insights and Forecast - by Application
- 9.1.1. Clothing
- 9.1.2. Industrial/Technical Applications
- 9.1.3. Household Applications
- 9.2. Market Analysis, Insights and Forecast - by Material Type
- 9.2.1. Cotton
- 9.2.2. Jute
- 9.2.3. Silk
- 9.2.4. Synthetics
- 9.2.5. Wool
- 9.3. Market Analysis, Insights and Forecast - by Process
- 9.3.1. Woven
- 9.3.2. Non-woven
- 9.1. Market Analysis, Insights and Forecast - by Application
- 10. Middle East & Africa Textile Industry in Africa Analysis, Insights and Forecast, 2020-2032
- 10.1. Market Analysis, Insights and Forecast - by Application
- 10.1.1. Clothing
- 10.1.2. Industrial/Technical Applications
- 10.1.3. Household Applications
- 10.2. Market Analysis, Insights and Forecast - by Material Type
- 10.2.1. Cotton
- 10.2.2. Jute
- 10.2.3. Silk
- 10.2.4. Synthetics
- 10.2.5. Wool
- 10.3. Market Analysis, Insights and Forecast - by Process
- 10.3.1. Woven
- 10.3.2. Non-woven
- 10.1. Market Analysis, Insights and Forecast - by Application
- 11. Asia Pacific Textile Industry in Africa Analysis, Insights and Forecast, 2020-2032
- 11.1. Market Analysis, Insights and Forecast - by Application
- 11.1.1. Clothing
- 11.1.2. Industrial/Technical Applications
- 11.1.3. Household Applications
- 11.2. Market Analysis, Insights and Forecast - by Material Type
- 11.2.1. Cotton
- 11.2.2. Jute
- 11.2.3. Silk
- 11.2.4. Synthetics
- 11.2.5. Wool
- 11.3. Market Analysis, Insights and Forecast - by Process
- 11.3.1. Woven
- 11.3.2. Non-woven
- 11.1. Market Analysis, Insights and Forecast - by Application
- 12. Competitive Analysis
- 12.1. Company Profiles
- 12.1.1 Mediterranean Textile Company S A E
- 12.1.1.1. Company Overview
- 12.1.1.2. Products
- 12.1.1.3. Company Financials
- 12.1.1.4. SWOT Analysis
- 12.1.2 Saygin-Dima Textile Sc
- 12.1.2.1. Company Overview
- 12.1.2.2. Products
- 12.1.2.3. Company Financials
- 12.1.2.4. SWOT Analysis
- 12.1.3 Truworths
- 12.1.3.1. Company Overview
- 12.1.3.2. Products
- 12.1.3.3. Company Financials
- 12.1.3.4. SWOT Analysis
- 12.1.4 CIEL Textile Ltd
- 12.1.4.1. Company Overview
- 12.1.4.2. Products
- 12.1.4.3. Company Financials
- 12.1.4.4. SWOT Analysis
- 12.1.5 Almeda Textile Factory Plc
- 12.1.5.1. Company Overview
- 12.1.5.2. Products
- 12.1.5.3. Company Financials
- 12.1.5.4. SWOT Analysis
- 12.1.6 Woolworths
- 12.1.6.1. Company Overview
- 12.1.6.2. Products
- 12.1.6.3. Company Financials
- 12.1.6.4. SWOT Analysis
- 12.1.7 Edcon
- 12.1.7.1. Company Overview
- 12.1.7.2. Products
- 12.1.7.3. Company Financials
- 12.1.7.4. SWOT Analysis
- 12.1.8 Gelvenor Textiles
- 12.1.8.1. Company Overview
- 12.1.8.2. Products
- 12.1.8.3. Company Financials
- 12.1.8.4. SWOT Analysis
- 12.1.1 Mediterranean Textile Company S A E
- 12.2. Market Entropy
- 12.2.1 Company's Key Areas Served
- 12.2.2 Recent Developments
- 12.3. Company Market Share Analysis 2025
- 12.3.1 Top 5 Companies Market Share Analysis
- 12.3.2 Top 3 Companies Market Share Analysis
- 12.4. List of Potential Customers
- 13. Research Methodology
List of Figures
- Figure 1: Global Textile Industry in Africa Revenue Breakdown (billion, %) by Region 2025 & 2033
- Figure 2: Global Textile Industry in Africa Volume Breakdown (K Unit, %) by Region 2025 & 2033
- Figure 3: North America Textile Industry in Africa Revenue (billion), by Application 2025 & 2033
- Figure 4: North America Textile Industry in Africa Volume (K Unit), by Application 2025 & 2033
- Figure 5: North America Textile Industry in Africa Revenue Share (%), by Application 2025 & 2033
- Figure 6: North America Textile Industry in Africa Volume Share (%), by Application 2025 & 2033
- Figure 7: North America Textile Industry in Africa Revenue (billion), by Material Type 2025 & 2033
- Figure 8: North America Textile Industry in Africa Volume (K Unit), by Material Type 2025 & 2033
- Figure 9: North America Textile Industry in Africa Revenue Share (%), by Material Type 2025 & 2033
- Figure 10: North America Textile Industry in Africa Volume Share (%), by Material Type 2025 & 2033
- Figure 11: North America Textile Industry in Africa Revenue (billion), by Process 2025 & 2033
- Figure 12: North America Textile Industry in Africa Volume (K Unit), by Process 2025 & 2033
- Figure 13: North America Textile Industry in Africa Revenue Share (%), by Process 2025 & 2033
- Figure 14: North America Textile Industry in Africa Volume Share (%), by Process 2025 & 2033
- Figure 15: North America Textile Industry in Africa Revenue (billion), by Country 2025 & 2033
- Figure 16: North America Textile Industry in Africa Volume (K Unit), by Country 2025 & 2033
- Figure 17: North America Textile Industry in Africa Revenue Share (%), by Country 2025 & 2033
- Figure 18: North America Textile Industry in Africa Volume Share (%), by Country 2025 & 2033
- Figure 19: South America Textile Industry in Africa Revenue (billion), by Application 2025 & 2033
- Figure 20: South America Textile Industry in Africa Volume (K Unit), by Application 2025 & 2033
- Figure 21: South America Textile Industry in Africa Revenue Share (%), by Application 2025 & 2033
- Figure 22: South America Textile Industry in Africa Volume Share (%), by Application 2025 & 2033
- Figure 23: South America Textile Industry in Africa Revenue (billion), by Material Type 2025 & 2033
- Figure 24: South America Textile Industry in Africa Volume (K Unit), by Material Type 2025 & 2033
- Figure 25: South America Textile Industry in Africa Revenue Share (%), by Material Type 2025 & 2033
- Figure 26: South America Textile Industry in Africa Volume Share (%), by Material Type 2025 & 2033
- Figure 27: South America Textile Industry in Africa Revenue (billion), by Process 2025 & 2033
- Figure 28: South America Textile Industry in Africa Volume (K Unit), by Process 2025 & 2033
- Figure 29: South America Textile Industry in Africa Revenue Share (%), by Process 2025 & 2033
- Figure 30: South America Textile Industry in Africa Volume Share (%), by Process 2025 & 2033
- Figure 31: South America Textile Industry in Africa Revenue (billion), by Country 2025 & 2033
- Figure 32: South America Textile Industry in Africa Volume (K Unit), by Country 2025 & 2033
- Figure 33: South America Textile Industry in Africa Revenue Share (%), by Country 2025 & 2033
- Figure 34: South America Textile Industry in Africa Volume Share (%), by Country 2025 & 2033
- Figure 35: Europe Textile Industry in Africa Revenue (billion), by Application 2025 & 2033
- Figure 36: Europe Textile Industry in Africa Volume (K Unit), by Application 2025 & 2033
- Figure 37: Europe Textile Industry in Africa Revenue Share (%), by Application 2025 & 2033
- Figure 38: Europe Textile Industry in Africa Volume Share (%), by Application 2025 & 2033
- Figure 39: Europe Textile Industry in Africa Revenue (billion), by Material Type 2025 & 2033
- Figure 40: Europe Textile Industry in Africa Volume (K Unit), by Material Type 2025 & 2033
- Figure 41: Europe Textile Industry in Africa Revenue Share (%), by Material Type 2025 & 2033
- Figure 42: Europe Textile Industry in Africa Volume Share (%), by Material Type 2025 & 2033
- Figure 43: Europe Textile Industry in Africa Revenue (billion), by Process 2025 & 2033
- Figure 44: Europe Textile Industry in Africa Volume (K Unit), by Process 2025 & 2033
- Figure 45: Europe Textile Industry in Africa Revenue Share (%), by Process 2025 & 2033
- Figure 46: Europe Textile Industry in Africa Volume Share (%), by Process 2025 & 2033
- Figure 47: Europe Textile Industry in Africa Revenue (billion), by Country 2025 & 2033
- Figure 48: Europe Textile Industry in Africa Volume (K Unit), by Country 2025 & 2033
- Figure 49: Europe Textile Industry in Africa Revenue Share (%), by Country 2025 & 2033
- Figure 50: Europe Textile Industry in Africa Volume Share (%), by Country 2025 & 2033
- Figure 51: Middle East & Africa Textile Industry in Africa Revenue (billion), by Application 2025 & 2033
- Figure 52: Middle East & Africa Textile Industry in Africa Volume (K Unit), by Application 2025 & 2033
- Figure 53: Middle East & Africa Textile Industry in Africa Revenue Share (%), by Application 2025 & 2033
- Figure 54: Middle East & Africa Textile Industry in Africa Volume Share (%), by Application 2025 & 2033
- Figure 55: Middle East & Africa Textile Industry in Africa Revenue (billion), by Material Type 2025 & 2033
- Figure 56: Middle East & Africa Textile Industry in Africa Volume (K Unit), by Material Type 2025 & 2033
- Figure 57: Middle East & Africa Textile Industry in Africa Revenue Share (%), by Material Type 2025 & 2033
- Figure 58: Middle East & Africa Textile Industry in Africa Volume Share (%), by Material Type 2025 & 2033
- Figure 59: Middle East & Africa Textile Industry in Africa Revenue (billion), by Process 2025 & 2033
- Figure 60: Middle East & Africa Textile Industry in Africa Volume (K Unit), by Process 2025 & 2033
- Figure 61: Middle East & Africa Textile Industry in Africa Revenue Share (%), by Process 2025 & 2033
- Figure 62: Middle East & Africa Textile Industry in Africa Volume Share (%), by Process 2025 & 2033
- Figure 63: Middle East & Africa Textile Industry in Africa Revenue (billion), by Country 2025 & 2033
- Figure 64: Middle East & Africa Textile Industry in Africa Volume (K Unit), by Country 2025 & 2033
- Figure 65: Middle East & Africa Textile Industry in Africa Revenue Share (%), by Country 2025 & 2033
- Figure 66: Middle East & Africa Textile Industry in Africa Volume Share (%), by Country 2025 & 2033
- Figure 67: Asia Pacific Textile Industry in Africa Revenue (billion), by Application 2025 & 2033
- Figure 68: Asia Pacific Textile Industry in Africa Volume (K Unit), by Application 2025 & 2033
- Figure 69: Asia Pacific Textile Industry in Africa Revenue Share (%), by Application 2025 & 2033
- Figure 70: Asia Pacific Textile Industry in Africa Volume Share (%), by Application 2025 & 2033
- Figure 71: Asia Pacific Textile Industry in Africa Revenue (billion), by Material Type 2025 & 2033
- Figure 72: Asia Pacific Textile Industry in Africa Volume (K Unit), by Material Type 2025 & 2033
- Figure 73: Asia Pacific Textile Industry in Africa Revenue Share (%), by Material Type 2025 & 2033
- Figure 74: Asia Pacific Textile Industry in Africa Volume Share (%), by Material Type 2025 & 2033
- Figure 75: Asia Pacific Textile Industry in Africa Revenue (billion), by Process 2025 & 2033
- Figure 76: Asia Pacific Textile Industry in Africa Volume (K Unit), by Process 2025 & 2033
- Figure 77: Asia Pacific Textile Industry in Africa Revenue Share (%), by Process 2025 & 2033
- Figure 78: Asia Pacific Textile Industry in Africa Volume Share (%), by Process 2025 & 2033
- Figure 79: Asia Pacific Textile Industry in Africa Revenue (billion), by Country 2025 & 2033
- Figure 80: Asia Pacific Textile Industry in Africa Volume (K Unit), by Country 2025 & 2033
- Figure 81: Asia Pacific Textile Industry in Africa Revenue Share (%), by Country 2025 & 2033
- Figure 82: Asia Pacific Textile Industry in Africa Volume Share (%), by Country 2025 & 2033
List of Tables
- Table 1: Global Textile Industry in Africa Revenue billion Forecast, by Application 2020 & 2033
- Table 2: Global Textile Industry in Africa Volume K Unit Forecast, by Application 2020 & 2033
- Table 3: Global Textile Industry in Africa Revenue billion Forecast, by Material Type 2020 & 2033
- Table 4: Global Textile Industry in Africa Volume K Unit Forecast, by Material Type 2020 & 2033
- Table 5: Global Textile Industry in Africa Revenue billion Forecast, by Process 2020 & 2033
- Table 6: Global Textile Industry in Africa Volume K Unit Forecast, by Process 2020 & 2033
- Table 7: Global Textile Industry in Africa Revenue billion Forecast, by Region 2020 & 2033
- Table 8: Global Textile Industry in Africa Volume K Unit Forecast, by Region 2020 & 2033
- Table 9: Global Textile Industry in Africa Revenue billion Forecast, by Application 2020 & 2033
- Table 10: Global Textile Industry in Africa Volume K Unit Forecast, by Application 2020 & 2033
- Table 11: Global Textile Industry in Africa Revenue billion Forecast, by Material Type 2020 & 2033
- Table 12: Global Textile Industry in Africa Volume K Unit Forecast, by Material Type 2020 & 2033
- Table 13: Global Textile Industry in Africa Revenue billion Forecast, by Process 2020 & 2033
- Table 14: Global Textile Industry in Africa Volume K Unit Forecast, by Process 2020 & 2033
- Table 15: Global Textile Industry in Africa Revenue billion Forecast, by Country 2020 & 2033
- Table 16: Global Textile Industry in Africa Volume K Unit Forecast, by Country 2020 & 2033
- Table 17: United States Textile Industry in Africa Revenue (billion) Forecast, by Application 2020 & 2033
- Table 18: United States Textile Industry in Africa Volume (K Unit) Forecast, by Application 2020 & 2033
- Table 19: Canada Textile Industry in Africa Revenue (billion) Forecast, by Application 2020 & 2033
- Table 20: Canada Textile Industry in Africa Volume (K Unit) Forecast, by Application 2020 & 2033
- Table 21: Mexico Textile Industry in Africa Revenue (billion) Forecast, by Application 2020 & 2033
- Table 22: Mexico Textile Industry in Africa Volume (K Unit) Forecast, by Application 2020 & 2033
- Table 23: Global Textile Industry in Africa Revenue billion Forecast, by Application 2020 & 2033
- Table 24: Global Textile Industry in Africa Volume K Unit Forecast, by Application 2020 & 2033
- Table 25: Global Textile Industry in Africa Revenue billion Forecast, by Material Type 2020 & 2033
- Table 26: Global Textile Industry in Africa Volume K Unit Forecast, by Material Type 2020 & 2033
- Table 27: Global Textile Industry in Africa Revenue billion Forecast, by Process 2020 & 2033
- Table 28: Global Textile Industry in Africa Volume K Unit Forecast, by Process 2020 & 2033
- Table 29: Global Textile Industry in Africa Revenue billion Forecast, by Country 2020 & 2033
- Table 30: Global Textile Industry in Africa Volume K Unit Forecast, by Country 2020 & 2033
- Table 31: Brazil Textile Industry in Africa Revenue (billion) Forecast, by Application 2020 & 2033
- Table 32: Brazil Textile Industry in Africa Volume (K Unit) Forecast, by Application 2020 & 2033
- Table 33: Argentina Textile Industry in Africa Revenue (billion) Forecast, by Application 2020 & 2033
- Table 34: Argentina Textile Industry in Africa Volume (K Unit) Forecast, by Application 2020 & 2033
- Table 35: Rest of South America Textile Industry in Africa Revenue (billion) Forecast, by Application 2020 & 2033
- Table 36: Rest of South America Textile Industry in Africa Volume (K Unit) Forecast, by Application 2020 & 2033
- Table 37: Global Textile Industry in Africa Revenue billion Forecast, by Application 2020 & 2033
- Table 38: Global Textile Industry in Africa Volume K Unit Forecast, by Application 2020 & 2033
- Table 39: Global Textile Industry in Africa Revenue billion Forecast, by Material Type 2020 & 2033
- Table 40: Global Textile Industry in Africa Volume K Unit Forecast, by Material Type 2020 & 2033
- Table 41: Global Textile Industry in Africa Revenue billion Forecast, by Process 2020 & 2033
- Table 42: Global Textile Industry in Africa Volume K Unit Forecast, by Process 2020 & 2033
- Table 43: Global Textile Industry in Africa Revenue billion Forecast, by Country 2020 & 2033
- Table 44: Global Textile Industry in Africa Volume K Unit Forecast, by Country 2020 & 2033
- Table 45: United Kingdom Textile Industry in Africa Revenue (billion) Forecast, by Application 2020 & 2033
- Table 46: United Kingdom Textile Industry in Africa Volume (K Unit) Forecast, by Application 2020 & 2033
- Table 47: Germany Textile Industry in Africa Revenue (billion) Forecast, by Application 2020 & 2033
- Table 48: Germany Textile Industry in Africa Volume (K Unit) Forecast, by Application 2020 & 2033
- Table 49: France Textile Industry in Africa Revenue (billion) Forecast, by Application 2020 & 2033
- Table 50: France Textile Industry in Africa Volume (K Unit) Forecast, by Application 2020 & 2033
- Table 51: Italy Textile Industry in Africa Revenue (billion) Forecast, by Application 2020 & 2033
- Table 52: Italy Textile Industry in Africa Volume (K Unit) Forecast, by Application 2020 & 2033
- Table 53: Spain Textile Industry in Africa Revenue (billion) Forecast, by Application 2020 & 2033
- Table 54: Spain Textile Industry in Africa Volume (K Unit) Forecast, by Application 2020 & 2033
- Table 55: Russia Textile Industry in Africa Revenue (billion) Forecast, by Application 2020 & 2033
- Table 56: Russia Textile Industry in Africa Volume (K Unit) Forecast, by Application 2020 & 2033
- Table 57: Benelux Textile Industry in Africa Revenue (billion) Forecast, by Application 2020 & 2033
- Table 58: Benelux Textile Industry in Africa Volume (K Unit) Forecast, by Application 2020 & 2033
- Table 59: Nordics Textile Industry in Africa Revenue (billion) Forecast, by Application 2020 & 2033
- Table 60: Nordics Textile Industry in Africa Volume (K Unit) Forecast, by Application 2020 & 2033
- Table 61: Rest of Europe Textile Industry in Africa Revenue (billion) Forecast, by Application 2020 & 2033
- Table 62: Rest of Europe Textile Industry in Africa Volume (K Unit) Forecast, by Application 2020 & 2033
- Table 63: Global Textile Industry in Africa Revenue billion Forecast, by Application 2020 & 2033
- Table 64: Global Textile Industry in Africa Volume K Unit Forecast, by Application 2020 & 2033
- Table 65: Global Textile Industry in Africa Revenue billion Forecast, by Material Type 2020 & 2033
- Table 66: Global Textile Industry in Africa Volume K Unit Forecast, by Material Type 2020 & 2033
- Table 67: Global Textile Industry in Africa Revenue billion Forecast, by Process 2020 & 2033
- Table 68: Global Textile Industry in Africa Volume K Unit Forecast, by Process 2020 & 2033
- Table 69: Global Textile Industry in Africa Revenue billion Forecast, by Country 2020 & 2033
- Table 70: Global Textile Industry in Africa Volume K Unit Forecast, by Country 2020 & 2033
- Table 71: Turkey Textile Industry in Africa Revenue (billion) Forecast, by Application 2020 & 2033
- Table 72: Turkey Textile Industry in Africa Volume (K Unit) Forecast, by Application 2020 & 2033
- Table 73: Israel Textile Industry in Africa Revenue (billion) Forecast, by Application 2020 & 2033
- Table 74: Israel Textile Industry in Africa Volume (K Unit) Forecast, by Application 2020 & 2033
- Table 75: GCC Textile Industry in Africa Revenue (billion) Forecast, by Application 2020 & 2033
- Table 76: GCC Textile Industry in Africa Volume (K Unit) Forecast, by Application 2020 & 2033
- Table 77: North Africa Textile Industry in Africa Revenue (billion) Forecast, by Application 2020 & 2033
- Table 78: North Africa Textile Industry in Africa Volume (K Unit) Forecast, by Application 2020 & 2033
- Table 79: South Africa Textile Industry in Africa Revenue (billion) Forecast, by Application 2020 & 2033
- Table 80: South Africa Textile Industry in Africa Volume (K Unit) Forecast, by Application 2020 & 2033
- Table 81: Rest of Middle East & Africa Textile Industry in Africa Revenue (billion) Forecast, by Application 2020 & 2033
- Table 82: Rest of Middle East & Africa Textile Industry in Africa Volume (K Unit) Forecast, by Application 2020 & 2033
- Table 83: Global Textile Industry in Africa Revenue billion Forecast, by Application 2020 & 2033
- Table 84: Global Textile Industry in Africa Volume K Unit Forecast, by Application 2020 & 2033
- Table 85: Global Textile Industry in Africa Revenue billion Forecast, by Material Type 2020 & 2033
- Table 86: Global Textile Industry in Africa Volume K Unit Forecast, by Material Type 2020 & 2033
- Table 87: Global Textile Industry in Africa Revenue billion Forecast, by Process 2020 & 2033
- Table 88: Global Textile Industry in Africa Volume K Unit Forecast, by Process 2020 & 2033
- Table 89: Global Textile Industry in Africa Revenue billion Forecast, by Country 2020 & 2033
- Table 90: Global Textile Industry in Africa Volume K Unit Forecast, by Country 2020 & 2033
- Table 91: China Textile Industry in Africa Revenue (billion) Forecast, by Application 2020 & 2033
- Table 92: China Textile Industry in Africa Volume (K Unit) Forecast, by Application 2020 & 2033
- Table 93: India Textile Industry in Africa Revenue (billion) Forecast, by Application 2020 & 2033
- Table 94: India Textile Industry in Africa Volume (K Unit) Forecast, by Application 2020 & 2033
- Table 95: Japan Textile Industry in Africa Revenue (billion) Forecast, by Application 2020 & 2033
- Table 96: Japan Textile Industry in Africa Volume (K Unit) Forecast, by Application 2020 & 2033
- Table 97: South Korea Textile Industry in Africa Revenue (billion) Forecast, by Application 2020 & 2033
- Table 98: South Korea Textile Industry in Africa Volume (K Unit) Forecast, by Application 2020 & 2033
- Table 99: ASEAN Textile Industry in Africa Revenue (billion) Forecast, by Application 2020 & 2033
- Table 100: ASEAN Textile Industry in Africa Volume (K Unit) Forecast, by Application 2020 & 2033
- Table 101: Oceania Textile Industry in Africa Revenue (billion) Forecast, by Application 2020 & 2033
- Table 102: Oceania Textile Industry in Africa Volume (K Unit) Forecast, by Application 2020 & 2033
- Table 103: Rest of Asia Pacific Textile Industry in Africa Revenue (billion) Forecast, by Application 2020 & 2033
- Table 104: Rest of Asia Pacific Textile Industry in Africa Volume (K Unit) Forecast, by Application 2020 & 2033
Frequently Asked Questions
1. What is the projected Compound Annual Growth Rate (CAGR) of the Textile Industry in Africa?
The projected CAGR is approximately 4.73%.
2. Which companies are prominent players in the Textile Industry in Africa?
Key companies in the market include Mediterranean Textile Company S A E, Saygin-Dima Textile Sc, Truworths, CIEL Textile Ltd, Almeda Textile Factory Plc, Woolworths, Edcon, Gelvenor Textiles.
3. What are the main segments of the Textile Industry in Africa?
The market segments include Application, Material Type, Process.
4. Can you provide details about the market size?
The market size is estimated to be USD 39.21 billion as of 2022.
5. What are some drivers contributing to market growth?
The Rapid Urbanization And Changing Lifestyle Have Resulted In An Increase In The Need For Disposable Tableware; Growing Food Service Industry is Driving the Market.
6. What are the notable trends driving market growth?
Impact of AGOA on the African Textile Industry.
7. Are there any restraints impacting market growth?
The Use Of Single-Use Plastic Products Is Subject To Strict Government Regulations.; High Cost of Eco-Friendly Products and Limited Reusability.
8. Can you provide examples of recent developments in the market?
Feb 2021 - Truworths is launching a new value fashion chain called Primark. Truworths plans to open approximately 15 Primark stores over the next few months, with an average store size of 100m² during the launch trial phase. These will be a mix of standalone stores and others located in existing Truworths-owned stores. The launch of Primark suggests that Truworths which also owns Identity, YDE, Uzzi and Earthchild hopes to tap into the growth opportunities present in the budget clothing market focused on lower-income consumers.
9. What pricing options are available for accessing the report?
Pricing options include single-user, multi-user, and enterprise licenses priced at USD 3800, USD 4500, and USD 5800 respectively.
10. Is the market size provided in terms of value or volume?
The market size is provided in terms of value, measured in billion and volume, measured in K Unit.
11. Are there any specific market keywords associated with the report?
Yes, the market keyword associated with the report is "Textile Industry in Africa," which aids in identifying and referencing the specific market segment covered.
12. How do I determine which pricing option suits my needs best?
The pricing options vary based on user requirements and access needs. Individual users may opt for single-user licenses, while businesses requiring broader access may choose multi-user or enterprise licenses for cost-effective access to the report.
13. Are there any additional resources or data provided in the Textile Industry in Africa report?
While the report offers comprehensive insights, it's advisable to review the specific contents or supplementary materials provided to ascertain if additional resources or data are available.
14. How can I stay updated on further developments or reports in the Textile Industry in Africa?
To stay informed about further developments, trends, and reports in the Textile Industry in Africa, consider subscribing to industry newsletters, following relevant companies and organizations, or regularly checking reputable industry news sources and publications.
Methodology
Step 1 - Identification of Relevant Samples Size from Population Database


Step 2 - Approaches for Defining Global Market Size (Value, Volume* & Price*)

Note*: In applicable scenarios
Step 3 - Data Sources
Primary Research
- Web Analytics
- Survey Reports
- Research Institute
- Latest Research Reports
- Opinion Leaders
Secondary Research
- Annual Reports
- White Paper
- Latest Press Release
- Industry Association
- Paid Database
- Investor Presentations

Step 4 - Data Triangulation
Involves using different sources of information in order to increase the validity of a study
These sources are likely to be stakeholders in a program - participants, other researchers, program staff, other community members, and so on.
Then we put all data in single framework & apply various statistical tools to find out the dynamic on the market.
During the analysis stage, feedback from the stakeholder groups would be compared to determine areas of agreement as well as areas of divergence