
Key Insights
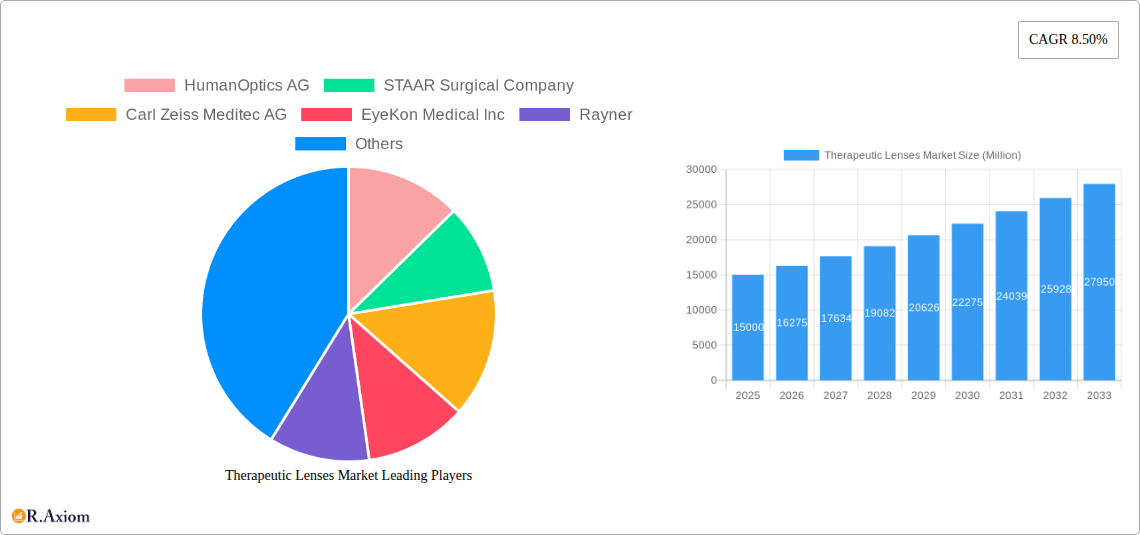
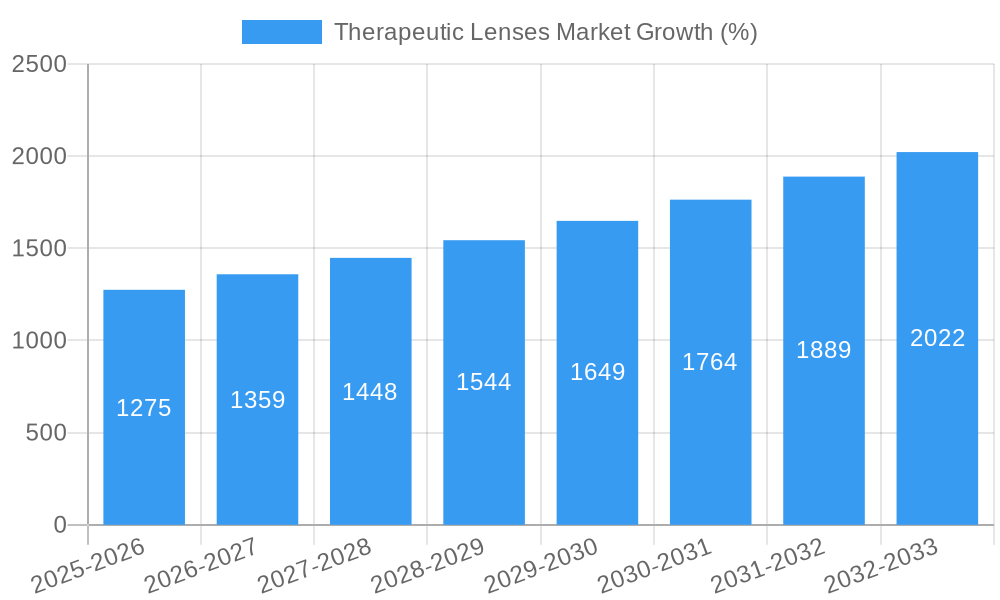
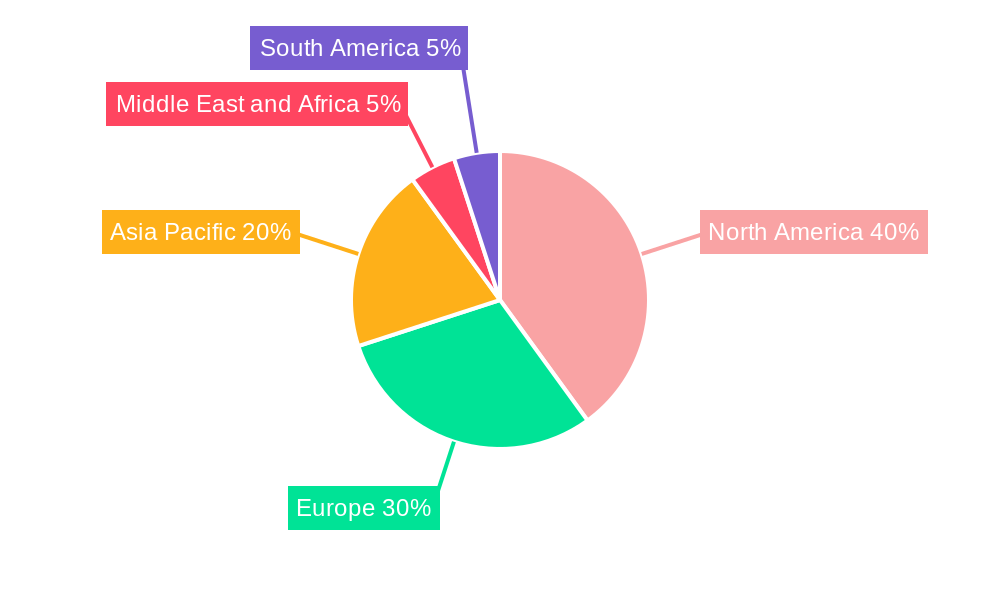
The global therapeutic lenses market, encompassing intraocular lenses (IOLs), toric IOLs, progressive lenses, and others, is experiencing robust growth, projected at a CAGR of 8.50% from 2025 to 2033. This expansion is driven by several key factors. The rising prevalence of age-related eye conditions like presbyopia and cataracts, coupled with an aging global population, significantly fuels market demand. Technological advancements in IOL design, leading to improved vision correction and reduced post-operative complications, further contribute to market growth. The increasing adoption of minimally invasive surgical techniques and a growing preference for outpatient procedures also support this expansion. Furthermore, the development of advanced IOLs, such as those incorporating drug delivery systems for treating glaucoma or other ocular diseases, presents significant growth opportunities. However, high procedure costs and the potential for complications can act as restraints, albeit partially mitigated by advancements in technology and surgical techniques. The market is segmented by product type (IOLs, toric IOLs, progressive lenses), application (myopia, presbyopia, corneal surgery, post-ocular surgery, drug delivery), and end-user (hospitals, ambulatory centers). North America and Europe currently dominate the market, driven by high healthcare expenditure and established healthcare infrastructure; however, Asia-Pacific is poised for significant growth due to rising disposable incomes and expanding healthcare access.
The market's future trajectory will be shaped by several trends. The increasing demand for premium IOLs offering superior visual outcomes is a significant driver. Furthermore, the focus on personalized medicine and the development of customized IOLs tailored to individual patient needs is expected to gain momentum. The integration of digital technologies, including telemedicine and AI-driven diagnostic tools, is also likely to impact the market, improving access to care and enhancing surgical precision. Continued research and development in IOL technology, focusing on biocompatible materials and improved efficacy, will further stimulate market growth. Competition among established players and the emergence of new entrants will enhance innovation and drive down costs, making therapeutic lenses more accessible to a wider patient population. Strategic partnerships and collaborations between manufacturers and healthcare providers will also play a crucial role in shaping the market landscape.
Therapeutic Lenses Market: A Comprehensive Report (2019-2033)
This in-depth report provides a comprehensive analysis of the global Therapeutic Lenses Market, offering valuable insights for stakeholders, investors, and industry professionals. Covering the period from 2019 to 2033, with a focus on 2025, this report meticulously examines market trends, competitive dynamics, and future growth potential. The report's detailed segmentation by product type (Intraocular Lenses, Toric Intraocular Lenses, Progressive Lenses, and Others), application (Myopia, Presbyopia, Corneal Surgery/Disorders, Post-Ocular Surgery, Drug Delivery, and Others), and end-user (Hospitals, Ambulatory Centers, and Other End Users) offers actionable insights for strategic decision-making. Key players like HumanOptics AG, STAAR Surgical Company, Carl Zeiss Meditec AG, and others are analyzed, providing a comprehensive overview of the market landscape. The report utilizes data from 2019-2024 as the historical period and projects market trends until 2033.
Therapeutic Lenses Market Concentration & Innovation
The Therapeutic Lenses market exhibits a moderately concentrated landscape, with a handful of multinational corporations holding significant market share. However, the presence of numerous smaller, specialized companies fosters innovation and competition. Market share data for 2024 suggests that the top five players collectively control approximately xx% of the global market. Johnson & Johnson Vision Care Inc., Alcon Inc., and Bausch Health Companies Inc. are consistently amongst the leading players, leveraging extensive distribution networks and strong brand recognition.
Innovation in therapeutic lenses is driven by advancements in materials science, surgical techniques, and a growing demand for improved visual outcomes. The regulatory landscape plays a crucial role, with stringent approvals required for new product launches. This necessitates substantial investment in research and development. Technological advancements such as the development of multifocal and accommodating IOLs are key drivers. Furthermore, the market is influenced by existing product substitutes, primarily spectacles and contact lenses, whose limitations drive patient demand for advanced therapeutic lenses. M&A activity is significant, with recent deals such as Bausch + Lomb's acquisition of AcuFocus indicative of strategic consolidation within the industry. These acquisitions often contribute to expanded product portfolios, increased market reach, and accelerated innovation. The average value of M&A deals in the past five years was approximately xx Million.
Therapeutic Lenses Market Industry Trends & Insights
The global therapeutic lenses market is experiencing robust growth, projected to reach xx Million by 2033, exhibiting a CAGR of xx% during the forecast period (2025-2033). This growth is primarily fueled by the rising prevalence of age-related eye conditions like cataracts and presbyopia, coupled with an aging global population. Technological advancements, particularly in the development of advanced IOLs like toric and multifocal lenses, offering improved visual acuity and reduced dependence on corrective eyewear, are key drivers. Consumer preference is shifting towards minimally invasive procedures and technologically superior lenses offering superior outcomes.
Increased healthcare expenditure, especially in developed economies, and improved healthcare infrastructure in developing nations contribute significantly to market expansion. The competitive landscape is characterized by both intense rivalry and strategic partnerships. Key players are continuously investing in R&D to develop innovative products and improve existing ones. Market penetration of advanced IOLs is increasing steadily, albeit varying regionally due to differences in healthcare access and affordability. The market is also influenced by evolving reimbursement policies and healthcare regulations.
Dominant Markets & Segments in Therapeutic Lenses Market
Leading Region: North America currently dominates the therapeutic lenses market, driven by high healthcare expenditure, advanced medical infrastructure, and a significant geriatric population. Europe follows closely, exhibiting strong growth due to similar factors.
Dominant Segment (Product Type): Intraocular lenses (IOLs) constitute the largest segment, owing to their extensive application in cataract surgery. This is further segmented by type such as toric and multifocal.
Dominant Segment (Application): Cataract treatment and presbyopia correction represent the dominant application segments, owing to the increasing prevalence of these conditions globally.
Dominant Segment (End User): Hospitals are the primary end-users, accounting for a significant proportion of market revenue, followed by ambulatory surgery centers.
Key Drivers:
- North America & Europe: High disposable income, advanced healthcare infrastructure, and a growing elderly population are key growth drivers.
- Asia-Pacific: Rising healthcare expenditure, improving healthcare infrastructure, and increased awareness of eye care are contributing to market growth.
Therapeutic Lenses Market Product Developments
Recent innovations in therapeutic lenses focus on enhanced biocompatibility, improved visual outcomes, and reduced surgical complications. The introduction of IOLs with advanced features like accommodating or multifocal optics allows for improved vision correction across various distances. Companies are also focusing on the development of smaller incision surgeries, reducing recovery time and enhancing patient experience. These advancements are driven by continuous technological progress, increasing customer demands for better visual outcomes and a heightened focus on patient comfort. The market fit for these new products is excellent due to increasing prevalence of age-related eye diseases and desire for better quality of life.
Report Scope & Segmentation Analysis
Product Type: The report segments the market into Intraocular Lenses (IOLs), Toric IOLs, Progressive Lenses, and Others. IOLs currently hold the largest market share with significant growth projected for toric and progressive lenses driven by improved patient outcomes. Each segment displays unique growth trajectories and competitive landscapes.
Application: The market is further segmented by application, including Myopia, Presbyopia, Corneal Surgery/Disorders, Post-Ocular Surgery, Drug Delivery, and Others. Presbyopia and Cataract related applications dominate and are expected to maintain significant market share.
End User: Hospitals, Ambulatory Surgical Centers, and Other End Users are considered. Hospitals currently hold the largest market share with consistent growth predicted across all segments.
Key Drivers of Therapeutic Lenses Market Growth
The therapeutic lenses market is primarily driven by the increasing prevalence of age-related eye diseases such as cataracts and presbyopia, coupled with a burgeoning geriatric population globally. Technological advancements leading to improved lens designs and surgical techniques also contribute significantly. Government initiatives promoting eye care and supportive reimbursement policies further boost market growth. The rising disposable income in developing economies, resulting in greater access to advanced healthcare services, is another key growth driver.
Challenges in the Therapeutic Lenses Market Sector
The therapeutic lenses market faces challenges such as stringent regulatory approvals, potential supply chain disruptions, and intense competition among established players. High R&D costs associated with developing innovative products pose another hurdle. The pricing pressures exerted by healthcare payers and rising material costs also influence profitability. Furthermore, the penetration of new technologies varies across regions, reflecting discrepancies in healthcare infrastructure and access.
Emerging Opportunities in Therapeutic Lenses Market
Emerging opportunities lie in the development of advanced lens materials, improved surgical techniques for reduced invasiveness, and expansion into untapped markets in developing nations. The growing demand for personalized medicine and the potential application of smart lenses are promising areas for future innovation. Furthermore, advancements in drug delivery systems integrated into IOLs represent a substantial growth opportunity.
Leading Players in the Therapeutic Lenses Market
- HumanOptics AG
- STAAR Surgical Company
- Carl Zeiss Meditec AG
- EyeKon Medical Inc
- Rayner
- Johnson & Johnson Vision Care Inc
- Lenstec Inc
- Alcon Inc
- Bausch Health Companies Inc
- Hoya Corporation
Key Developments in Therapeutic Lenses Market Industry
- January 2023: Bausch + Lomb acquired AcuFocus, expanding its IOL portfolio with the IC-8 Apthera lens.
- March 2023: AffaMed Technologies received TFDA approval for its MINI WELL series of IOLs in Taiwan.
Strategic Outlook for Therapeutic Lenses Market
The therapeutic lenses market is poised for substantial growth, fueled by an aging global population, technological advancements, and increased healthcare spending. Expanding into emerging markets and focusing on innovation will be crucial for companies to maintain a competitive edge. Strategic partnerships and collaborations will play a vital role in accelerating product development and market penetration. The focus on personalized medicine and improved patient outcomes will continue to shape future market trends.
Therapeutic Lenses Market Segmentation
-
1. Product Type
-
1.1. Intraocular Lenses
- 1.1.1. Monofocal Intraocular Lens
- 1.1.2. Accommodative Intraocular Lens
- 1.1.3. Multifocal Intraocular Lens
- 1.1.4. Toric Intraocular Lens
- 1.2. Progressive Lenses
- 1.3. Others
-
1.1. Intraocular Lenses
-
2. Application
- 2.1. Myopia
- 2.2. Presbyopia
- 2.3. Corneal Surgery/Disorders
- 2.4. Post Ocular Surgery
- 2.5. Drug Delivery
- 2.6. Others
-
3. End User
- 3.1. Hospitals
- 3.2. Ambulatory Centers
- 3.3. Other End Users
Therapeutic Lenses Market Segmentation By Geography
-
1. North America
- 1.1. United States
- 1.2. Canada
- 1.3. Mexico
-
2. Europe
- 2.1. Germany
- 2.2. United Kingdom
- 2.3. France
- 2.4. Italy
- 2.5. Spain
- 2.6. Rest of Europe
-
3. Asia Pacific
- 3.1. China
- 3.2. Japan
- 3.3. India
- 3.4. Australia
- 3.5. South Korea
- 3.6. Rest of Asia Pacific
-
4. Middle East and Africa
- 4.1. GCC
- 4.2. South Africa
- 4.3. Rest of Middle East and Africa
-
5. South America
- 5.1. Brazil
- 5.2. Argentina
- 5.3. Rest of South America
Therapeutic Lenses Market REPORT HIGHLIGHTS
| Aspects | Details |
|---|---|
| Study Period | 2019-2033 |
| Base Year | 2024 |
| Estimated Year | 2025 |
| Forecast Period | 2025-2033 |
| Historical Period | 2019-2024 |
| Growth Rate | CAGR of 8.50% from 2019-2033 |
| Segmentation |
|
Table of Contents
- 1. Introduction
- 1.1. Research Scope
- 1.2. Market Segmentation
- 1.3. Research Methodology
- 1.4. Definitions and Assumptions
- 2. Executive Summary
- 2.1. Introduction
- 3. Market Dynamics
- 3.1. Introduction
- 3.2. Market Drivers
- 3.2.1. Increasing Burden of Eye Diseases; Increasing Cases of Cataracts in the Diabetic Population; Rising Adoption of Advanced Premium IOLs
- 3.3. Market Restrains
- 3.3.1. Poor Quality and High Cost of Lens
- 3.4. Market Trends
- 3.4.1. Multifocal Intraocular Lens is Expected to Witness Healthy Growth Over the Forecast Period
- 4. Market Factor Analysis
- 4.1. Porters Five Forces
- 4.2. Supply/Value Chain
- 4.3. PESTEL analysis
- 4.4. Market Entropy
- 4.5. Patent/Trademark Analysis
- 5. Global Therapeutic Lenses Market Analysis, Insights and Forecast, 2019-2031
- 5.1. Market Analysis, Insights and Forecast - by Product Type
- 5.1.1. Intraocular Lenses
- 5.1.1.1. Monofocal Intraocular Lens
- 5.1.1.2. Accommodative Intraocular Lens
- 5.1.1.3. Multifocal Intraocular Lens
- 5.1.1.4. Toric Intraocular Lens
- 5.1.2. Progressive Lenses
- 5.1.3. Others
- 5.1.1. Intraocular Lenses
- 5.2. Market Analysis, Insights and Forecast - by Application
- 5.2.1. Myopia
- 5.2.2. Presbyopia
- 5.2.3. Corneal Surgery/Disorders
- 5.2.4. Post Ocular Surgery
- 5.2.5. Drug Delivery
- 5.2.6. Others
- 5.3. Market Analysis, Insights and Forecast - by End User
- 5.3.1. Hospitals
- 5.3.2. Ambulatory Centers
- 5.3.3. Other End Users
- 5.4. Market Analysis, Insights and Forecast - by Region
- 5.4.1. North America
- 5.4.2. Europe
- 5.4.3. Asia Pacific
- 5.4.4. Middle East and Africa
- 5.4.5. South America
- 5.1. Market Analysis, Insights and Forecast - by Product Type
- 6. North America Therapeutic Lenses Market Analysis, Insights and Forecast, 2019-2031
- 6.1. Market Analysis, Insights and Forecast - by Product Type
- 6.1.1. Intraocular Lenses
- 6.1.1.1. Monofocal Intraocular Lens
- 6.1.1.2. Accommodative Intraocular Lens
- 6.1.1.3. Multifocal Intraocular Lens
- 6.1.1.4. Toric Intraocular Lens
- 6.1.2. Progressive Lenses
- 6.1.3. Others
- 6.1.1. Intraocular Lenses
- 6.2. Market Analysis, Insights and Forecast - by Application
- 6.2.1. Myopia
- 6.2.2. Presbyopia
- 6.2.3. Corneal Surgery/Disorders
- 6.2.4. Post Ocular Surgery
- 6.2.5. Drug Delivery
- 6.2.6. Others
- 6.3. Market Analysis, Insights and Forecast - by End User
- 6.3.1. Hospitals
- 6.3.2. Ambulatory Centers
- 6.3.3. Other End Users
- 6.1. Market Analysis, Insights and Forecast - by Product Type
- 7. Europe Therapeutic Lenses Market Analysis, Insights and Forecast, 2019-2031
- 7.1. Market Analysis, Insights and Forecast - by Product Type
- 7.1.1. Intraocular Lenses
- 7.1.1.1. Monofocal Intraocular Lens
- 7.1.1.2. Accommodative Intraocular Lens
- 7.1.1.3. Multifocal Intraocular Lens
- 7.1.1.4. Toric Intraocular Lens
- 7.1.2. Progressive Lenses
- 7.1.3. Others
- 7.1.1. Intraocular Lenses
- 7.2. Market Analysis, Insights and Forecast - by Application
- 7.2.1. Myopia
- 7.2.2. Presbyopia
- 7.2.3. Corneal Surgery/Disorders
- 7.2.4. Post Ocular Surgery
- 7.2.5. Drug Delivery
- 7.2.6. Others
- 7.3. Market Analysis, Insights and Forecast - by End User
- 7.3.1. Hospitals
- 7.3.2. Ambulatory Centers
- 7.3.3. Other End Users
- 7.1. Market Analysis, Insights and Forecast - by Product Type
- 8. Asia Pacific Therapeutic Lenses Market Analysis, Insights and Forecast, 2019-2031
- 8.1. Market Analysis, Insights and Forecast - by Product Type
- 8.1.1. Intraocular Lenses
- 8.1.1.1. Monofocal Intraocular Lens
- 8.1.1.2. Accommodative Intraocular Lens
- 8.1.1.3. Multifocal Intraocular Lens
- 8.1.1.4. Toric Intraocular Lens
- 8.1.2. Progressive Lenses
- 8.1.3. Others
- 8.1.1. Intraocular Lenses
- 8.2. Market Analysis, Insights and Forecast - by Application
- 8.2.1. Myopia
- 8.2.2. Presbyopia
- 8.2.3. Corneal Surgery/Disorders
- 8.2.4. Post Ocular Surgery
- 8.2.5. Drug Delivery
- 8.2.6. Others
- 8.3. Market Analysis, Insights and Forecast - by End User
- 8.3.1. Hospitals
- 8.3.2. Ambulatory Centers
- 8.3.3. Other End Users
- 8.1. Market Analysis, Insights and Forecast - by Product Type
- 9. Middle East and Africa Therapeutic Lenses Market Analysis, Insights and Forecast, 2019-2031
- 9.1. Market Analysis, Insights and Forecast - by Product Type
- 9.1.1. Intraocular Lenses
- 9.1.1.1. Monofocal Intraocular Lens
- 9.1.1.2. Accommodative Intraocular Lens
- 9.1.1.3. Multifocal Intraocular Lens
- 9.1.1.4. Toric Intraocular Lens
- 9.1.2. Progressive Lenses
- 9.1.3. Others
- 9.1.1. Intraocular Lenses
- 9.2. Market Analysis, Insights and Forecast - by Application
- 9.2.1. Myopia
- 9.2.2. Presbyopia
- 9.2.3. Corneal Surgery/Disorders
- 9.2.4. Post Ocular Surgery
- 9.2.5. Drug Delivery
- 9.2.6. Others
- 9.3. Market Analysis, Insights and Forecast - by End User
- 9.3.1. Hospitals
- 9.3.2. Ambulatory Centers
- 9.3.3. Other End Users
- 9.1. Market Analysis, Insights and Forecast - by Product Type
- 10. South America Therapeutic Lenses Market Analysis, Insights and Forecast, 2019-2031
- 10.1. Market Analysis, Insights and Forecast - by Product Type
- 10.1.1. Intraocular Lenses
- 10.1.1.1. Monofocal Intraocular Lens
- 10.1.1.2. Accommodative Intraocular Lens
- 10.1.1.3. Multifocal Intraocular Lens
- 10.1.1.4. Toric Intraocular Lens
- 10.1.2. Progressive Lenses
- 10.1.3. Others
- 10.1.1. Intraocular Lenses
- 10.2. Market Analysis, Insights and Forecast - by Application
- 10.2.1. Myopia
- 10.2.2. Presbyopia
- 10.2.3. Corneal Surgery/Disorders
- 10.2.4. Post Ocular Surgery
- 10.2.5. Drug Delivery
- 10.2.6. Others
- 10.3. Market Analysis, Insights and Forecast - by End User
- 10.3.1. Hospitals
- 10.3.2. Ambulatory Centers
- 10.3.3. Other End Users
- 10.1. Market Analysis, Insights and Forecast - by Product Type
- 11. North America Therapeutic Lenses Market Analysis, Insights and Forecast, 2019-2031
- 11.1. Market Analysis, Insights and Forecast - By Country/Sub-region
- 11.1.1 United States
- 11.1.2 Canada
- 11.1.3 Mexico
- 12. Europe Therapeutic Lenses Market Analysis, Insights and Forecast, 2019-2031
- 12.1. Market Analysis, Insights and Forecast - By Country/Sub-region
- 12.1.1 Germany
- 12.1.2 United Kingdom
- 12.1.3 France
- 12.1.4 Italy
- 12.1.5 Spain
- 12.1.6 Rest of Europe
- 13. Asia Pacific Therapeutic Lenses Market Analysis, Insights and Forecast, 2019-2031
- 13.1. Market Analysis, Insights and Forecast - By Country/Sub-region
- 13.1.1 China
- 13.1.2 Japan
- 13.1.3 India
- 13.1.4 Australia
- 13.1.5 South Korea
- 13.1.6 Rest of Asia Pacific
- 14. Middle East and Africa Therapeutic Lenses Market Analysis, Insights and Forecast, 2019-2031
- 14.1. Market Analysis, Insights and Forecast - By Country/Sub-region
- 14.1.1 GCC
- 14.1.2 South Africa
- 14.1.3 Rest of Middle East and Africa
- 15. South America Therapeutic Lenses Market Analysis, Insights and Forecast, 2019-2031
- 15.1. Market Analysis, Insights and Forecast - By Country/Sub-region
- 15.1.1 Brazil
- 15.1.2 Argentina
- 15.1.3 Rest of South America
- 16. Competitive Analysis
- 16.1. Global Market Share Analysis 2024
- 16.2. Company Profiles
- 16.2.1 HumanOptics AG
- 16.2.1.1. Overview
- 16.2.1.2. Products
- 16.2.1.3. SWOT Analysis
- 16.2.1.4. Recent Developments
- 16.2.1.5. Financials (Based on Availability)
- 16.2.2 STAAR Surgical Company
- 16.2.2.1. Overview
- 16.2.2.2. Products
- 16.2.2.3. SWOT Analysis
- 16.2.2.4. Recent Developments
- 16.2.2.5. Financials (Based on Availability)
- 16.2.3 Carl Zeiss Meditec AG
- 16.2.3.1. Overview
- 16.2.3.2. Products
- 16.2.3.3. SWOT Analysis
- 16.2.3.4. Recent Developments
- 16.2.3.5. Financials (Based on Availability)
- 16.2.4 EyeKon Medical Inc
- 16.2.4.1. Overview
- 16.2.4.2. Products
- 16.2.4.3. SWOT Analysis
- 16.2.4.4. Recent Developments
- 16.2.4.5. Financials (Based on Availability)
- 16.2.5 Rayner
- 16.2.5.1. Overview
- 16.2.5.2. Products
- 16.2.5.3. SWOT Analysis
- 16.2.5.4. Recent Developments
- 16.2.5.5. Financials (Based on Availability)
- 16.2.6 Johnson and Johnson Vision Care Inc
- 16.2.6.1. Overview
- 16.2.6.2. Products
- 16.2.6.3. SWOT Analysis
- 16.2.6.4. Recent Developments
- 16.2.6.5. Financials (Based on Availability)
- 16.2.7 Lenstec Inc
- 16.2.7.1. Overview
- 16.2.7.2. Products
- 16.2.7.3. SWOT Analysis
- 16.2.7.4. Recent Developments
- 16.2.7.5. Financials (Based on Availability)
- 16.2.8 Alcon Inc
- 16.2.8.1. Overview
- 16.2.8.2. Products
- 16.2.8.3. SWOT Analysis
- 16.2.8.4. Recent Developments
- 16.2.8.5. Financials (Based on Availability)
- 16.2.9 Bausch Health Companies Inc
- 16.2.9.1. Overview
- 16.2.9.2. Products
- 16.2.9.3. SWOT Analysis
- 16.2.9.4. Recent Developments
- 16.2.9.5. Financials (Based on Availability)
- 16.2.10 Hoya Corporation
- 16.2.10.1. Overview
- 16.2.10.2. Products
- 16.2.10.3. SWOT Analysis
- 16.2.10.4. Recent Developments
- 16.2.10.5. Financials (Based on Availability)
- 16.2.1 HumanOptics AG
List of Figures
- Figure 1: Global Therapeutic Lenses Market Revenue Breakdown (Million, %) by Region 2024 & 2032
- Figure 2: Global Therapeutic Lenses Market Volume Breakdown (K Unit, %) by Region 2024 & 2032
- Figure 3: North America Therapeutic Lenses Market Revenue (Million), by Country 2024 & 2032
- Figure 4: North America Therapeutic Lenses Market Volume (K Unit), by Country 2024 & 2032
- Figure 5: North America Therapeutic Lenses Market Revenue Share (%), by Country 2024 & 2032
- Figure 6: North America Therapeutic Lenses Market Volume Share (%), by Country 2024 & 2032
- Figure 7: Europe Therapeutic Lenses Market Revenue (Million), by Country 2024 & 2032
- Figure 8: Europe Therapeutic Lenses Market Volume (K Unit), by Country 2024 & 2032
- Figure 9: Europe Therapeutic Lenses Market Revenue Share (%), by Country 2024 & 2032
- Figure 10: Europe Therapeutic Lenses Market Volume Share (%), by Country 2024 & 2032
- Figure 11: Asia Pacific Therapeutic Lenses Market Revenue (Million), by Country 2024 & 2032
- Figure 12: Asia Pacific Therapeutic Lenses Market Volume (K Unit), by Country 2024 & 2032
- Figure 13: Asia Pacific Therapeutic Lenses Market Revenue Share (%), by Country 2024 & 2032
- Figure 14: Asia Pacific Therapeutic Lenses Market Volume Share (%), by Country 2024 & 2032
- Figure 15: Middle East and Africa Therapeutic Lenses Market Revenue (Million), by Country 2024 & 2032
- Figure 16: Middle East and Africa Therapeutic Lenses Market Volume (K Unit), by Country 2024 & 2032
- Figure 17: Middle East and Africa Therapeutic Lenses Market Revenue Share (%), by Country 2024 & 2032
- Figure 18: Middle East and Africa Therapeutic Lenses Market Volume Share (%), by Country 2024 & 2032
- Figure 19: South America Therapeutic Lenses Market Revenue (Million), by Country 2024 & 2032
- Figure 20: South America Therapeutic Lenses Market Volume (K Unit), by Country 2024 & 2032
- Figure 21: South America Therapeutic Lenses Market Revenue Share (%), by Country 2024 & 2032
- Figure 22: South America Therapeutic Lenses Market Volume Share (%), by Country 2024 & 2032
- Figure 23: North America Therapeutic Lenses Market Revenue (Million), by Product Type 2024 & 2032
- Figure 24: North America Therapeutic Lenses Market Volume (K Unit), by Product Type 2024 & 2032
- Figure 25: North America Therapeutic Lenses Market Revenue Share (%), by Product Type 2024 & 2032
- Figure 26: North America Therapeutic Lenses Market Volume Share (%), by Product Type 2024 & 2032
- Figure 27: North America Therapeutic Lenses Market Revenue (Million), by Application 2024 & 2032
- Figure 28: North America Therapeutic Lenses Market Volume (K Unit), by Application 2024 & 2032
- Figure 29: North America Therapeutic Lenses Market Revenue Share (%), by Application 2024 & 2032
- Figure 30: North America Therapeutic Lenses Market Volume Share (%), by Application 2024 & 2032
- Figure 31: North America Therapeutic Lenses Market Revenue (Million), by End User 2024 & 2032
- Figure 32: North America Therapeutic Lenses Market Volume (K Unit), by End User 2024 & 2032
- Figure 33: North America Therapeutic Lenses Market Revenue Share (%), by End User 2024 & 2032
- Figure 34: North America Therapeutic Lenses Market Volume Share (%), by End User 2024 & 2032
- Figure 35: North America Therapeutic Lenses Market Revenue (Million), by Country 2024 & 2032
- Figure 36: North America Therapeutic Lenses Market Volume (K Unit), by Country 2024 & 2032
- Figure 37: North America Therapeutic Lenses Market Revenue Share (%), by Country 2024 & 2032
- Figure 38: North America Therapeutic Lenses Market Volume Share (%), by Country 2024 & 2032
- Figure 39: Europe Therapeutic Lenses Market Revenue (Million), by Product Type 2024 & 2032
- Figure 40: Europe Therapeutic Lenses Market Volume (K Unit), by Product Type 2024 & 2032
- Figure 41: Europe Therapeutic Lenses Market Revenue Share (%), by Product Type 2024 & 2032
- Figure 42: Europe Therapeutic Lenses Market Volume Share (%), by Product Type 2024 & 2032
- Figure 43: Europe Therapeutic Lenses Market Revenue (Million), by Application 2024 & 2032
- Figure 44: Europe Therapeutic Lenses Market Volume (K Unit), by Application 2024 & 2032
- Figure 45: Europe Therapeutic Lenses Market Revenue Share (%), by Application 2024 & 2032
- Figure 46: Europe Therapeutic Lenses Market Volume Share (%), by Application 2024 & 2032
- Figure 47: Europe Therapeutic Lenses Market Revenue (Million), by End User 2024 & 2032
- Figure 48: Europe Therapeutic Lenses Market Volume (K Unit), by End User 2024 & 2032
- Figure 49: Europe Therapeutic Lenses Market Revenue Share (%), by End User 2024 & 2032
- Figure 50: Europe Therapeutic Lenses Market Volume Share (%), by End User 2024 & 2032
- Figure 51: Europe Therapeutic Lenses Market Revenue (Million), by Country 2024 & 2032
- Figure 52: Europe Therapeutic Lenses Market Volume (K Unit), by Country 2024 & 2032
- Figure 53: Europe Therapeutic Lenses Market Revenue Share (%), by Country 2024 & 2032
- Figure 54: Europe Therapeutic Lenses Market Volume Share (%), by Country 2024 & 2032
- Figure 55: Asia Pacific Therapeutic Lenses Market Revenue (Million), by Product Type 2024 & 2032
- Figure 56: Asia Pacific Therapeutic Lenses Market Volume (K Unit), by Product Type 2024 & 2032
- Figure 57: Asia Pacific Therapeutic Lenses Market Revenue Share (%), by Product Type 2024 & 2032
- Figure 58: Asia Pacific Therapeutic Lenses Market Volume Share (%), by Product Type 2024 & 2032
- Figure 59: Asia Pacific Therapeutic Lenses Market Revenue (Million), by Application 2024 & 2032
- Figure 60: Asia Pacific Therapeutic Lenses Market Volume (K Unit), by Application 2024 & 2032
- Figure 61: Asia Pacific Therapeutic Lenses Market Revenue Share (%), by Application 2024 & 2032
- Figure 62: Asia Pacific Therapeutic Lenses Market Volume Share (%), by Application 2024 & 2032
- Figure 63: Asia Pacific Therapeutic Lenses Market Revenue (Million), by End User 2024 & 2032
- Figure 64: Asia Pacific Therapeutic Lenses Market Volume (K Unit), by End User 2024 & 2032
- Figure 65: Asia Pacific Therapeutic Lenses Market Revenue Share (%), by End User 2024 & 2032
- Figure 66: Asia Pacific Therapeutic Lenses Market Volume Share (%), by End User 2024 & 2032
- Figure 67: Asia Pacific Therapeutic Lenses Market Revenue (Million), by Country 2024 & 2032
- Figure 68: Asia Pacific Therapeutic Lenses Market Volume (K Unit), by Country 2024 & 2032
- Figure 69: Asia Pacific Therapeutic Lenses Market Revenue Share (%), by Country 2024 & 2032
- Figure 70: Asia Pacific Therapeutic Lenses Market Volume Share (%), by Country 2024 & 2032
- Figure 71: Middle East and Africa Therapeutic Lenses Market Revenue (Million), by Product Type 2024 & 2032
- Figure 72: Middle East and Africa Therapeutic Lenses Market Volume (K Unit), by Product Type 2024 & 2032
- Figure 73: Middle East and Africa Therapeutic Lenses Market Revenue Share (%), by Product Type 2024 & 2032
- Figure 74: Middle East and Africa Therapeutic Lenses Market Volume Share (%), by Product Type 2024 & 2032
- Figure 75: Middle East and Africa Therapeutic Lenses Market Revenue (Million), by Application 2024 & 2032
- Figure 76: Middle East and Africa Therapeutic Lenses Market Volume (K Unit), by Application 2024 & 2032
- Figure 77: Middle East and Africa Therapeutic Lenses Market Revenue Share (%), by Application 2024 & 2032
- Figure 78: Middle East and Africa Therapeutic Lenses Market Volume Share (%), by Application 2024 & 2032
- Figure 79: Middle East and Africa Therapeutic Lenses Market Revenue (Million), by End User 2024 & 2032
- Figure 80: Middle East and Africa Therapeutic Lenses Market Volume (K Unit), by End User 2024 & 2032
- Figure 81: Middle East and Africa Therapeutic Lenses Market Revenue Share (%), by End User 2024 & 2032
- Figure 82: Middle East and Africa Therapeutic Lenses Market Volume Share (%), by End User 2024 & 2032
- Figure 83: Middle East and Africa Therapeutic Lenses Market Revenue (Million), by Country 2024 & 2032
- Figure 84: Middle East and Africa Therapeutic Lenses Market Volume (K Unit), by Country 2024 & 2032
- Figure 85: Middle East and Africa Therapeutic Lenses Market Revenue Share (%), by Country 2024 & 2032
- Figure 86: Middle East and Africa Therapeutic Lenses Market Volume Share (%), by Country 2024 & 2032
- Figure 87: South America Therapeutic Lenses Market Revenue (Million), by Product Type 2024 & 2032
- Figure 88: South America Therapeutic Lenses Market Volume (K Unit), by Product Type 2024 & 2032
- Figure 89: South America Therapeutic Lenses Market Revenue Share (%), by Product Type 2024 & 2032
- Figure 90: South America Therapeutic Lenses Market Volume Share (%), by Product Type 2024 & 2032
- Figure 91: South America Therapeutic Lenses Market Revenue (Million), by Application 2024 & 2032
- Figure 92: South America Therapeutic Lenses Market Volume (K Unit), by Application 2024 & 2032
- Figure 93: South America Therapeutic Lenses Market Revenue Share (%), by Application 2024 & 2032
- Figure 94: South America Therapeutic Lenses Market Volume Share (%), by Application 2024 & 2032
- Figure 95: South America Therapeutic Lenses Market Revenue (Million), by End User 2024 & 2032
- Figure 96: South America Therapeutic Lenses Market Volume (K Unit), by End User 2024 & 2032
- Figure 97: South America Therapeutic Lenses Market Revenue Share (%), by End User 2024 & 2032
- Figure 98: South America Therapeutic Lenses Market Volume Share (%), by End User 2024 & 2032
- Figure 99: South America Therapeutic Lenses Market Revenue (Million), by Country 2024 & 2032
- Figure 100: South America Therapeutic Lenses Market Volume (K Unit), by Country 2024 & 2032
- Figure 101: South America Therapeutic Lenses Market Revenue Share (%), by Country 2024 & 2032
- Figure 102: South America Therapeutic Lenses Market Volume Share (%), by Country 2024 & 2032
List of Tables
- Table 1: Global Therapeutic Lenses Market Revenue Million Forecast, by Region 2019 & 2032
- Table 2: Global Therapeutic Lenses Market Volume K Unit Forecast, by Region 2019 & 2032
- Table 3: Global Therapeutic Lenses Market Revenue Million Forecast, by Product Type 2019 & 2032
- Table 4: Global Therapeutic Lenses Market Volume K Unit Forecast, by Product Type 2019 & 2032
- Table 5: Global Therapeutic Lenses Market Revenue Million Forecast, by Application 2019 & 2032
- Table 6: Global Therapeutic Lenses Market Volume K Unit Forecast, by Application 2019 & 2032
- Table 7: Global Therapeutic Lenses Market Revenue Million Forecast, by End User 2019 & 2032
- Table 8: Global Therapeutic Lenses Market Volume K Unit Forecast, by End User 2019 & 2032
- Table 9: Global Therapeutic Lenses Market Revenue Million Forecast, by Region 2019 & 2032
- Table 10: Global Therapeutic Lenses Market Volume K Unit Forecast, by Region 2019 & 2032
- Table 11: Global Therapeutic Lenses Market Revenue Million Forecast, by Country 2019 & 2032
- Table 12: Global Therapeutic Lenses Market Volume K Unit Forecast, by Country 2019 & 2032
- Table 13: United States Therapeutic Lenses Market Revenue (Million) Forecast, by Application 2019 & 2032
- Table 14: United States Therapeutic Lenses Market Volume (K Unit) Forecast, by Application 2019 & 2032
- Table 15: Canada Therapeutic Lenses Market Revenue (Million) Forecast, by Application 2019 & 2032
- Table 16: Canada Therapeutic Lenses Market Volume (K Unit) Forecast, by Application 2019 & 2032
- Table 17: Mexico Therapeutic Lenses Market Revenue (Million) Forecast, by Application 2019 & 2032
- Table 18: Mexico Therapeutic Lenses Market Volume (K Unit) Forecast, by Application 2019 & 2032
- Table 19: Global Therapeutic Lenses Market Revenue Million Forecast, by Country 2019 & 2032
- Table 20: Global Therapeutic Lenses Market Volume K Unit Forecast, by Country 2019 & 2032
- Table 21: Germany Therapeutic Lenses Market Revenue (Million) Forecast, by Application 2019 & 2032
- Table 22: Germany Therapeutic Lenses Market Volume (K Unit) Forecast, by Application 2019 & 2032
- Table 23: United Kingdom Therapeutic Lenses Market Revenue (Million) Forecast, by Application 2019 & 2032
- Table 24: United Kingdom Therapeutic Lenses Market Volume (K Unit) Forecast, by Application 2019 & 2032
- Table 25: France Therapeutic Lenses Market Revenue (Million) Forecast, by Application 2019 & 2032
- Table 26: France Therapeutic Lenses Market Volume (K Unit) Forecast, by Application 2019 & 2032
- Table 27: Italy Therapeutic Lenses Market Revenue (Million) Forecast, by Application 2019 & 2032
- Table 28: Italy Therapeutic Lenses Market Volume (K Unit) Forecast, by Application 2019 & 2032
- Table 29: Spain Therapeutic Lenses Market Revenue (Million) Forecast, by Application 2019 & 2032
- Table 30: Spain Therapeutic Lenses Market Volume (K Unit) Forecast, by Application 2019 & 2032
- Table 31: Rest of Europe Therapeutic Lenses Market Revenue (Million) Forecast, by Application 2019 & 2032
- Table 32: Rest of Europe Therapeutic Lenses Market Volume (K Unit) Forecast, by Application 2019 & 2032
- Table 33: Global Therapeutic Lenses Market Revenue Million Forecast, by Country 2019 & 2032
- Table 34: Global Therapeutic Lenses Market Volume K Unit Forecast, by Country 2019 & 2032
- Table 35: China Therapeutic Lenses Market Revenue (Million) Forecast, by Application 2019 & 2032
- Table 36: China Therapeutic Lenses Market Volume (K Unit) Forecast, by Application 2019 & 2032
- Table 37: Japan Therapeutic Lenses Market Revenue (Million) Forecast, by Application 2019 & 2032
- Table 38: Japan Therapeutic Lenses Market Volume (K Unit) Forecast, by Application 2019 & 2032
- Table 39: India Therapeutic Lenses Market Revenue (Million) Forecast, by Application 2019 & 2032
- Table 40: India Therapeutic Lenses Market Volume (K Unit) Forecast, by Application 2019 & 2032
- Table 41: Australia Therapeutic Lenses Market Revenue (Million) Forecast, by Application 2019 & 2032
- Table 42: Australia Therapeutic Lenses Market Volume (K Unit) Forecast, by Application 2019 & 2032
- Table 43: South Korea Therapeutic Lenses Market Revenue (Million) Forecast, by Application 2019 & 2032
- Table 44: South Korea Therapeutic Lenses Market Volume (K Unit) Forecast, by Application 2019 & 2032
- Table 45: Rest of Asia Pacific Therapeutic Lenses Market Revenue (Million) Forecast, by Application 2019 & 2032
- Table 46: Rest of Asia Pacific Therapeutic Lenses Market Volume (K Unit) Forecast, by Application 2019 & 2032
- Table 47: Global Therapeutic Lenses Market Revenue Million Forecast, by Country 2019 & 2032
- Table 48: Global Therapeutic Lenses Market Volume K Unit Forecast, by Country 2019 & 2032
- Table 49: GCC Therapeutic Lenses Market Revenue (Million) Forecast, by Application 2019 & 2032
- Table 50: GCC Therapeutic Lenses Market Volume (K Unit) Forecast, by Application 2019 & 2032
- Table 51: South Africa Therapeutic Lenses Market Revenue (Million) Forecast, by Application 2019 & 2032
- Table 52: South Africa Therapeutic Lenses Market Volume (K Unit) Forecast, by Application 2019 & 2032
- Table 53: Rest of Middle East and Africa Therapeutic Lenses Market Revenue (Million) Forecast, by Application 2019 & 2032
- Table 54: Rest of Middle East and Africa Therapeutic Lenses Market Volume (K Unit) Forecast, by Application 2019 & 2032
- Table 55: Global Therapeutic Lenses Market Revenue Million Forecast, by Country 2019 & 2032
- Table 56: Global Therapeutic Lenses Market Volume K Unit Forecast, by Country 2019 & 2032
- Table 57: Brazil Therapeutic Lenses Market Revenue (Million) Forecast, by Application 2019 & 2032
- Table 58: Brazil Therapeutic Lenses Market Volume (K Unit) Forecast, by Application 2019 & 2032
- Table 59: Argentina Therapeutic Lenses Market Revenue (Million) Forecast, by Application 2019 & 2032
- Table 60: Argentina Therapeutic Lenses Market Volume (K Unit) Forecast, by Application 2019 & 2032
- Table 61: Rest of South America Therapeutic Lenses Market Revenue (Million) Forecast, by Application 2019 & 2032
- Table 62: Rest of South America Therapeutic Lenses Market Volume (K Unit) Forecast, by Application 2019 & 2032
- Table 63: Global Therapeutic Lenses Market Revenue Million Forecast, by Product Type 2019 & 2032
- Table 64: Global Therapeutic Lenses Market Volume K Unit Forecast, by Product Type 2019 & 2032
- Table 65: Global Therapeutic Lenses Market Revenue Million Forecast, by Application 2019 & 2032
- Table 66: Global Therapeutic Lenses Market Volume K Unit Forecast, by Application 2019 & 2032
- Table 67: Global Therapeutic Lenses Market Revenue Million Forecast, by End User 2019 & 2032
- Table 68: Global Therapeutic Lenses Market Volume K Unit Forecast, by End User 2019 & 2032
- Table 69: Global Therapeutic Lenses Market Revenue Million Forecast, by Country 2019 & 2032
- Table 70: Global Therapeutic Lenses Market Volume K Unit Forecast, by Country 2019 & 2032
- Table 71: United States Therapeutic Lenses Market Revenue (Million) Forecast, by Application 2019 & 2032
- Table 72: United States Therapeutic Lenses Market Volume (K Unit) Forecast, by Application 2019 & 2032
- Table 73: Canada Therapeutic Lenses Market Revenue (Million) Forecast, by Application 2019 & 2032
- Table 74: Canada Therapeutic Lenses Market Volume (K Unit) Forecast, by Application 2019 & 2032
- Table 75: Mexico Therapeutic Lenses Market Revenue (Million) Forecast, by Application 2019 & 2032
- Table 76: Mexico Therapeutic Lenses Market Volume (K Unit) Forecast, by Application 2019 & 2032
- Table 77: Global Therapeutic Lenses Market Revenue Million Forecast, by Product Type 2019 & 2032
- Table 78: Global Therapeutic Lenses Market Volume K Unit Forecast, by Product Type 2019 & 2032
- Table 79: Global Therapeutic Lenses Market Revenue Million Forecast, by Application 2019 & 2032
- Table 80: Global Therapeutic Lenses Market Volume K Unit Forecast, by Application 2019 & 2032
- Table 81: Global Therapeutic Lenses Market Revenue Million Forecast, by End User 2019 & 2032
- Table 82: Global Therapeutic Lenses Market Volume K Unit Forecast, by End User 2019 & 2032
- Table 83: Global Therapeutic Lenses Market Revenue Million Forecast, by Country 2019 & 2032
- Table 84: Global Therapeutic Lenses Market Volume K Unit Forecast, by Country 2019 & 2032
- Table 85: Germany Therapeutic Lenses Market Revenue (Million) Forecast, by Application 2019 & 2032
- Table 86: Germany Therapeutic Lenses Market Volume (K Unit) Forecast, by Application 2019 & 2032
- Table 87: United Kingdom Therapeutic Lenses Market Revenue (Million) Forecast, by Application 2019 & 2032
- Table 88: United Kingdom Therapeutic Lenses Market Volume (K Unit) Forecast, by Application 2019 & 2032
- Table 89: France Therapeutic Lenses Market Revenue (Million) Forecast, by Application 2019 & 2032
- Table 90: France Therapeutic Lenses Market Volume (K Unit) Forecast, by Application 2019 & 2032
- Table 91: Italy Therapeutic Lenses Market Revenue (Million) Forecast, by Application 2019 & 2032
- Table 92: Italy Therapeutic Lenses Market Volume (K Unit) Forecast, by Application 2019 & 2032
- Table 93: Spain Therapeutic Lenses Market Revenue (Million) Forecast, by Application 2019 & 2032
- Table 94: Spain Therapeutic Lenses Market Volume (K Unit) Forecast, by Application 2019 & 2032
- Table 95: Rest of Europe Therapeutic Lenses Market Revenue (Million) Forecast, by Application 2019 & 2032
- Table 96: Rest of Europe Therapeutic Lenses Market Volume (K Unit) Forecast, by Application 2019 & 2032
- Table 97: Global Therapeutic Lenses Market Revenue Million Forecast, by Product Type 2019 & 2032
- Table 98: Global Therapeutic Lenses Market Volume K Unit Forecast, by Product Type 2019 & 2032
- Table 99: Global Therapeutic Lenses Market Revenue Million Forecast, by Application 2019 & 2032
- Table 100: Global Therapeutic Lenses Market Volume K Unit Forecast, by Application 2019 & 2032
- Table 101: Global Therapeutic Lenses Market Revenue Million Forecast, by End User 2019 & 2032
- Table 102: Global Therapeutic Lenses Market Volume K Unit Forecast, by End User 2019 & 2032
- Table 103: Global Therapeutic Lenses Market Revenue Million Forecast, by Country 2019 & 2032
- Table 104: Global Therapeutic Lenses Market Volume K Unit Forecast, by Country 2019 & 2032
- Table 105: China Therapeutic Lenses Market Revenue (Million) Forecast, by Application 2019 & 2032
- Table 106: China Therapeutic Lenses Market Volume (K Unit) Forecast, by Application 2019 & 2032
- Table 107: Japan Therapeutic Lenses Market Revenue (Million) Forecast, by Application 2019 & 2032
- Table 108: Japan Therapeutic Lenses Market Volume (K Unit) Forecast, by Application 2019 & 2032
- Table 109: India Therapeutic Lenses Market Revenue (Million) Forecast, by Application 2019 & 2032
- Table 110: India Therapeutic Lenses Market Volume (K Unit) Forecast, by Application 2019 & 2032
- Table 111: Australia Therapeutic Lenses Market Revenue (Million) Forecast, by Application 2019 & 2032
- Table 112: Australia Therapeutic Lenses Market Volume (K Unit) Forecast, by Application 2019 & 2032
- Table 113: South Korea Therapeutic Lenses Market Revenue (Million) Forecast, by Application 2019 & 2032
- Table 114: South Korea Therapeutic Lenses Market Volume (K Unit) Forecast, by Application 2019 & 2032
- Table 115: Rest of Asia Pacific Therapeutic Lenses Market Revenue (Million) Forecast, by Application 2019 & 2032
- Table 116: Rest of Asia Pacific Therapeutic Lenses Market Volume (K Unit) Forecast, by Application 2019 & 2032
- Table 117: Global Therapeutic Lenses Market Revenue Million Forecast, by Product Type 2019 & 2032
- Table 118: Global Therapeutic Lenses Market Volume K Unit Forecast, by Product Type 2019 & 2032
- Table 119: Global Therapeutic Lenses Market Revenue Million Forecast, by Application 2019 & 2032
- Table 120: Global Therapeutic Lenses Market Volume K Unit Forecast, by Application 2019 & 2032
- Table 121: Global Therapeutic Lenses Market Revenue Million Forecast, by End User 2019 & 2032
- Table 122: Global Therapeutic Lenses Market Volume K Unit Forecast, by End User 2019 & 2032
- Table 123: Global Therapeutic Lenses Market Revenue Million Forecast, by Country 2019 & 2032
- Table 124: Global Therapeutic Lenses Market Volume K Unit Forecast, by Country 2019 & 2032
- Table 125: GCC Therapeutic Lenses Market Revenue (Million) Forecast, by Application 2019 & 2032
- Table 126: GCC Therapeutic Lenses Market Volume (K Unit) Forecast, by Application 2019 & 2032
- Table 127: South Africa Therapeutic Lenses Market Revenue (Million) Forecast, by Application 2019 & 2032
- Table 128: South Africa Therapeutic Lenses Market Volume (K Unit) Forecast, by Application 2019 & 2032
- Table 129: Rest of Middle East and Africa Therapeutic Lenses Market Revenue (Million) Forecast, by Application 2019 & 2032
- Table 130: Rest of Middle East and Africa Therapeutic Lenses Market Volume (K Unit) Forecast, by Application 2019 & 2032
- Table 131: Global Therapeutic Lenses Market Revenue Million Forecast, by Product Type 2019 & 2032
- Table 132: Global Therapeutic Lenses Market Volume K Unit Forecast, by Product Type 2019 & 2032
- Table 133: Global Therapeutic Lenses Market Revenue Million Forecast, by Application 2019 & 2032
- Table 134: Global Therapeutic Lenses Market Volume K Unit Forecast, by Application 2019 & 2032
- Table 135: Global Therapeutic Lenses Market Revenue Million Forecast, by End User 2019 & 2032
- Table 136: Global Therapeutic Lenses Market Volume K Unit Forecast, by End User 2019 & 2032
- Table 137: Global Therapeutic Lenses Market Revenue Million Forecast, by Country 2019 & 2032
- Table 138: Global Therapeutic Lenses Market Volume K Unit Forecast, by Country 2019 & 2032
- Table 139: Brazil Therapeutic Lenses Market Revenue (Million) Forecast, by Application 2019 & 2032
- Table 140: Brazil Therapeutic Lenses Market Volume (K Unit) Forecast, by Application 2019 & 2032
- Table 141: Argentina Therapeutic Lenses Market Revenue (Million) Forecast, by Application 2019 & 2032
- Table 142: Argentina Therapeutic Lenses Market Volume (K Unit) Forecast, by Application 2019 & 2032
- Table 143: Rest of South America Therapeutic Lenses Market Revenue (Million) Forecast, by Application 2019 & 2032
- Table 144: Rest of South America Therapeutic Lenses Market Volume (K Unit) Forecast, by Application 2019 & 2032
Frequently Asked Questions
1. What is the projected Compound Annual Growth Rate (CAGR) of the Therapeutic Lenses Market?
The projected CAGR is approximately 8.50%.
2. Which companies are prominent players in the Therapeutic Lenses Market?
Key companies in the market include HumanOptics AG, STAAR Surgical Company, Carl Zeiss Meditec AG, EyeKon Medical Inc, Rayner, Johnson and Johnson Vision Care Inc, Lenstec Inc, Alcon Inc, Bausch Health Companies Inc, Hoya Corporation.
3. What are the main segments of the Therapeutic Lenses Market?
The market segments include Product Type, Application, End User.
4. Can you provide details about the market size?
The market size is estimated to be USD XX Million as of 2022.
5. What are some drivers contributing to market growth?
Increasing Burden of Eye Diseases; Increasing Cases of Cataracts in the Diabetic Population; Rising Adoption of Advanced Premium IOLs.
6. What are the notable trends driving market growth?
Multifocal Intraocular Lens is Expected to Witness Healthy Growth Over the Forecast Period.
7. Are there any restraints impacting market growth?
Poor Quality and High Cost of Lens.
8. Can you provide examples of recent developments in the market?
March 2023: AffaMed Technologies, a joint venture established between AffaMed Therapeutics and SIFI S.p.A., announced that the Taiwan Food and Drug Administration (TFDA) has approved its MINI WELL, MINI WELL PROXA, MINI WELL TORIC and MINI 4 Ready intraocular lens (IOL) surgical implants for use in cataract treatment in Taiwan.
9. What pricing options are available for accessing the report?
Pricing options include single-user, multi-user, and enterprise licenses priced at USD 4750, USD 5250, and USD 8750 respectively.
10. Is the market size provided in terms of value or volume?
The market size is provided in terms of value, measured in Million and volume, measured in K Unit.
11. Are there any specific market keywords associated with the report?
Yes, the market keyword associated with the report is "Therapeutic Lenses Market," which aids in identifying and referencing the specific market segment covered.
12. How do I determine which pricing option suits my needs best?
The pricing options vary based on user requirements and access needs. Individual users may opt for single-user licenses, while businesses requiring broader access may choose multi-user or enterprise licenses for cost-effective access to the report.
13. Are there any additional resources or data provided in the Therapeutic Lenses Market report?
While the report offers comprehensive insights, it's advisable to review the specific contents or supplementary materials provided to ascertain if additional resources or data are available.
14. How can I stay updated on further developments or reports in the Therapeutic Lenses Market?
To stay informed about further developments, trends, and reports in the Therapeutic Lenses Market, consider subscribing to industry newsletters, following relevant companies and organizations, or regularly checking reputable industry news sources and publications.
Methodology
Step 1 - Identification of Relevant Samples Size from Population Database


Step 2 - Approaches for Defining Global Market Size (Value, Volume* & Price*)

Note*: In applicable scenarios
Step 3 - Data Sources
Primary Research
- Web Analytics
- Survey Reports
- Research Institute
- Latest Research Reports
- Opinion Leaders
Secondary Research
- Annual Reports
- White Paper
- Latest Press Release
- Industry Association
- Paid Database
- Investor Presentations

Step 4 - Data Triangulation
Involves using different sources of information in order to increase the validity of a study
These sources are likely to be stakeholders in a program - participants, other researchers, program staff, other community members, and so on.
Then we put all data in single framework & apply various statistical tools to find out the dynamic on the market.
During the analysis stage, feedback from the stakeholder groups would be compared to determine areas of agreement as well as areas of divergence


